• support@madhedgefundtrader.com
  • Member Login
Mad Hedge Fund Trader
  • Home
  • About
  • Store
  • Luncheons
  • Testimonials
  • Contact Us
  • Click to open the search input field Click to open the search input field Search
  • Menu Menu

July 31, 2024

Jacque's Post


(EXAMINING THE TECHNICALS IN NVIDIA (NVDA) AS WE NAVIGATE THE MID-SUMMER STOCK SWOON)

July 31, 2024


Hello everyone,

The long-awaited summer vacation has arrived for the stock market.   Stocks are at the mercy of investors who decided one day that they wanted to own something different rather than just technology stocks.  So, the sell button was decidedly pushed en mass, and funds then poured into a variety of other sectors, most notably small caps, and interest-sensitive sectors, which include home builders, health, and energy stocks. Of course, this movement has a lot to do with rate cuts that are not too far away.

But also, the tech sector is taking a healthy break.  This sector has run very hard at what seemed like 12-cylinder horsepower. Eventually, a rest is needed.  We are witnessing a broadening of the market as we head into the final months before the U.S. election takes place.

One of the stock favorites in the tech sector is Nvidia (NVDA).  It is one stock that has definitely been on a sprint to the stars and is now taking a much-needed rest.   Using Inside Edge Capital charts, let’s take a deeper dive into how that stock looks from a technical perspective, and where we might see significant support levels.

Firstly, let’s look at the 200-day moving average, shown in the dotted blue line in the chart below.   You will notice that it is trending higher, and the stock price is still well above the 200-day MA.    The stock is still in a well-established up trend.  Since it broke above the MA in January 2023 NVDA is still around 540% higher since that move even after the recent sell-off.


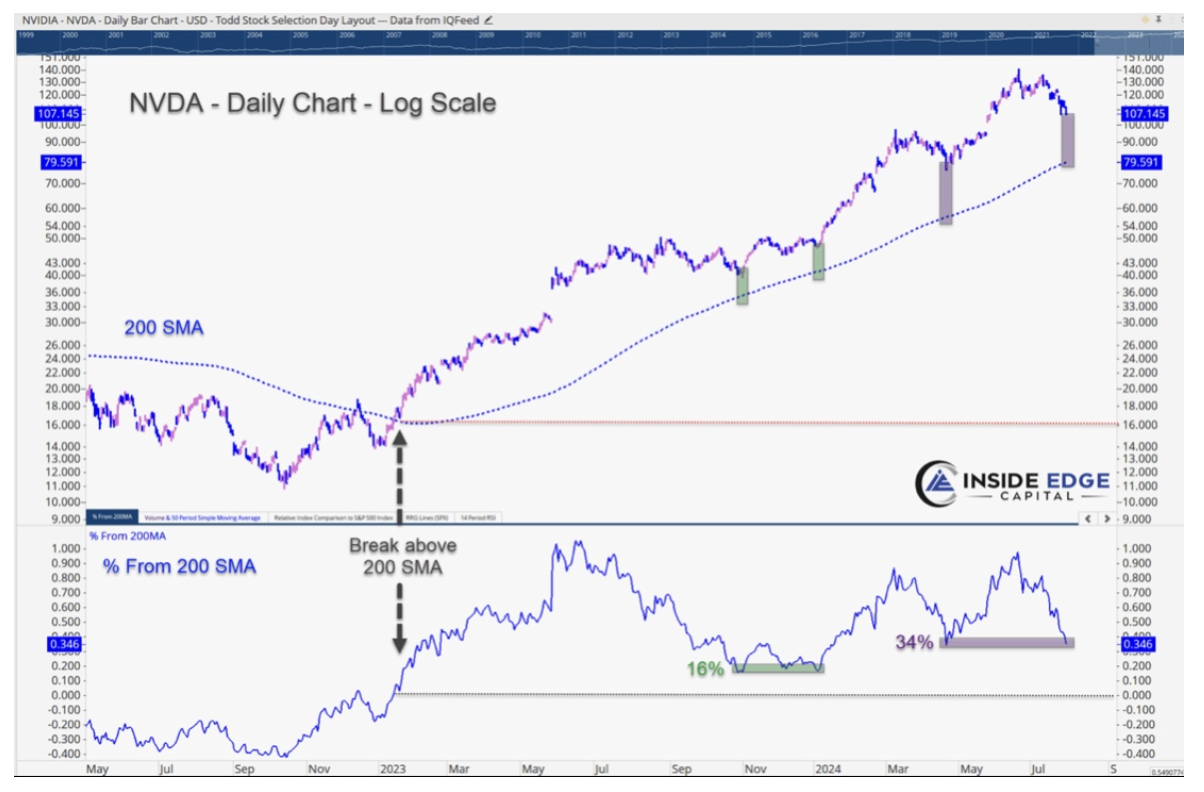
There is a possibility that NVDA falls into a consolidation pattern as we wait for earnings at the end of August, which would allow the moving average to trend higher closing the gap.


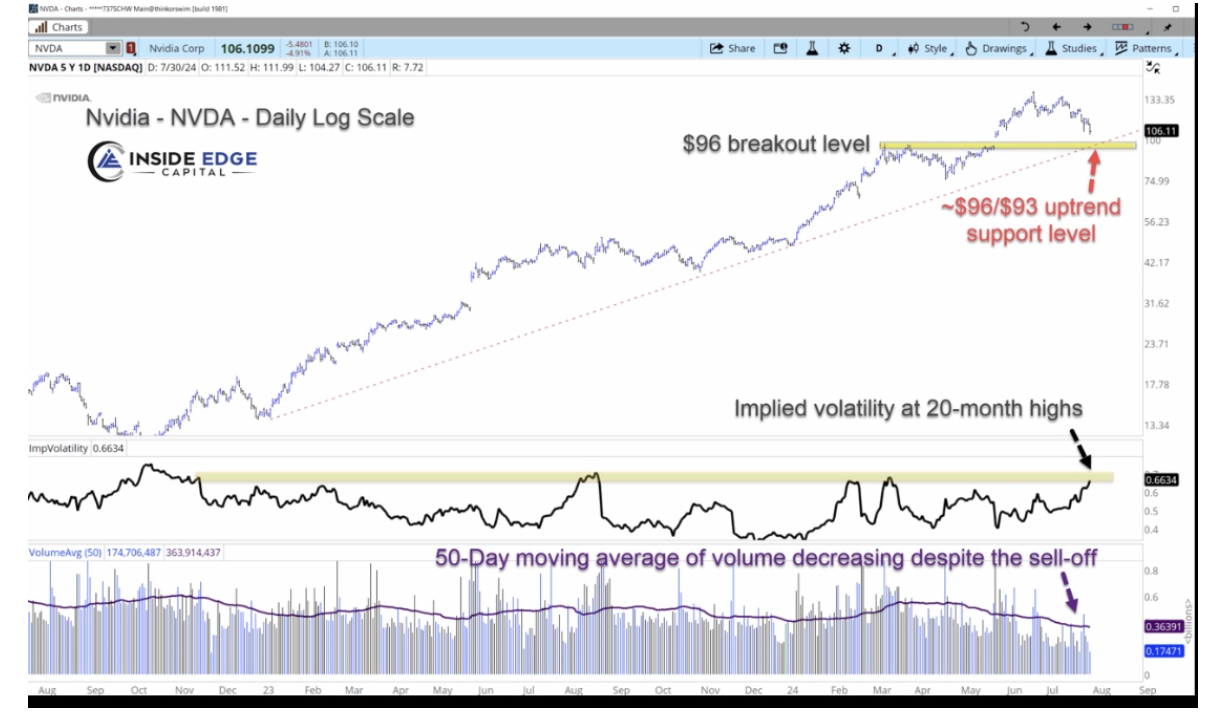
The uptrend support line (red-dashed) should intersect the stock price at around $96-$93 depending on the continued rate of share price decline.  $96 is also this year’s break-out level, and it should now offer support.

Let’s not forget volume.  This identifies the seller’s conviction in this sell-off.  The 50-day MA of the daily volume totals is clearly in a decline since April.  In other words, the urgency of selling is waning.

Based on the fundamental outlook of continued strong earnings growth and the technical outlook, the stock should not get too far below the mid-$90s before the low is found.


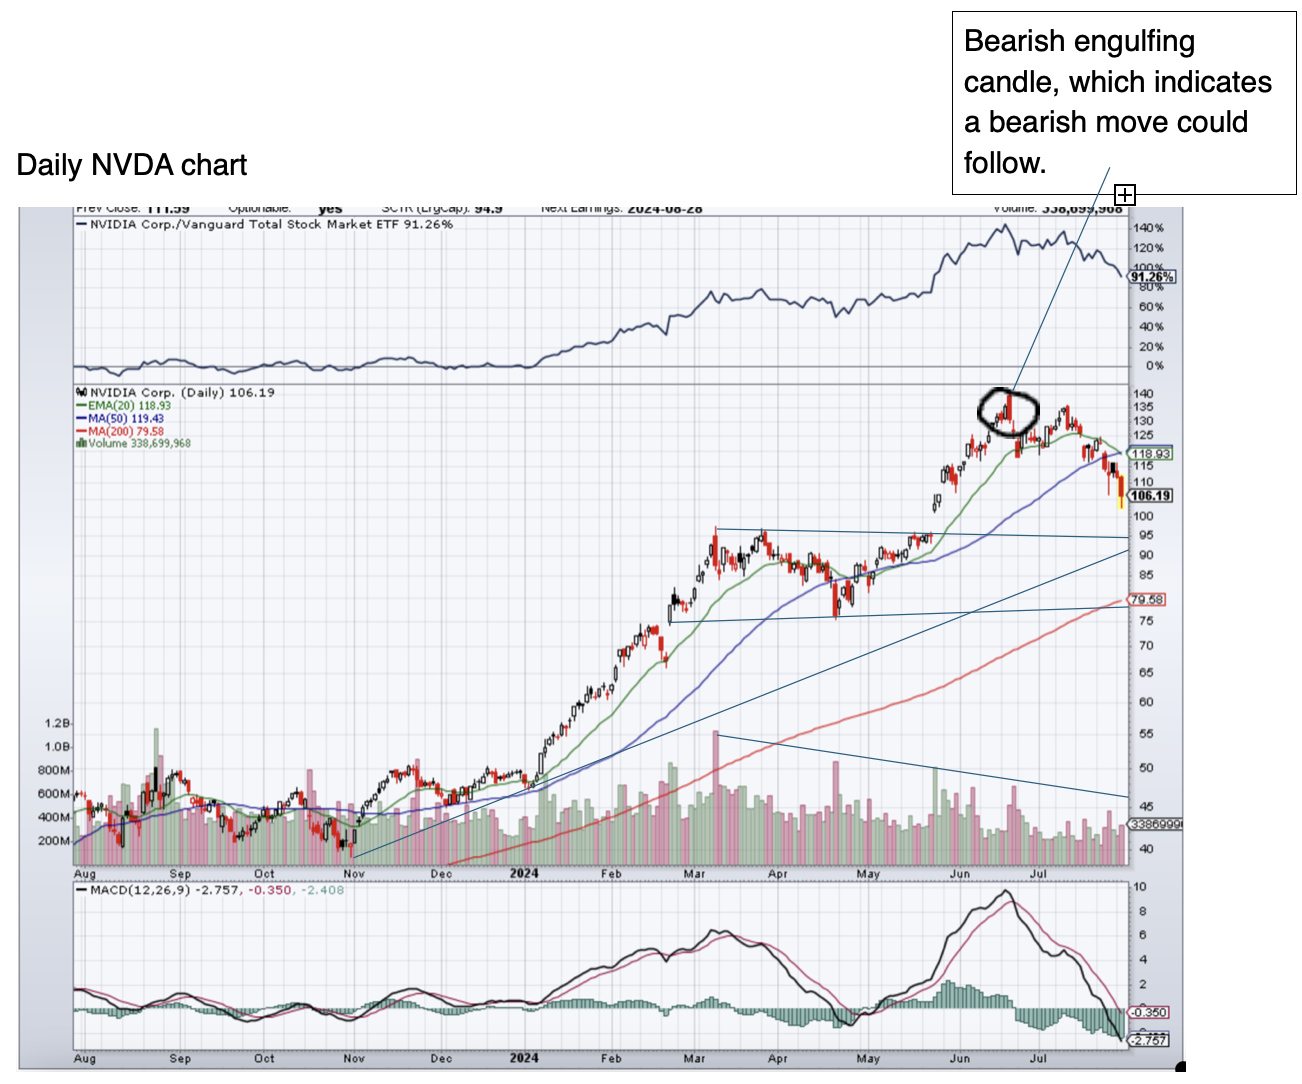
On this chart, I have drawn support and trend lines, showing where the stock price may find lows.  I have also drawn the trend line showing declining volume since March 2024.
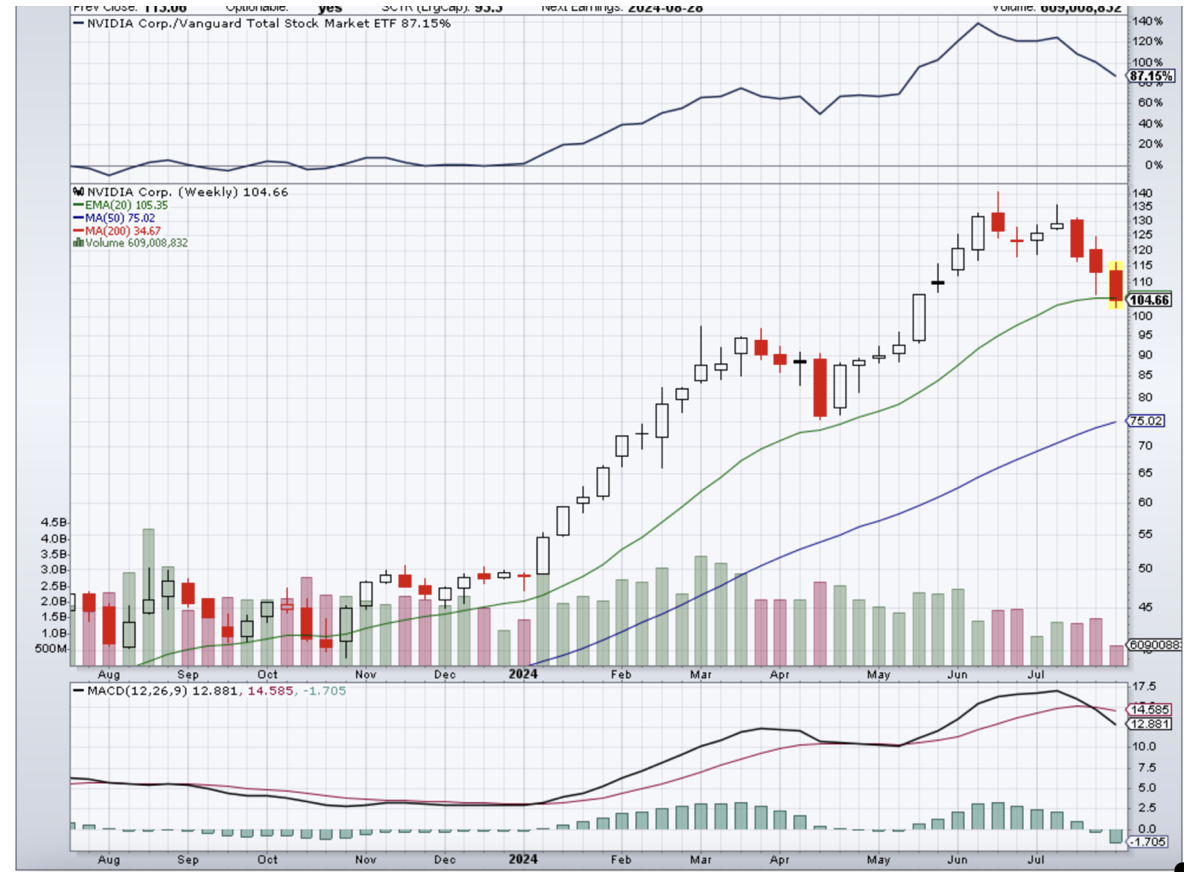
 

Weekly NVDA chart


Cheers,

Jacquie

Share this entry
  • Share on Facebook
  • Share on X
  • Share on WhatsApp
  • Share on Pinterest
  • Share on LinkedIn
  • Share by Mail
https://madhedgefundtrader.com/wp-content/uploads/2019/05/cropped-mad-hedge-logo-transparent-192x192_f9578834168ba24df3eb53916a12c882.png 0 0 april@madhedgefundtrader.com https://madhedgefundtrader.com/wp-content/uploads/2019/05/cropped-mad-hedge-logo-transparent-192x192_f9578834168ba24df3eb53916a12c882.png april@madhedgefundtrader.com2024-07-31 12:00:562024-07-31 14:06:13July 31, 2024

tastytrade, Inc. (“tastytrade”) has entered into a Marketing Agreement with Mad Hedge Fund Trader (“Marketing Agent”) whereby tastytrade pays compensation to Marketing Agent to recommend tastytrade’s brokerage services. The existence of this Marketing Agreement should not be deemed as an endorsement or recommendation of Marketing Agent by tastytrade and/or any of its affiliated companies. Neither tastytrade nor any of its affiliated companies is responsible for the privacy practices of Marketing Agent or this website. tastytrade does not warrant the accuracy or content of the products or services offered by Marketing Agent or this website. Marketing Agent is independent and is not an affiliate of tastytrade. 

Legal Disclaimer

There is a very high degree of risk involved in trading. Past results are not indicative of future returns. MadHedgeFundTrader.com and all individuals affiliated with this site assume no responsibilities for your trading and investment results. The indicators, strategies, columns, articles and all other features are for educational purposes only and should not be construed as investment advice. Information for futures trading observations are obtained from sources believed to be reliable, but we do not warrant its completeness or accuracy, or warrant any results from the use of the information. Your use of the trading observations is entirely at your own risk and it is your sole responsibility to evaluate the accuracy, completeness and usefulness of the information. You must assess the risk of any trade with your broker and make your own independent decisions regarding any securities mentioned herein. Affiliates of MadHedgeFundTrader.com may have a position or effect transactions in the securities described herein (or options thereon) and/or otherwise employ trading strategies that may be consistent or inconsistent with the provided strategies.

Copyright © 2025. Mad Hedge Fund Trader. All Rights Reserved. support@madhedgefundtrader.com
  • Privacy Policy
  • Disclaimer
  • FAQ
Link to: Trade Alert - (NVDA) July 31, 2024 - TAKE PROFITS - SELL Link to: Trade Alert - (NVDA) July 31, 2024 - TAKE PROFITS - SELL Trade Alert - (NVDA) July 31, 2024 - TAKE PROFITS - SELL Link to: Consolidation Time Link to: Consolidation Time Consolidation Time
Scroll to top