April 7, 2014 - MDT Pro Tips A.M.
While the Diary of a Mad Hedge Fund Trader focuses on investment over a one week to six-month time frame, Mad Day Trader, provided by Jim Parker, will exploit money-making opportunities over a brief ten minute to three day window. It is ideally suited for day traders, but can also be used by long-term investors to improve market timing for entry and exit points.
Current Positions
No Current Holdings
Orders are "stop on close" unless stated otherwise
.......................................................................................
Today's Working Orders
No working?orders
.......................................................................................
Stocks...
VIX...14.40-50 is first resistance and the 200 day mvg avg.
15.50 is an exit zone for the bulk of any long volatility positions.
13.35 is today's support # that has to hold and line up with any rally in the Equity Indices.
15.50 is the level Long Equity investors will look to pick up names on a break.
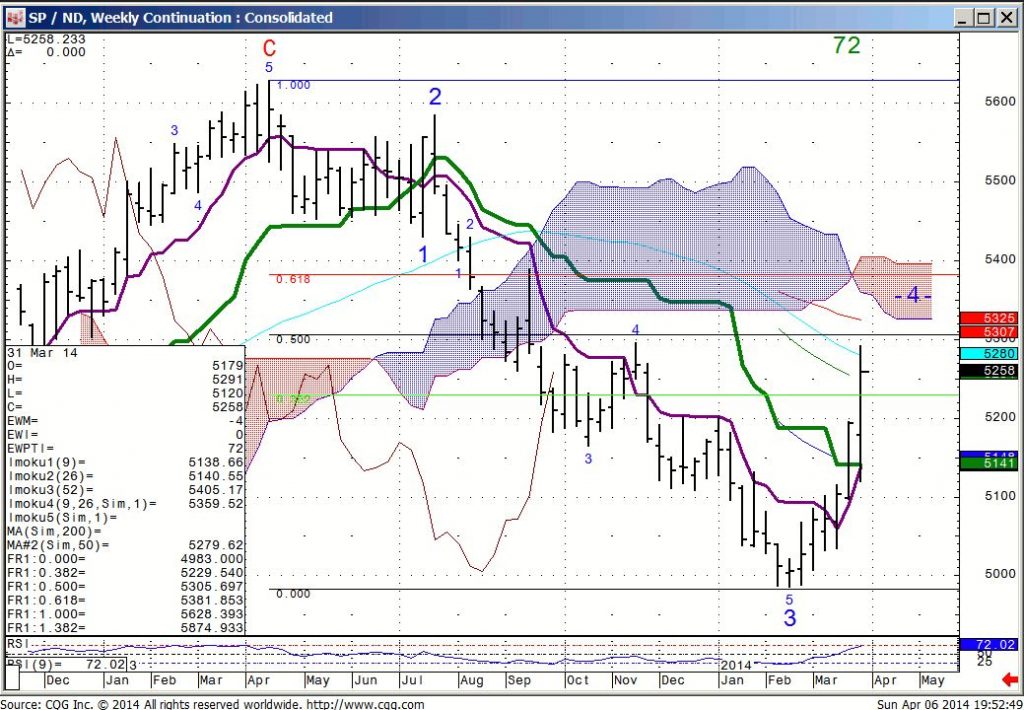
SPU/NASD...as seen in today's chart the spread has come almost 50% back from the 2013 high, matching the November high just before Thanksgiving.
This simply tells you that the fast part of the trade is over. The next leg will require some back an forth (consolidation).
Nasd 100...caution back higher on the week for this will surely test the shorts. 3577 is the first retrace resistance followed by 3600 +- 5
PCLN...both 1129 or 1085 could produce a good bounce.
GOOGL...the old chart (prior split) showed 1180 as a tgt level.
That equates to 540-535. Today's 200 day mvg avg is 509.
If hit, this will be an oversold situation today that can generate a pretty good rally. This is a very low percentage place to be pressing shorts.
NFLX... is short-term oversold, 333 is the 200 day mvg avg. There are resting sell stops @ 319. Any thing into 312 could precipitate some short covering.
IBB...the resting sell stops are @ 222 with 218 being today's 200 day mvg avg.
BRKA...put in an ORL day. Price action over 18,600 will violate the pattern.
?
Bonds...
30 Yr. ... 133.07 is the qtrly close. Upside momentum builds with a close over 133.20.
TYM...the 30 Yr. is the easier trade, however I'm still of the opinion that we see a move to 124.20's before the Equity Indices find a bottom.
FX...
Euro...by remaining under 137.40 it remains vulnerable.
Closing below 136.70 should lead to another leg down in Euro.
136.30 is the next bounce level, however this looks set to take a trip into the 135's.
EUR/AUD...is getting oversold on the shorter time frames. 148.15 is resistance @ the 200 day mvg avg. Only price action over 149 and a close over 149.50 should deter you from selling rallies.
GBP/JPY... lost it's bid tone below 172 with the Risk off board.
It's been hanging around 171 for a couple of weeks.
Closes below 170.30 would have me looking for more weakness in the cross mirroring Equity weakness.
USD/CAD...by holding 110.30 ish (app 90.50 Futures) this stays on a buy the break list. New Dollar weakness through 109.40 ( over 91.20 Futures) is needed for a move to 107.75 ( app 92.80 ish futures)
Commodities...
Crude (WTI)... Failed to follow through to the upside Friday by failing at our upper parameter of 101.70. 100.50 is today's 200 day.
The point & Figure chart shows that by failing to hold the 200 day, Oil can swing back to 99.40 ish.
General Comments orValuable Insight
I've sent the Spu/Nasd chart out again with the technical s in some of the big cap names.
Once this spread went through the 200 day Friday the Nasd fell out of bed. Today the picture is somewhat different in that we'll be opening at technical levels which could see the profit taking switch into the broader market and away from the Nasd.
Keep your eye on Berkshire.
Many individual names will be into short-term oversold levels on the opening.
Recently, every day has been an opening range trade with direction confirmed within the first 30 minutes of NYSE trading for the day.
Use the Vix levels for it will help you see when the Indices get to levels where momentum can abate.
Opening Range Time Frame Trading again today.
?
Short Term View...
Keep trading to make money. The opportunity will be in individual names.
Individual stocks look to be an easier read based off their own technical s.?
We are Neutral Equities.


For Medium Term Outlook click here.
For Glossary of terms and abbreviations click here.