August 1, 2017 - MDT Pro Tips A.M.
While the Diary of a Mad Hedge Fund Trader focuses on investment over a one week to six-month time frame, Mad Day Trader, provided by Bill Davis, will exploit money-making opportunities over a brief ten minute to three day window. It is ideally suited for day traders, but can also be used by long-term investors to improve market timing for entry and exit points.
CURRENT POSITIONS:
GOGO Long at $19.93
Total Premium Collected $1.95
ASNA Long at $14.20
Total Premium Collected $0.75
DUST Long $4.50
Total Premium Collected $0.70
DYN Long at $12.55
Premium Collected $0.48
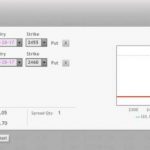
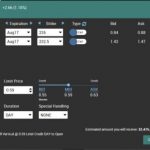
APA Long Oct $47.50 Call at $3.45
APA Short Oct $52.50 Call at $1.10
..........................................................................................
Yesterday closed out the month of July. And every major market closed out the month to the upside.
For the month, the S & P 500 closed out 46.89 points to the upside, up 1.93%. The close was 2,470.30. I mentioned the midpoint of the monthly price bar yesterday. The midpoint before the open yesterday was 2,446.
I mentioned that price because the S & P 500 would have had to close under that level for a bearish monthly price bar to form. As it turned out, that did not happen and the market formed another bullish price bar.
The key here again is that the S & P 500 is above the upper band on its monthly chart. The upper band now reads 2,384.61. So, the S & P 500 closed out July 85.70 points above the upper band.
This one indicator alone demonstrates the unusual strength in the market.
In fact, both the DOW and the NASD Composite closed above the upper band on their respective monthly charts.
We will review these levels on tomorrow's webinar. And speaking of the webinar, if you do have any questions or charts you would like me to review, please send me an email at davismdt@gmail.com and I will try and cover them in the webinar.
For the day, the S & P 500 closed to the downside 1.80 points, at 2,470.30. This just under the 2,472 support area from last week's weekly price bar.
However, pre open, the S & P 500 should open above this level. Assuming the S & P 500 opens above 2,472, look for this level to offer support on a retest.
After the close today, Apple reports earnings. And tomorrow we will hear form TSLA.
Continue to follow the resistance levels.
Here are the Key Levels for the Markets:
$VIX:
Minor level: 16.41
Major level: 15.63
Minor level: 14.84
Minor level: 13.28
Major level: 12.50
Minor level: 11.72
Minor level: 10.16 **
Major level: 9.38 <
Minor level: 8.60 **
Minor level: 7.03
Major level: 6.25
The high yesterday was 10.84, just 10 cents under the minor 10.94 resistance level.
10.16 is a minor support level. If the VIX breaks under 10.16, I would expect a move back to 9.38.
Short term charts remain bearish.
$SPX:
Major level: 2,500.00
Minor level: 2,484.38
Minor level: 2,453.12 <
Major level: 2,437.50 **
Minor level: 2,421.88
Minor level: 2,390.62
Major level: 2,375.00
Minor level: 2,359.38
Minor level: 2,328.12
Major level: 2,312.50
Yesterday's low was 2,468.53, just 27 cents under the minor 2,468.80 short term support level. The high for the day was 2,477.96, just above the 2,476.60 minor resistance level.
Watch to see if the S & P 500 can clear 2,484.38. If it does, it should pave the way for a move up to 2,500.
Buying against support is still the best strategy.
QQQ:
Major level: 150.00
Minor level: 148.44
Minor level: 145.31 ***
Major level: 143.75 <
Minor level: 142.18
Minor level: 139.06
Major level: 137.50
Minor level: 135.94
Minor level: 132.81
The QQQ closed at 143.23. I would expect a move back above 143.36 today. A close under 143.36 would indicate a move down to 142.
And 142.58 is minor support.
IWM:
Major level: 146.88
Minor level: 146.09
Minor level: 144.53
Major level: 143.75 **
Minor level: 142.97
Minor level: 141.41 ***
Major level: 140.63 <
Minor level: 139.85
Minor level: 138.28
Major level: 137.50
The IWM closed again just above the minor 141.41 level. This level should offer support. Look for the IWM to recoup 142.19. If ti can, it should offer support.
Short term momentum remains bullish.
TLT:
Major level: 126.56
Minor level: 126.17
Minor level: 125.39
Major level: 125.00 <<
Minor level: 124.61 **
Minor level: 123.83
Major level: 123.44
Minor level: 123.03
The TLT should test 125, but there is strong resistance at 124.22.
123.44 should be support. Short term charts remain bearish.
GLD:
Major level: 125.00
Minor level: 124.22
Minor level: 122.66
Major level: 121.88 <<
Minor level: 120.32
Minor level: 119.53
Major level: 118.75
Minor level: 117.97
121.88 should still be the objective. 120.31 should be minor support. And 121.09 should be minor resistance.
XLE:
Minor level: 69.53
Major level: 68.75 <
Minor level: 67.97
Minor level: 66.41 **
Major level: 65.63 <<
Minor level: 64.85
Minor level: 63.28
Major level: 62.50
Minor level: 61.72
The objective should be to 68.75. For me to be convinced that this downtrend is over, the XLE would have to run to 72 on this drive.
66.02 should be minor support and 67.19 is minor resistance.
FXY:
Minor level: 87.89
Major level: 87.50
Minor level: 87.11
Minor level: 86.33 **
Major level: 85.94 <
Minor level: 85.55
Minor level: 84.77
Major level: 84.38
Minor level: 83.60
Minor level: 83.20
Major level: 82.81
The FXY continues its countertrend bounce, coming within 25 cents of the 87.50 objective. Watch to see if the FXY can clear this level.
86.91 is minor support. 87.89 is minor resistance.
AAPL:
Major levels for Apple are 153.13, 150, 146.88 143.75, and 140.63.
A good buy on Apple would be down around th 146 to 146.50 area.
Apple does report after the close today, so I would be hesitant to initiate before earnings.
WATCH LIST:
Bullish Stocks: AGN, BA, BIDU, ALGN, FB, RTN, EXPE, BABA, MCD, LEA, ALXN, HON, ADP, CAT, DIS, IAC, SINA, CRM, ELS
Bearish Stocks: IBM, PANW, FFIV, BWLD, JACK, DXCM, QCOM, MD, SON, SIMO
Be sure to check earnings release dates.