Checking Out the Dorsey Wright Technical Model
Bill Good is a friend of mine who runs Bill Good Marketing based in Salt Lake City. His is one of the best firms out there that provides data base support for registered investment advisors and high net worth individuals to operate independently. To see his website, please click here at billgood.com.
We were chewing the fat the other day about the long term consequences of the Great Crash of 2008. He told me a fascinating story. After the market finally bounced, he surveyed 150 of his best customers to see how they fared. Almost all had been devastated, losing half or more of their assets and many of their best customers.
But ten did surprisingly well, either breaking even or earning a small profit. It turns out that nine of the ten were apostles of the Dorsey Wright technical model, which in January, 2008 had banned them from investing in any equities whatsoever. He then got them back into stocks in April, 2009, just after the market bottomed. Intrigued, he pressed on.
Bill dove into the Dorsey Wright model himself and quickly became an acolyte. The message was clear. Buy and hold was dead, and only managers with the ability to hold substantial amounts of cash from time to time had any chance of survival. Bill set up a series of seminars about Dorsey Wright to educate clients about the opportunities. He called them ?No More Pies? to highlight the futility of pursuing modern portfolio theory?s preference for dividing up client cash in fixed asset allocations. The problem was that ?none of the above? was never included as a choice.
My interest piqued, I decided to check out Dorsey Wright myself. I spoke to several of his other followers who waxed euphoric about outperformances the system delivered that saved businesses. I investigated the website at dorseywright.com. I spent an hour with an in house analyst getting into the nitty gritty. I then managed to catch Tom Dorsey himself, the remaining creator of this unique discipline.
In the 1970?s, Tom moved from a posting on the aircraft carrier USS Kearsarge off the coast of Vietnam to a brokerage job at Merrill Lynch, and finally to running an options desk at a medium sized firm. He teamed up with Watson Wright in 1986 to create their technical model.
Tom, who is based in Richmond, Virginia, says his goal was to create a tool box that investors can use to track all asset classes worldwide. His 20 man team uses daily point and figure charts to generate relative strength indicators, market relative strength, and peer relative strength to identify the best and worse stocks in the market. The object is to look at the supply and demand for individual stocks, indexes, and mutual funds. These are distilled down a daily service posted on his website that rates asset classes, which he calls his ?playbook,? as well as buy and watch lists for individual stocks.
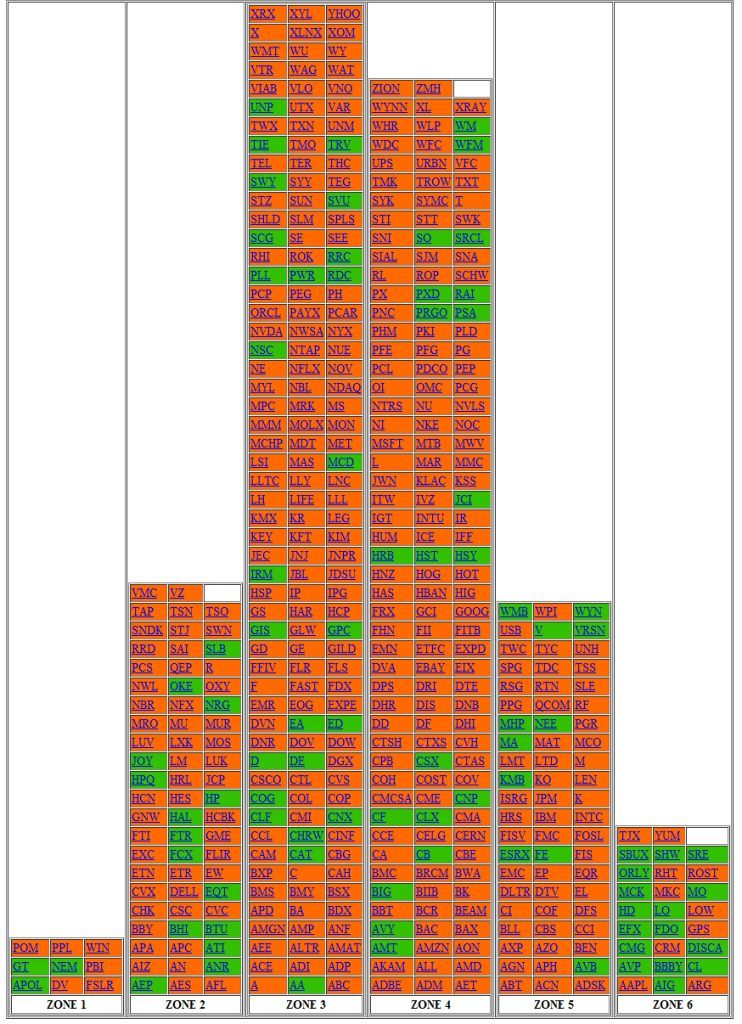
Tom graciously provided me with his snapshot for Monday, April 16 which I have reproduced below. It divides the S&P 500 into six standard deviations defined by columns, three of expensive stocks on the right and three of cheap stocks on the left. So looking at the table, Altria Group (MO), Lowes (LOW), and Colgate Palmolive (CL) are among the dearest in the market, while Pepco (POM), Goodyear Tire & Rubber (GT), and Apollo group (APOL) are a bargain.
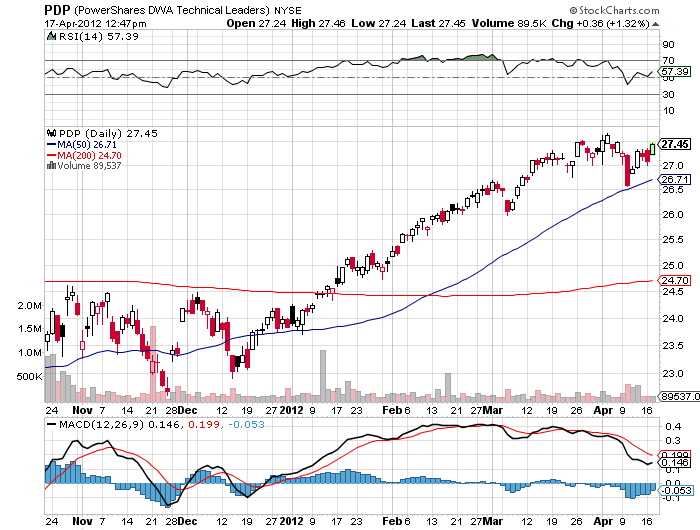
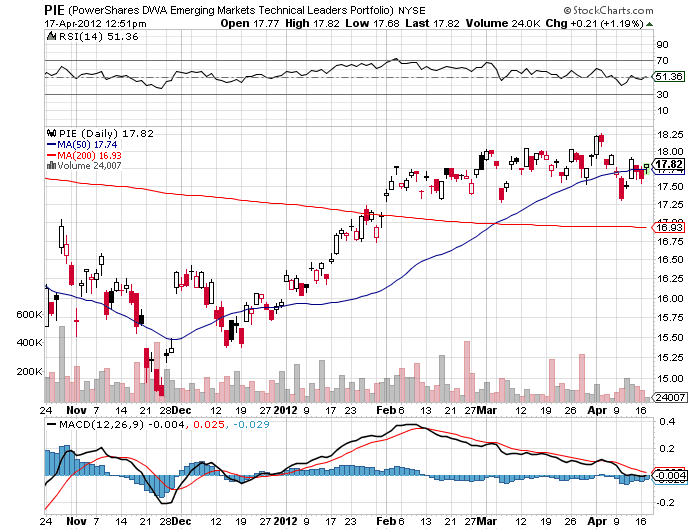
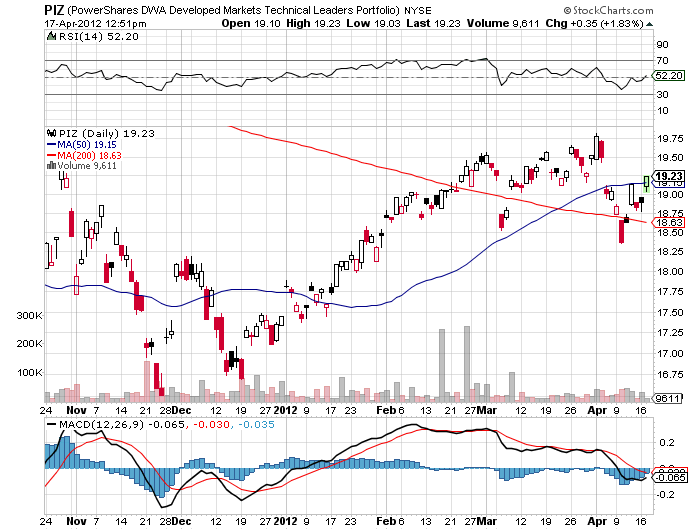
He also offers a family of ETF?s with a combined $2 billion under management that executes on the ideas his system generates. His flagship fund PowerShares DWA Technical Leaders (PDP) is up 5.84% over the past five years, compared to a -6.69% loss for the S&P 500. It was enough of an outperformance to keep many RIA followers in business. He has an emerging markets fund (PIE) and a developed markets fund (PIZ). Tom also constructs custom portfolios for hedge funds and individual clients.
Then Tom really got my attention. Last Thursday, his playbook assigned the US stock market its highest risk rating, which he calls ?Red Zone Defense,? a relatively rare event. As of now, investors should become aggressively defensive, decrease portfolio volatility, raise cash levels, reduce exposure to offensive sectors, tighten stops on longs, sell leaders and laggards on breakdowns, buy protective puts and inverse ETF?s for downside hedges, initiate short positions, and increase non correlated exposure. Calls like this are typically long term. ?Everyone who wants to buy has bought,? he said. I found this intriguing as it came right on the heels of my decision to aggressively ramp up my own short market exposure.
Tom thinks we may have put in a top for this year for stocks. The best that can be said is that stocks may churn for a while around here before a more pronounced move down. If we haven?t, then we could see a secondary wave that generates a marginal new high that will be followed by a much larger collapse, which he calls a ?kiss of death? sell off. My guess is that we will see something like that sometime next year.
So I had to follow up with how he saw other major asset classes. He was definitely negative on Pulte Homes (PHM). Boeing (BA) he thought might undergo some short term weakness before resuming a long term uptrend. Gold (GLD) is fully valued here and could hit a long term trend line at $1,520. He is a bull on oil (USO). Copper (CU) is looking weak for the foreseeable future. The Euro (FXE) is certainly a short here, as is the Japanese yen (FXY). Our only difference was in Treasury bonds (TLT) where he sees the long term bull market continuing, but with 30 year yields (TYX) only making it down from the current 3.15% to 2.82%. This is where you often see the technicals and the fundamentals clash.
Whenever I find a technical system that almost perfectly matches my own fundamental calls, I get extremely interested. Getting a confirmation of your own views using a totally different methodology is as close as a gold standard as you can get in this business. It is what scientists refer to as a ?double blind? experiment. At $450 a month, the Dorsey Wright technical model is no bargain. But you get what you pay for. I will certainly be paying more attention to it in the future.
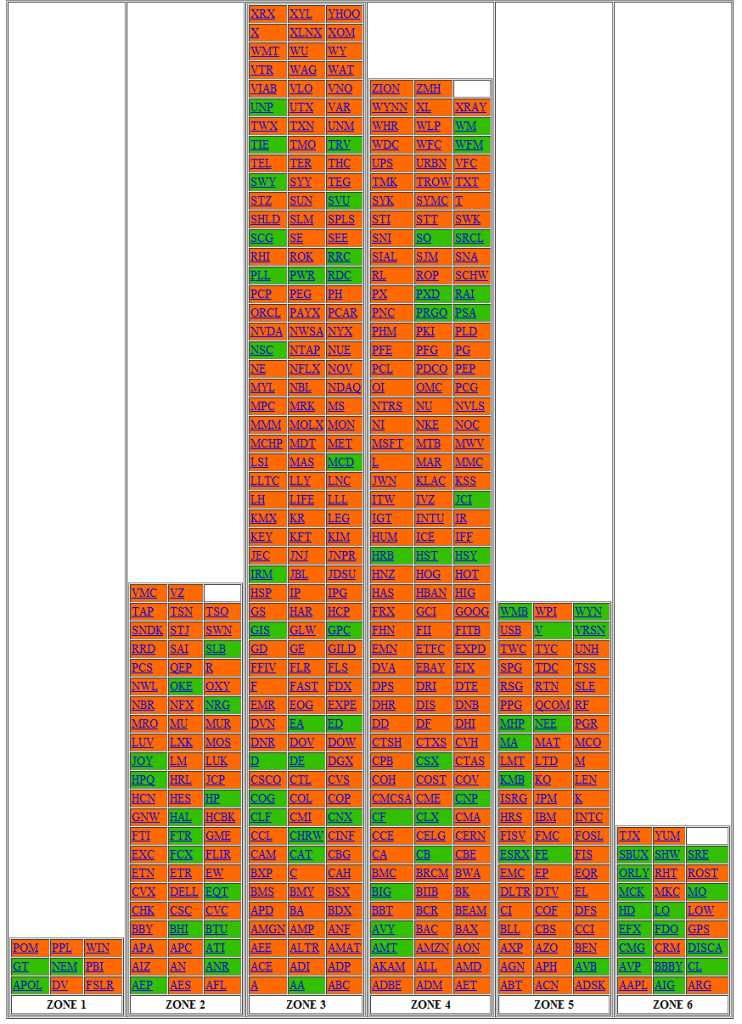
Dorsey Wright S&P 500 Individual Stock Analyses
for April 16