January 27, 2014 - MDT Pro Tips A.M.
While the Diary of a Mad Hedge Fund Trader focuses on investment over a one week to six-month time frame, Mad Day Trader, provided by Jim Parker, will exploit money-making opportunities over a brief ten minute to three day window. It is ideally suited for day traders, but can also be used by long-term investors to improve market timing for entry and exit points.
Current Positions
APPL Long????????????? ? ?? ????? 520.70????????????????????? 520
Orders are "stop on close" unless stated otherwise.
...............................................................................................
Today's Working Orders
No working orders
................................................................................................
Stocks...
Spu's...1800 is the qtrly pivot. Short term traders should be using this level for market tone. This is where you look for market follow through to the upside.
A lot of technicians were eyeballing the low 1770's as support. The Long term stops are under 1760, The FED Taper Low.
Nasd 100...3512 is mvg avg support. Closing below 3485 is needed for another leg down.
MVV...put in an ORL week. Sustained and closing price action over 62 is needed to negate the pattern.
Midcap 400...132370 is the corresponding level.
Nikkei...initially broke too far. A rebound to 15,300 - 15,390 to retest last weeks ORL pattern is possible. Closing over 15,500 is needed to negate the pattern.
XLV...put in an ORL week. Closing over 56.20 is needed for this pattern to be proved false.
VIX...19.40 ish is the next technical level.
?
Bonds...
30 yr...133.15 is the upper end of our resistance area.
Bund...141.64 is support and the monthly ORH #. 143 is resistance. This is another instrument that has come too far.
When markets go Risk Off Equities get liquidated and cash is the by product. Money never sleeps...that cash has to go somewhere.
That somewhere has been the Bonds and Gold.
?
FX...
EURO...137.50 is resistance. closing over 137.85 could lead to more Euro buying.
USD/JPY...103.40 is Yen support (app 96.71 Futures)
?
Commodities...
Gold...1252 is short term support. Asia has identified 1280 as interim resistance.
Gold is a safety trade, Silver has industrial uses and is not.
Gold caught a bid when investors were pulling money out of Equities.
Natgas...is getting overextended in the 5.40's
General Comments orValuable Insight
Equity Indices have come down too far into Early Asian trading.
The Aussie has come too far and is in rebound mode.
This is the same scenario with the Yen which has been mirroring the Equity Indices. Yen rallied too far and is now breaking again as the Equity Indices attempt near term oversold rallies.
The technical models have turned down near term and are in need of repair.
Spu/Bond spread is near term oversold.
Equity indices are setting up to be a buy the break/sell the rally trading affair.
Most instruments are directionally challenged. They've come too far
without some back and fill.
Most instruments ( Equity Indices,MXN Peso) have gone from resistance to support in 3 days. Yen & Bonds did the the polar opposite.
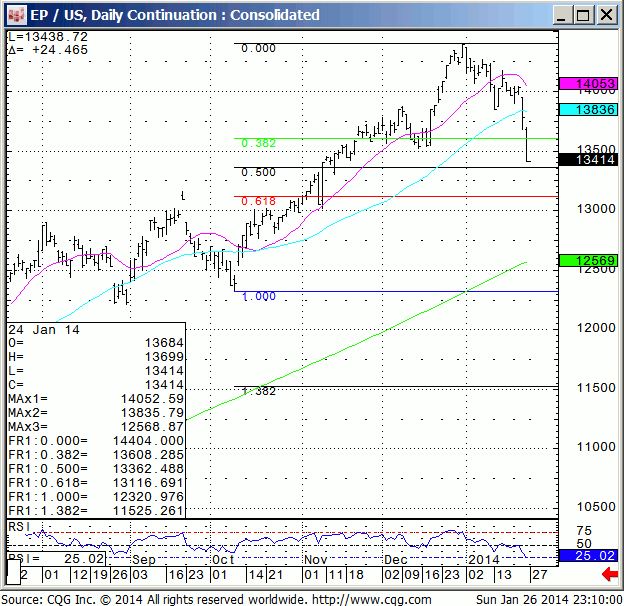
Note that we enclosed a long term Spu chart which shows that this market has the potential for a larger correction.
This is something we'll focus on mid-week after the market has some time to relieve this short term oversold condition
The early trade, should be an opening range trade.
Short Term View...
Keep trading to make money. The opportunity will be in individual names.
Individual stocks look to be an easier read based off thei r own technical s.
We are neutral Equities. The next several weeks are setting up to be a big trading affair.


For new clients: We've enclosed a copy of our qtrly update.
It would behoove you to print it out and keep it at your desk.
Medium Term View... qtrly update Published? 1/2/14
These are static levels that do not change! ?Once generated, they never go away. They become static technical levels.
The outlook is to be used as a tool to keep you from executing trades from the right side of the market at key technical areas.
Stocks...
Spu's... Last qtr we used 1730, this qtr we will be using 1800 as our macro closing pivot. The Spu's have hit our latest tgt area of 1840-50 where we exited half our Long Index position.
Nasd 100...3500 will be this qtr's closing barometer
Midcap...13050 is the closing upside pivot.
DAX...9370 is the closing qtrly pivot.
Euro Stoxx 50...3035 is the closing qtrly pivot.
Closes below 2940 are needed for a sell off
Nikkei...remains bid over 15,500. It weakens under 12,260 close.
Bonds...
30 Yr. Bonds?... 130.20 will be our closing barometer.
Long term, we will continue to favor the short side of the Bonds when market conditions allow.
Our game plan remains to sell the Bonds at these levels, with tight stops, until proven wrong.
The strategy we've been preaching to our high net worth clients for the past two years has been to sell premium in the interest rate futures on big bond market rallies and deliver the Bonds, if called, for the foreseeable future.
We see very little downside in selling premium at strikes a couple of points out of the money at our sell levels in the nearby future, collecting the premium, and delivering the Bonds if called.
We believe we are going into a more normalized Interest rate environment with a reversion to the mean in rates having begun.
The low in interest rates is in.
BUND...140.05 is our qtrly pivot. Sell any rally in the Bunds at this level with tight stop.
139 will act as support and the downside pivot.
FX...
AUD/USD...90.10 will be our qtrly pivot level.
USD/JPY.... 103.25 is this qtr's macro pivot ( App 97.10 Futures).
Euro...137.80 is the qtrly closing pivot. Euro needs closes below 133.50-60 for lower. Closes under 127.50 will lead to a test of the 120 area.
Since July 2012 the Euro has remained bid on the crosses (meaning investors have been buying the Euro Vs. Selling other currencies) primarily vs. the Yen & Emerging markets.
GBP/USD...put in an?ORH 3rd qtr. This is a price positive formation. Our downside support # is 159.40.
The continental currencies are presently showing a topping pattern against the Yen.
We're now of the opinion that you should be selling rallies in the?GBP,Euro & Swiss?Franc?for the first part of the qtr.
Commodities...
Gold & Silver...last qtr. the metals had bouts of selling driven by a shift to high yielding Equities, which we viewed as a side effect of a Risk On board.
Rising treasury yields will continue to cap rallies, as investors will search for safe low volatility high yielding returns.
Bond market rallies will remain highly correlated to metals rallies over the short term.
Lower rates will be price positive the Metals...Follow the Bonds
Gold?needs to maintain above 1220 short term for higher. Sustained price action over 1265-75 can lead to a bigger rally.
1180 is our downside pivot for the qtr.
?Silver... Last qtr we were focused on 20.50 for our pivot. This level will remain pivotal for this qtr as well.
Platinum...we'll revisit Platinum on a close over 1520.
Copper...343-6 will be the upside closing pivot, pretty much the same spot as the past couple of qtr's. 2.95 will act as the downside pivot for another sell off.
Oil....last qtr 89.30 was our pivot. On a macro basis, there is no upside until we close over 104.70-105.30.
Our short term pivot for 1st qtr 2014 is 93.30.
Natgas...?The Infrastructure names will continue to be our preferred way to play the Natty.
For the average investor the names provide more liquidity and a user-friendly venue for capturing Alpha.
Grains...Our long-term strategy has been to buy 8-10% breaks in the ETF's & ETN's.
Grain Longs are on hold for a while.
Soybeans?are caught between 12.40-14.45.
General Outlook...
Equities...After reaching our upside price tgt of 1840-50 Spu's, we remain in buy the big break mode in the Equity Indices @ our technical levels with tight stops.
Do your homework on companies that hold an interest for you.
We still hold the view that specific names will be a better trade than the Equity Indices.
A prepared investor should have their sector-shopping list ready when markets swoon.
As previously stated , ?we're long term Bearish Bonds, and we will maintain a sell the big rally bias for the foreseeable future.
Precious metals...we are on the alert for a trad able low later in the Qtr. Until then it's a range trade at the key technical levels.
OIL...sell the big rallies until proven wrong.
Currencies...We're going to treat the Currencies as a technical trade.
Trade the technical levels with tight stops to see if it develops into a bigger trade.
We don't wish to base the entire outlook on 12 hours of price action. It's difficult to tell if we're just seeing profit taking in the Continental Currencies against Yen from a massively overbought condition or if this is the end of a mutli-year move in the Yen crosses.
Since July 2012 we have been friendly to the Continental Currencies?vs the Dollar based off the Yen crosses.
This bias has the potential to change. We are now adding the Continental Currencies to the sell rallies list only @ our levels where we can manage the risk.
Euro,GBP, and Swiss Franc have been a buy on dips vs Short Yen since 2012.
Use the crosses for the tools that they are.?They are not only great trading venues, but they also tell you which currencies lead.
For the past couple of years it has been the Yen & Emerging market currencies that have lead Dollar strength. The European currencies might very well join the party in 2014.
Trade where you can manage your risk. Use this as the template to do just that. Trade from a side at a specific area with a tight stop.
The Fundamental story follows the technical s.
Being a pragmatic technician, using the correct levels to manage risk, allows the prudent investor to be right market direction with limited downside.
We'll update our outlook and tgt's as market action dictate.
For Glossary of terms and abbreviations click here.