
(CONSUMER BEHAVIOUR AMID RECESSIONS: WHERE DOES THE MONEY GO?)
December 24, 2025
Hello everyone.
Which would you be most likely to give up if a recession descended upon us?
- Netflix
- Fast food, including Chipotle, McDonald's, Burger King, Taco Bell, In-N-Out Burger, Baskin-Robbins, etc
- Your favourite coffee fix
- None of the above
If it were me, and I had to choose one, apart from d), it would be fast food. But then, that would be easy for me, because I don’t eat it in the first place. So, I’m cheating a little in that sense. So, my second pick would be my coffee fix. Again, easy, as I am a tea drinker and prefer to make a pot of tea in the morning or (grab a teabag if I’m in a hurry).
If we are not going to eat out and are not getting our coffee fixes, then where would our discretionary dollars be going?
Many will find comfort in media options. And Netflix comes to mind here.
How many people have not spent a lazy day binge-watching their favourite series or re-watching old movies?
Netflix may turn out to be a stalwart stock against a backdrop of recessionary dark clouds building up on the horizon. Analysts at J.P. Morgan believe the service provides good value, even with their latest price increases. Capex is expected to come in around $17billion this year, and JPM has an overweight rating on the stock. Their price target of $750 indicates around 18.5% upside potential from Monday’s close. From the beginning of this year, the stock is almost 32% higher.
Following its second-quarter earnings announcement on July 18, Netflix shares are trading only around 2% lower, compared with the S&P 500, which is down around 4% over the same period. Of note, in the second quarter, Netflix reported a 34% yearly increase in its ad-supported memberships, and total memberships topped analysts’ forecasts. JPM analysts regard subscription services like NFLX and SPOT as “being more resilient during periods of macro pressure.”
Netflix is positioned well as it targets 500 M+ + global (connected TV) households.
Spotify has also been a strong performer this year, with shares up 80% year to date.
Netflix (NFLX) Daily chart
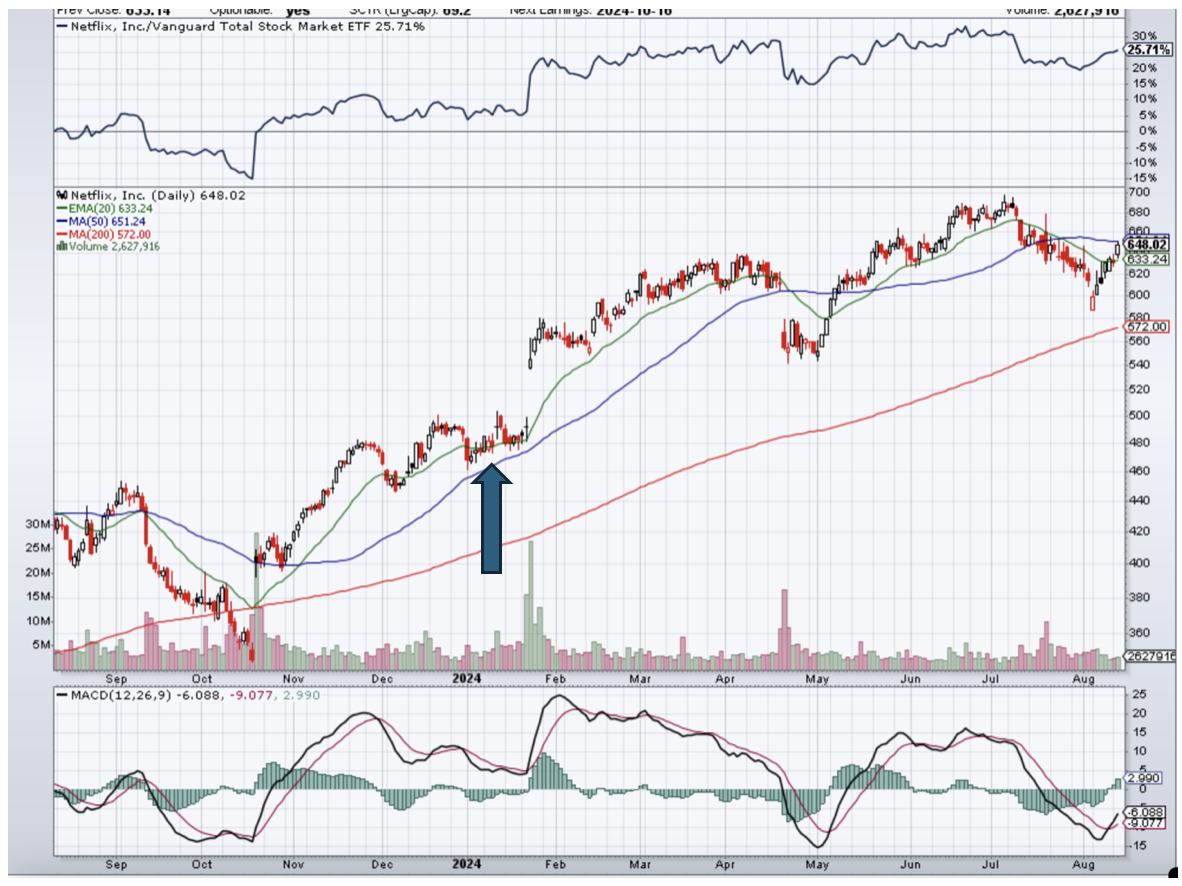
I recommended Netflix (NFLX) on January 17, 2024, when it was $480.
Spotify (SPOT) Daily chart
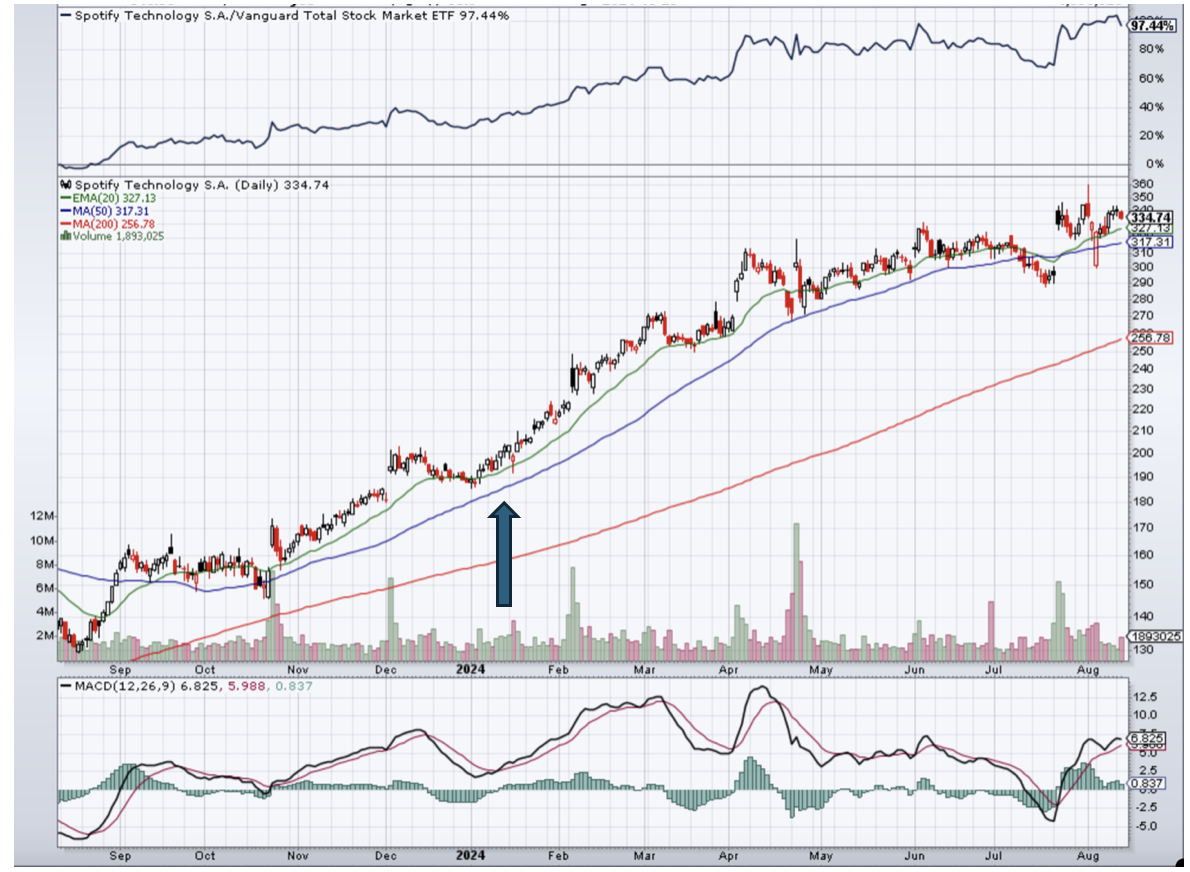
I recommended Spotify (SPOT) on January 7, 2024, when it was $193.52
I am not suggesting you buy at this time or add weight.
SOMETHING TO THINK ABOUT…
In a recent talk, the Private Wealth Group of Wells Fargo Advisors offered comments on investing. Here are a few takeaways.
“What we can learn from history is that people don’t learn from history.”
“All this creates a lot of short-term thinking in the markets. They become focused on what is in the news, and money drives them toward these companies and industries. It’s during this time that investment principles are forgotten.”
Their thoughts on the media are interesting. (In the 1980’s, I don’t recall any financial media channels. CNBC was founded on April 17, 1989, two years after the 1987 crash. It was originally the Consumer News and Business Channel, a joint venture between NBC and Cablevision.
Getting back to their ideas…
Tuning out the headlines to stay focused on the long term.
“People get caught up in what’s going on in the news and what the media is talking about. A lot of people are working from home. They have got the TV on. If you watch any of the financial news networks, there’s not that much news every day. They just keep talking about the same thing over and over and over again. And people hear that, and they stick with it, and then it becomes real to them, and all their investing principles and history is gone by the wayside.”
QI CORNER


Cheers
Jacquie
(THE PUBLIC GOLD RUSH)
October 10, 2025
Hello everyone
This is when I start to become wary.
Just this last week, I saw on the television media channels, news items about the vast numbers of Australians investing in ETFs. Additionally, another item showed people lining up outside Bullion companies to buy their nuggets of gold.
When mass public participation becomes evident, it is usually not long until we see some sort of correction/retracement.
It is not a 100% certainty that we will get a correction before year end; nevertheless, I think we should be prepared for the possibility. And it can happen very suddenly. In 1983, the gold price fell 14 per cent overnight. When I see people queueing for gold, alarm bells are going off in my head.

It would be reasonable to expect some profit-taking as the $4000 milestone is hit, so I would not be surprised to see a pull-back from current levels before a resumption higher again.
To rally further, gold needs to move higher above $3,994 to trigger the belief in the bullish view. Then the nearest target is $4,133.
On the other hand, if gold fails to move up and moves lower below $3,944, the bullish view will be rejected.
Australia is no stranger to a gold rush. Many prospectors flocked to the Victorian goldfields in the 1850s. Today, investors are not likely to ditch the office job and take a backpack filled with pickaxes and pans to locate gold. Instead, they are investing in gold equities, ETFs, and direct ownership of the precious metal, which has certainly gathered pace recently.
The metal is also now forecast by the Federal Government to top liquefied natural gas (LNG) as Australia’s most valuable export over the financial year ending June 30, 2026. Its total export value is tipped to reach $60 billion, with iron ore still comfortably ahead on a forecast export value of $113 billion.
A bullish gold price would be beneficial to the local economy, bringing more taxes, royalties, dividends, and wealth for Australians.
According to Emmanuel Datt, the founder and portfolio manager of the Datt Small Companies Fund Capital, the gold rush will encourage more exploration, mergers, acquisitions, and mine development across Australia.
If the price for the metal holds around $US4,000 over the next 12 months, UBS Australia believes gold equities still have more upside. The investment bank notes that future Fed Reserve rate cuts, continued dollar weakness, and persistent geopolitical uncertainty around the US government shutdown and the Russia-Ukraine conflict have all contributed to fuelling this gold rally. With central banks and retail investors buying at a record pace, the gold frenzy is likely to continue.
Goldman Sachs is calling for gold to reach as high as $US4,900 by December 2026.
Despite the bullish views, always be wary of corrections.
Bitcoin & Ethereum
We have seen a correction in Bitcoin and Ethereum; I forewarned you of some short-term volatility in these coins, however, I believe we should rally before year end, provided that significant levels hold.
A move above 123,762 would suggest and build confidence for the view that BTC is rising within an Elliott Wave iii at that time. If that bullish action takes place, the nearest target would be around the 131, 300 area.
Hedge Funds
Despite the record levels in the markets, hedge funds are still exhibiting a level of caution.
JP Morgan strategists suggest that if the market continues its run-up, then these very cautious hedge funds may be forced to capitulate and take out long positions in ‘SPY’ or related futures to cover their cautious positioning.
They may rather chase the market here, adding more fuel to an equities rally, than report underperformance to their investors at year-end.
Then we could basically have a “blow-off” top that would start to take place.

Cheers
Jacquie
(SKEPTICAL INVESTORS MAY SEE THE MARKETS TREND HIGHER)
September 5, 2025
Hello everyone
What’s next for the markets?
More upside ahead?
One hundred days have passed since the S&P500 reached its post “liberation day” closing low.
So, how would you describe the gains since then: incredible, astounding, amazing, eye-watering, irrational, annoying. I could go on, but you get the picture.
The index is up 29% inside that time frame. Since 1950, there have been just four instances in which the S&P500 has seen a larger return over a 100-day rolling period, according to several investment bank analysts.
It is no surprise to anyone to find the tech sector in the lead during this time. Over the past 100 days, the S&P500 tech sector has rallied more than 48% as investors have bought into the AI trade. Communication services and consumer discretionary stocks are also up more than 30% during the same period.
Spurring this recovery along is the expectation of Federal Reserve rate cuts, and some progress – albeit turbulent – on the global trade front.
Challenges are staring at the markets, but thus far, the market has overcome or bypassed every obstacle in its way.
Carson Group’s Ryan Detrick, as well as Tom Lee, from Fundstrat, investment banks, UBS, & Goldman Sachs (GS) and Jeremy Seigal all argue the market can move higher.
Detrick notes that the S&P500 averages 8.1% gain six months after a strong 100-day performance. One year out, that average increase expands to 12.9%.
AMAZON (AMZN)
The stock surged strongly on Thursday – around 3% - making it one of the S&P 500’s best-performing stocks of the day.
Over the past month, the stock has rebounded around 10%. Several catalysts are responsible for this:
# Its relationship with the rapidly growing Anthropic – an artificial intelligence startup backed by the e-commerce giant.
# expansion of its same-day grocery delivery offerings.
# newly minted deal for its satellite internet business.
Barclays sees a deep gold mine in Amazon’s deep-rooted relationship with Anthropic. The start-up trains its flagship generative AI Claude models primarily on Amazon Web Services, using Amazon’s Trainium and Inferentia chips for training and inference, respectively.
Some analysts believe Amazon could see significant upside in the fourth quarter. Anthropic could be pre-training its Claude 5 model by then, which would contribute to AWS growth.
I expect many of you made some good money (or are making good profits, if you are still holding these) on the AMZN options I recommended in early June, when the stock was sitting at $205.71.
AMZN 2015/225 with Oct. 17 expiry
and
AMZN 210/220 with Oct 17 expiry
I was even more aggressive in my personal account and took out a 220/230 option spread trade.
Took profits. On to the next trade.
THE TRAJECTORY OF GOLD
Gold at $4,000/ounce could be a reality by 2026.
Uncertainty and macro events are driving gold prices:
Trump’s actions are threatening Fed independence, and as Goldman analysts note, this could result in higher inflation, lower stock and long-dated bond prices, not to mention an erosion of the U.S. dollar’s status as the global reserve currency.
Gold futures gained 4.9% from Trump’s nomination of Stephen Miran on August 7 to fill a vacancy on the Federal Reserve Board. And the shiny metal gained 5.8% after Trump threatened to fire Fed Governor Lisa Cook on August 22 through to Tuesday.
Trump has made it clear that he wants to consolidate a majority on the Fed board so he can lower interest rates.
MY CORNER
Wallaby with joey in my front yard.
And a lone kookaburra sitting on a fence post.


Cheers
Jacquie

(CHINA AND THE U.S. AGREE TO A TRADE DEAL IN SWITZERLAND)
May 12, 2025
Hello everyone
WEEK AHEAD CALENDAR
MONDAY, MAY 12
8:30 a.m. Australia Consumer Confidence
Previous: -6%
Forecast: 2%
TUESDAY, MAY 13
6:00 a.m. NFIB Small Business survey (April)
8:30 a.m. CPI (April)
WEDNESDAY, MAY 14
9:30 p.m. Australia Unemployment Rate
Previous: 4.1%
Forecast: 4.1%
THURSDAY, MAY 15
8:30 a.m. Initial jobless claims (week ended May 10)
8:30 a.m. Retail sales (April)
8:30 a.m. PPI (April)
8:30 a.m. Empire State mfg index (May)
8:30 a.m. Philadelphia Fed mfg index (May)
9:15 a.m. Industrial production (April)
10:00 a.m. Business inventories (March)
10:00 a.m. NAHB survey (May)
FRIDAY, MAY 16
8:30 a.m. Housing starts (April)
8:30 a.m. Import prices (April)
The U.S. & China meeting in Switzerland: will it deliver?
The news has just come through…
U.S. and China have agreed to slash tariffs for 90 days in a major tariff breakthrough. Reciprocal tariffs will be cut from 125% to 10%. Both the U.S. and China said they will continue discussions on economic and trade policy. What is in doubt is whether the 90-day pause is enough time for the two sides to reach a detailed agreement. But at least we have some movement on negotiation. Dow futures have jumped 1000 points, gold has fallen, and the U.S. dollar has surged.
In other news…
The health of the consumer will be clearly visible this Thursday when we see retail sales data and the producer price index report. We will also see the CPI report which will tell us how the trade conflict has affected inflation.
The S&P 500 has already rallied more than 13% from its April 8 lows, so the market may need a positive surprise on the trade front to take another big jump.
I tend to believe the limited ranges we have been seeing have been in anticipation of some de-escalation out of China, and as such, when the actual news comes out, the market reaction might be rather ho-hum and could even mark a tactical top, regardless of what the news is.
This level in the market could be a good time to re-establish short positions or add to them if you have them already.
They don’t make things like they used to…
White goods, toys, heaters, whatever you can think of – most of these things don’t have a long life.
Some products don’t even outlast the warranty period before they break down and stop working, or need a part replaced, which is not even worth the cost.
Consider the cost of getting someone to your house to replace the part and the cost of the part. It’s often not worth it.
I remember growing up with a Kelvinator refrigerator, which lasted around 30-40 years. Can you imagine anything lasting that long today?
Today, companies make products that are designed to break down, so the consumer must go back and buy another one.
Forty and fifty years ago, we didn’t have the technology we have today, so why, with all the technology we have now, is it so difficult to make quality products?
I’m not saying all products are poorly made, but you must admit that the quality overall is not evident.
It seems companies making money trumps making quality – so disappointing.
MARKET UPDATE
S&P500
The index is up 13% since the April lows at 4835. No confirmation that we have seen a top yet, although upside momentum is slowing and suggests further gains would likely be limited, as the potential of a peak for at least a few weeks/months is rising. So far, we have had a high of S&P 500 5832 in the futures.
Support: 5575/85, 5475/85
Resistance: 5760/85 area/5830
GOLD
Bearish technical data is visible in the gold chart (sell mode on the MACD) & and an overbought pattern. However, we could still see more ranging/consolidation before gold completely rolls over.
Support: $3268/73 & $3197 & $3075
Resistance: $3353 & $3438/43
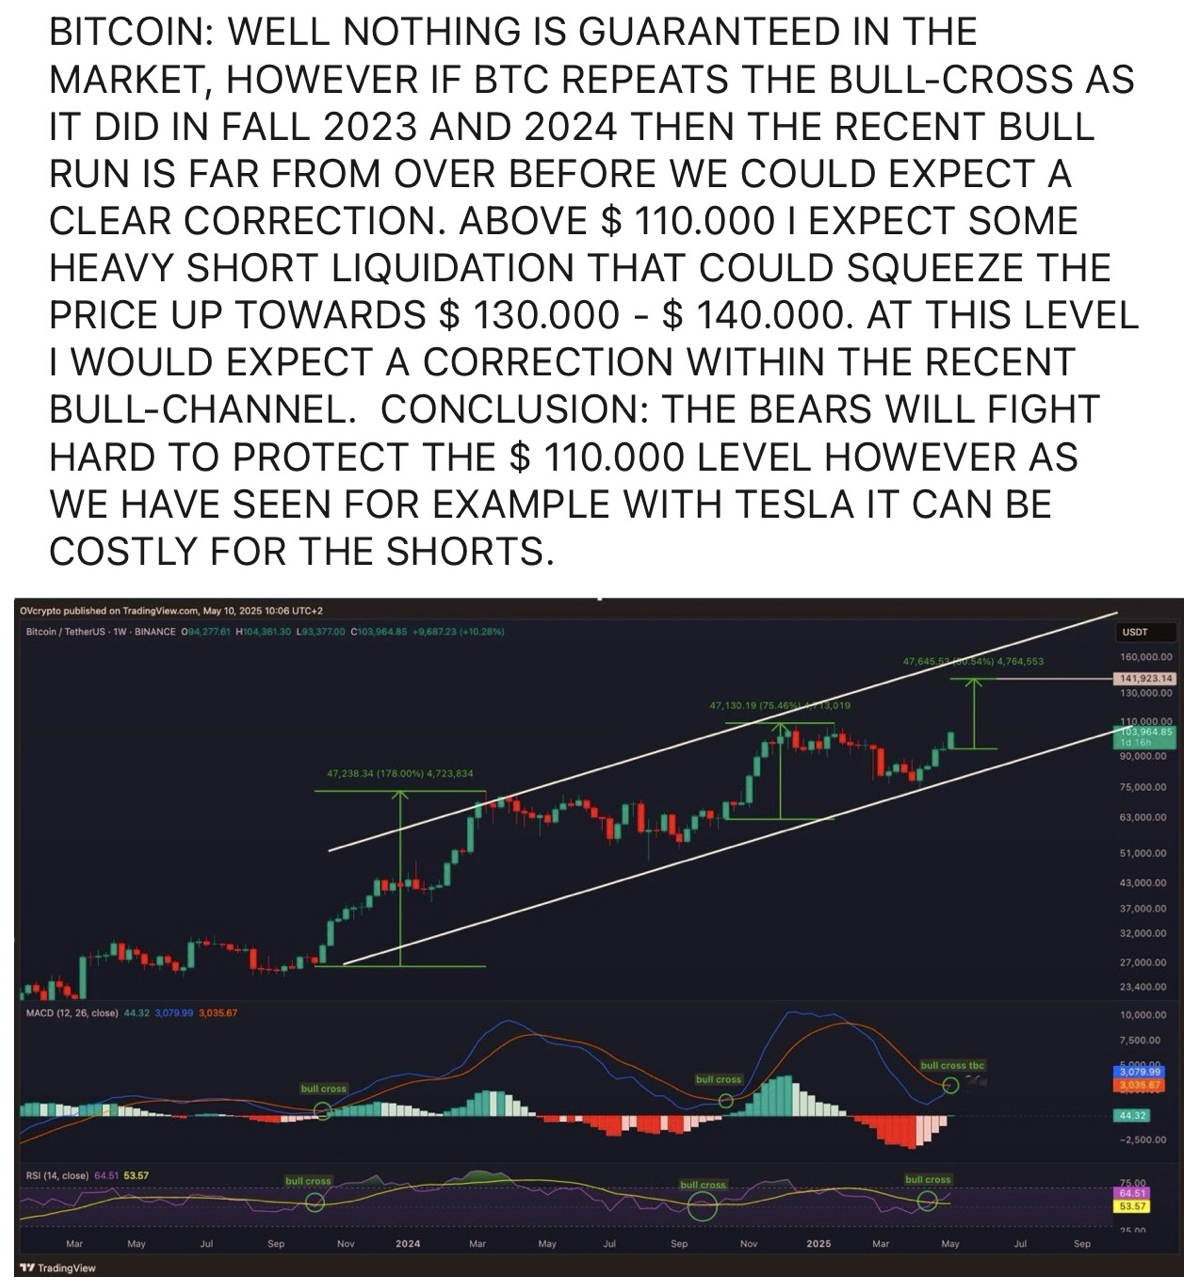
BITCOIN
We’ve seen Bitcoin move sharply higher – the long-term view remains in focus with a target between $125k and $150k. The market is getting overbought with such a sharp move, so some consolidation might be in front of us before further moves to the upside.
Support: $99.90/$100.4k & $96.0/$96.4k
Resistance: $104.4k
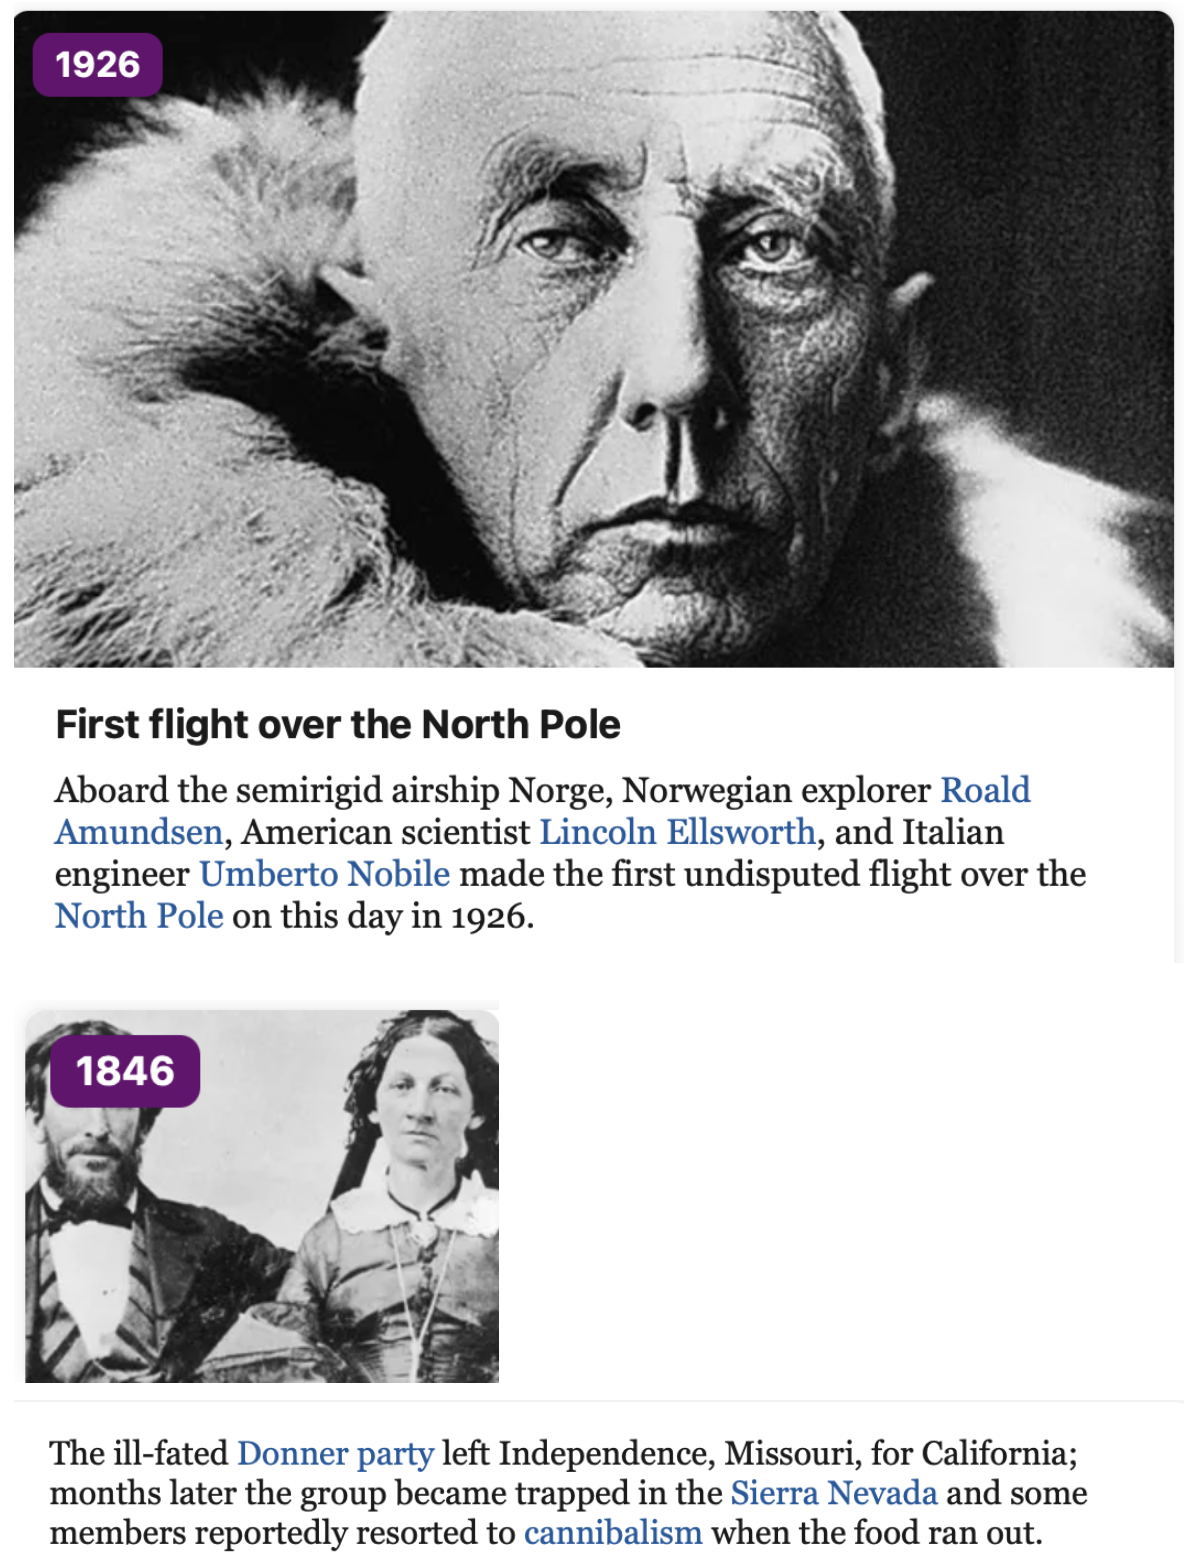
HISTORY CORNER
On May 12


QI CORNER
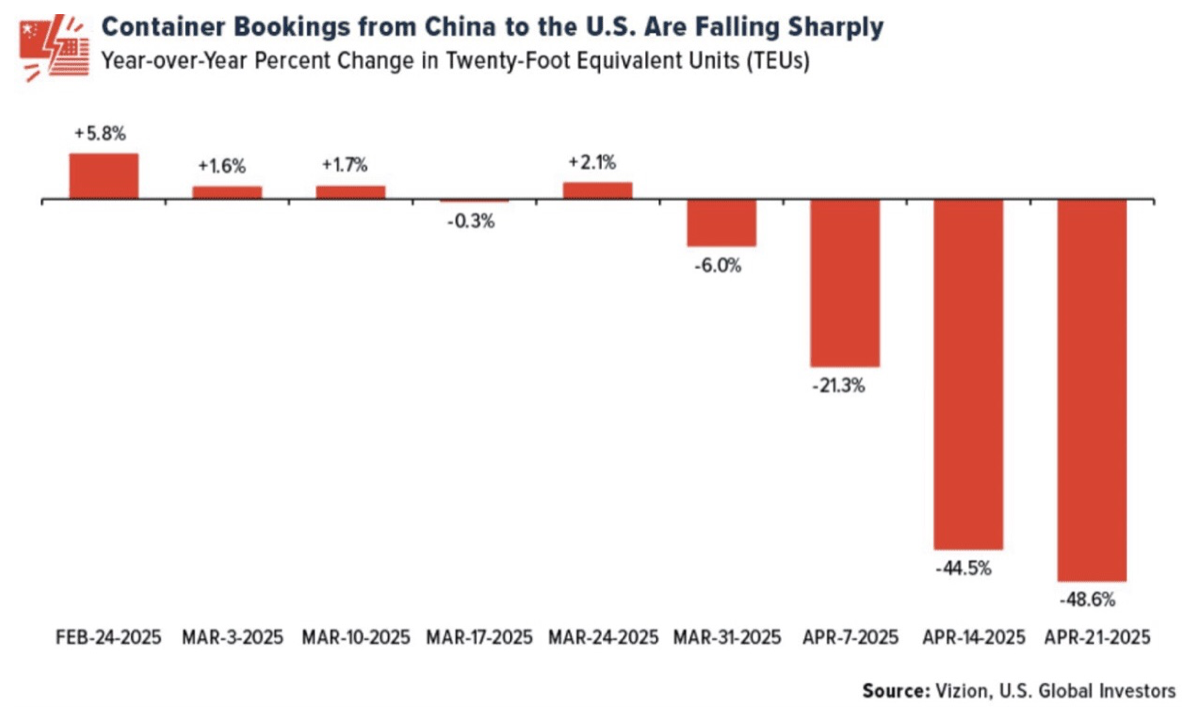
U.S. officials met with Chinese counterparts in Switzerland this past weekend to address the trade war between the world’s two biggest economies. This chart from Spencer Hakimian, founder of Tolou Capital Management, shows why a ratcheting back of rhetoric, at the very least, should be expected.
Ernst Imfeld (Family Office)
SOMETHING TO THINK ABOUT

Cheers
Jacquie
(AMERICAN TRADE POLICY HANDS AUSTRALIAN BEEF A TOP SLOT)
May 9, 2025
Hello everyone
The Fed left rates unchanged, as expected, citing inflation concerns and continued uncertainty across the economic landscape.
Australia scores big thanks to Trump
President Trump has just gifted Australia near monopoly status in China’s almost $5 billion premium beef market.
Chinese officials have effectively blocked American beef from entering the country, leaving Australia with the top of the market almost to itself. America sold $2.4 billion (US$1.6 billion) to China in 2024.
America’s missteps with China have put Australia in a very fortunate position, where they should benefit handsomely.
Beef is Australia’s biggest agricultural export to China, worth more than the wine and lobster trade combined. Australian farmers sold $2.2 billion worth of beef to China in 2024, making it Australia’s second biggest beef market after America (which bought $4.4 billion worth of Australian beef to the chagrin of the Trump administration).
With billions of premium beef sales potentially up for grabs, a herd of Australian beef exporters will fly into Shanghai within a fortnight for SIAL China, an important trade event for the food and beverage industry in the world’s second biggest economy.
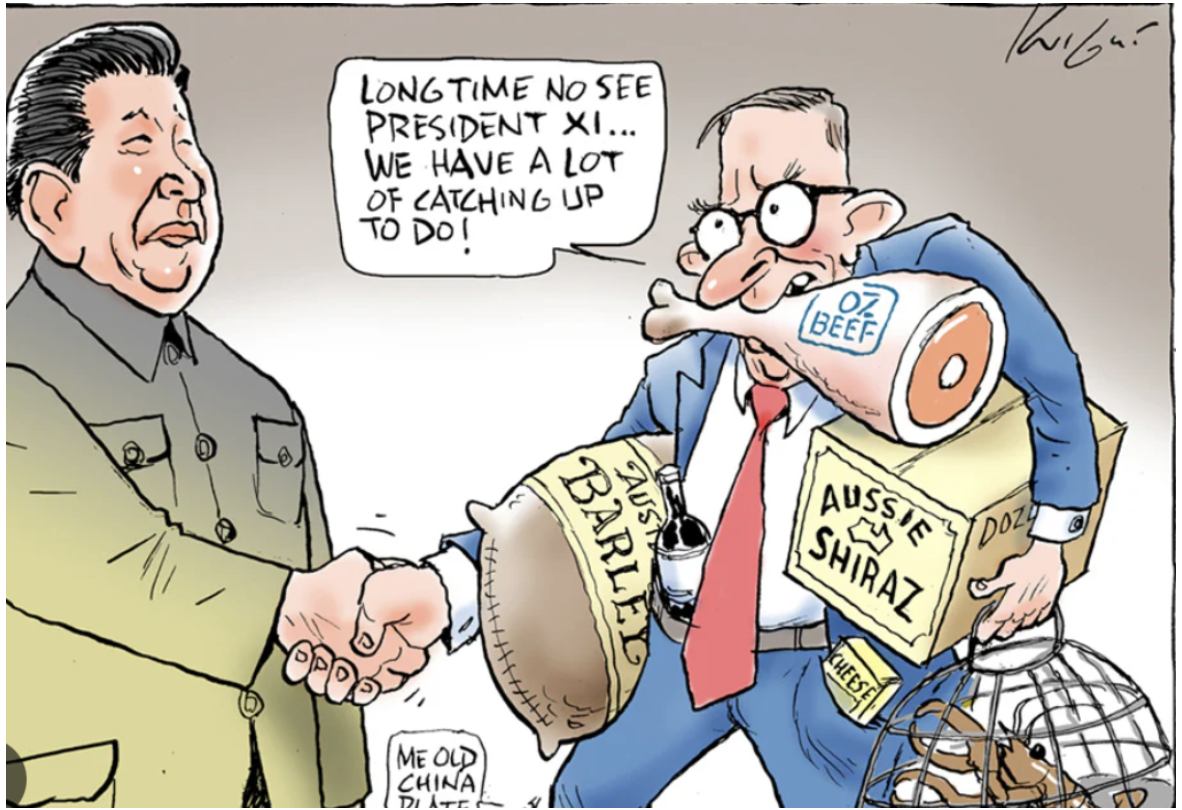
Since securing a second term as Prime Minister of Australia last weekend, Anthony Albanese has been enjoying praise from Beijing, and Chinese media highlighting the prospects of future trade ties between Australia and China.
Australian wine exporters, along with exporters of cotton, timber, wheat, and lobsters, are also experiencing a role reversal, as these former victims of Beijing’s trade restrictions now find themselves benefiting from Chinese trade imposts on America and Canada.
Favourable bilateral politics – and a desire to find non-American supplies – also helped Australian gas giant Woodside recently snare a 15-year-long supply agreement with a Chinese state-owned giant.
Beijing’s first strike on the US herd came in March, as Chinese officials refused to renew trading licenses for American beef companies. Even if it lands at the port, they are turning it away.
In April, Mr Xi responded to Mr Trump’s 145 per cent tariffs on China with a 125 per cent tariff imposed on American imports. Even if American beef could get into China, those tariffs would decimate the trade.
Kevin Wang, A Beijing based sales manager of high-end beef importer Tenderplus, said “People are looking for Australian partners to import beef. Some have already flown to Australia to talk with trade partners.”
Menus have already been reprinted at premium restaurants around China. Even the most patriotically American places are looking increasingly Australian.
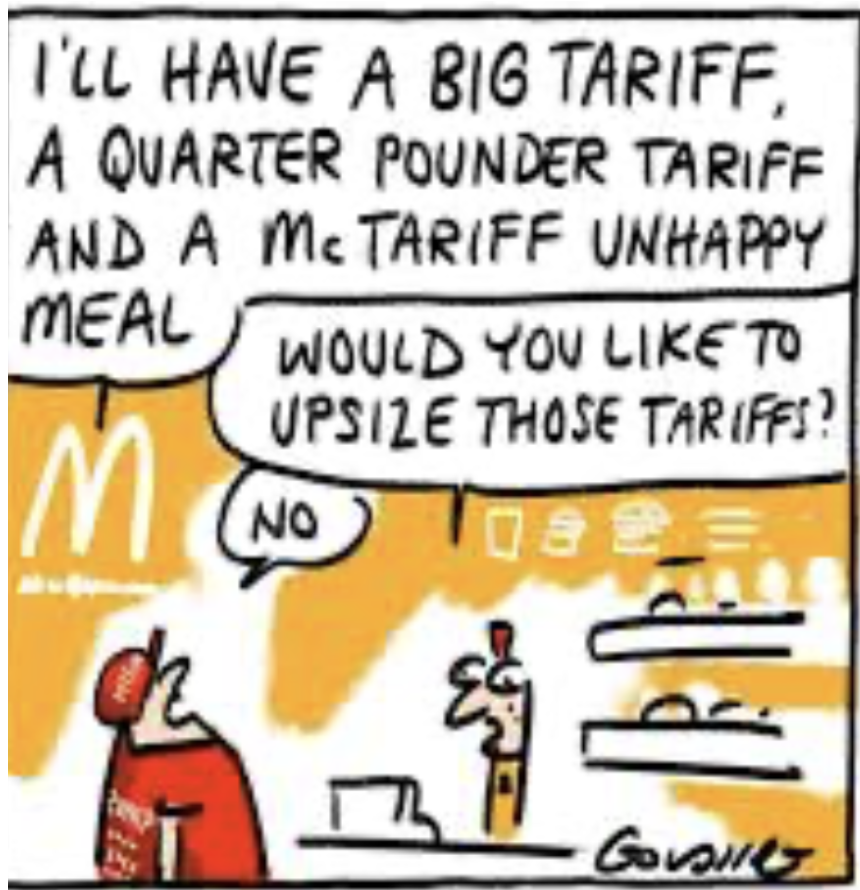
Americans digesting tariffs on Australian beef.
The Shanghai and Beijing branches of New York institution Wolfgang’s Steakhouse are now selling Australian porterhouse, striploin, rib eye, and filet mignon as its supplies of American beef are two weeks away from extinction.
In the centre of Beijing, we find Morton’s, which is owned by Houston billionaire Tilman Fertitta. Here, the restaurant has swapped its house red from an American drop to a Clare Valley Shiraz, a very good match with its Australian porterhouse from Rangers Valley in NSW’s northern tablelands.
China’s biggest sources of beef are Brazil and Argentina, but they sell at the cheaper end of the market.
Restrictions on other high-end sellers in Japan and Canada effectively shut them out of China’s market.
The results of Beijing’s “safeguards” investigation, due in the second half of the year, could see it increase tariffs on foreign suppliers. High-volume, low-cost sellers look to be most at risk, but it could shrink the size of China’s market considerably – including the premium end.
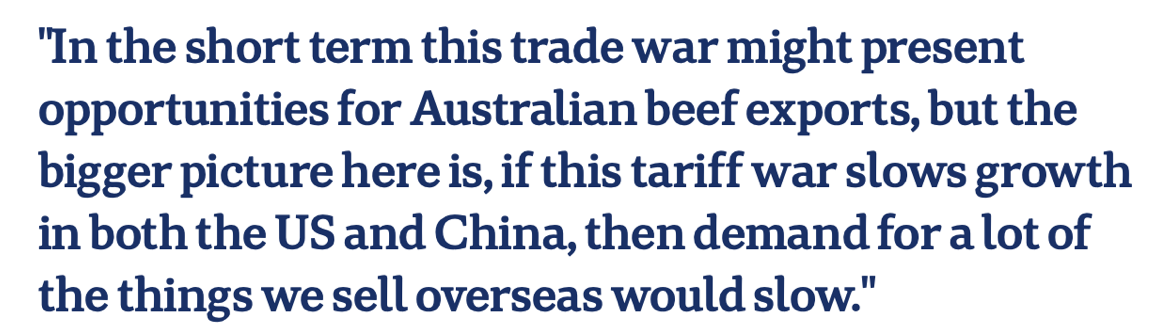
Australian Shadow Trade Minister, Kevin Hogan, looks beyond trade negotiations and considers the macro landscape.
Watch this space.
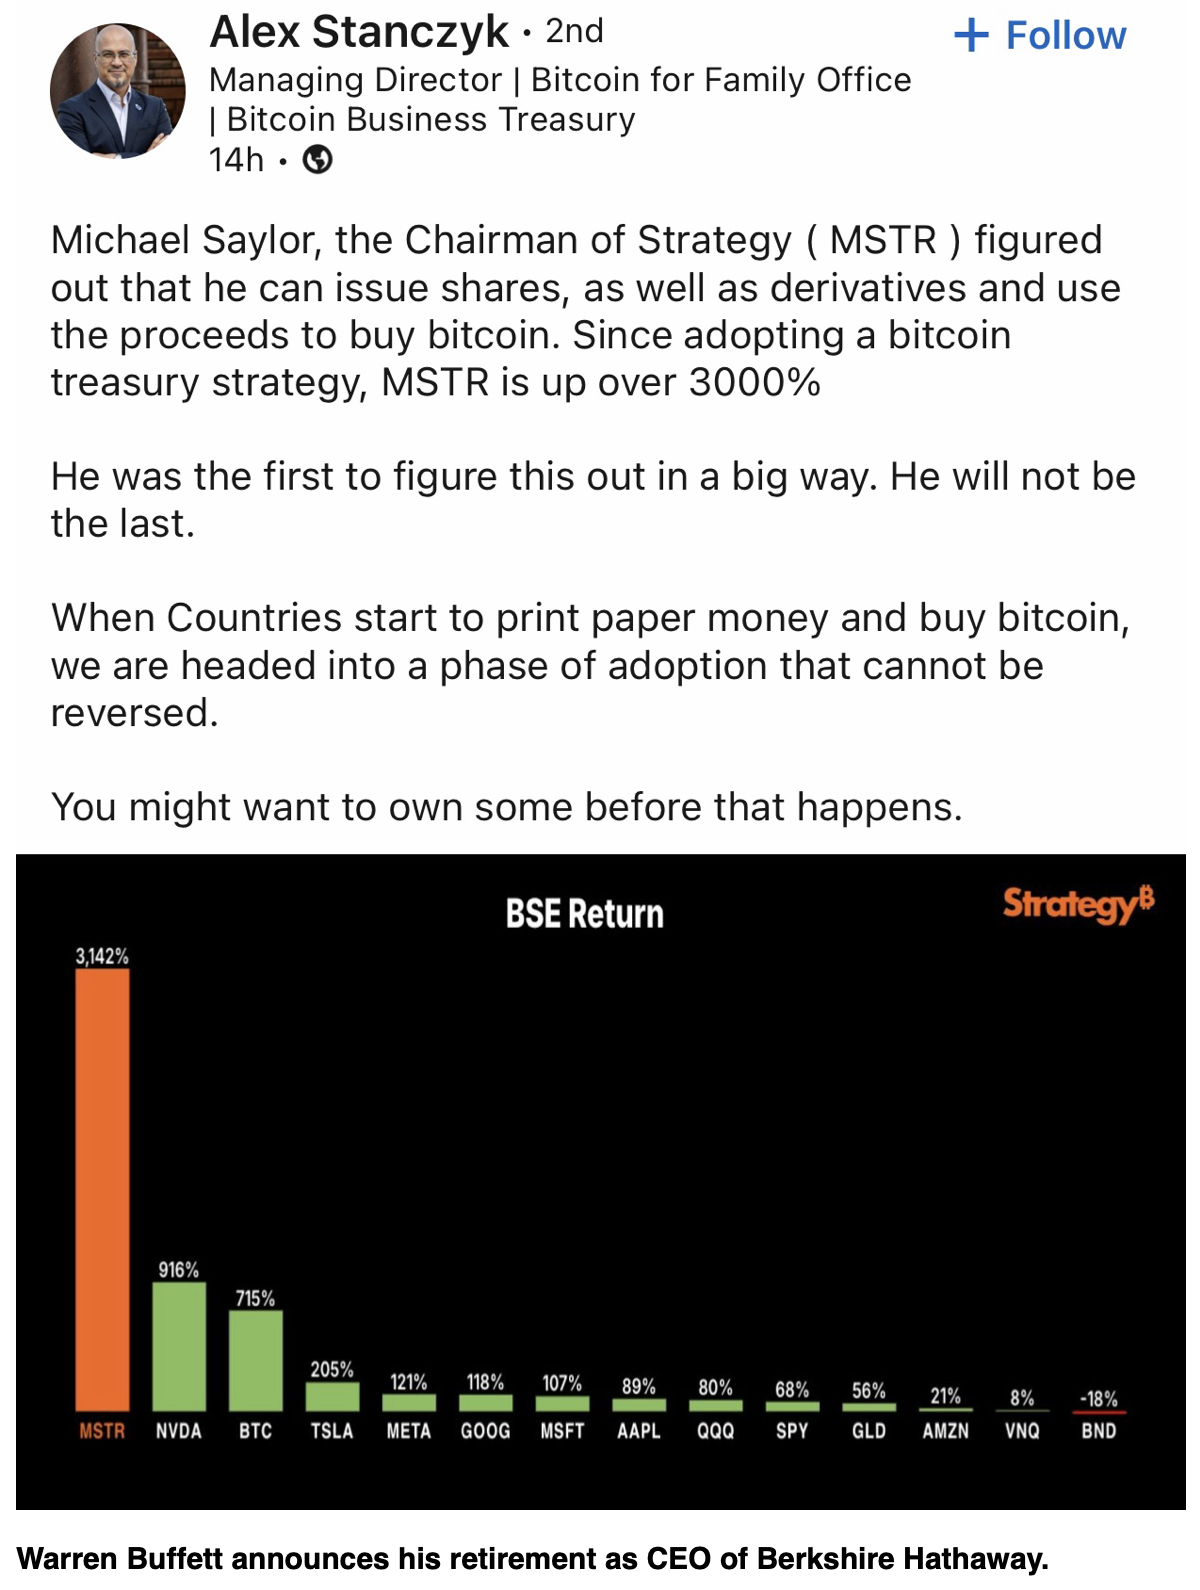
Move over MicroStrategy, Strive is offering a new product
A new NASDAQ listed firm – Strive - has just announced its merger with Asset Entities, creating the first publicly traded Bitcoin treasury company.
The firm will oversee $2 billion of assets.
The agreement will allow the merged company to carry out aggressive purchases of Bitcoin through new financial products, like BlackRock and Greyscale.
Strive Enterprises was co-founded in 2022 by Vivek Ramaswamy and Anson Frericks. The new firm will be led by Strive CEO Matt Cole, who previously managed a $70 billion fixed income portfolio.
Several strategies will be available under Cole’s leadership.
One strategy will be a Bitcoin for equity tax-free exchange, which will be structured under Section 351 of the IRS tax code.
Strive Enterprises will own 94.2% of the newly combined public company, while shareholders of Asset Entities will receive a 5.8% share.
It appears Strive is executing a similar playbook to Strategy and Metaplanet in terms of centralizing ownership, utilizing equity and debt financing to accumulate Bitcoin, and treating it as a treasury reserve asset.
Although it could also dilute its equity, it is taking risks to maximize long-term value by aggressively deploying capital in BTC. However, Strive’s section 351 tax-free exchange of Bitcoins for equity is different from both Metaplanet and Strategy. If successful, Strive could persuade Bitcoin holders to trade their Bitcoin for equity without having to pay a tax.
This article is only an item of interest, not a recommendation to buy any products marketed by Strive.

Cheers
Jacquie
(A RETEST OF THE LOWS IS QUITE LIKELY)
May 7, 2025
Hello everyone
The bounce since the lows on April 8 has been quite strong on easing angst about tariffs and Federal Reserve independence.
The strength and breadth of the rally have triggered some positive technical signals. However, it would be foolish to believe that we have escaped the bear in the woods altogether just yet.
History provides a sobering reminder about bear market psychology.
Let’s revisit 2008.
During the Global Financial Crisis, the S&P 500 experienced rallies averaging 10% each (typically lasting less than two months), while ultimately losing 57% over a year and a half. The Tech Bubble saw seven rallies averaging 14% over five-month periods amid a 49% overall decline spanning two and a half years.
Dan Niles, founding partner of Alpha One Capital Partners, explains that “the desire to believe it was the bottom was quite high during each of those rallies, but earnings estimates, and trailing PE (share price to earnings) multiples had to still go lower, which ultimately drove the stocks lower.”
Niles argues that finding the market bottom will normally take more time unless there is fiscal stimulus or easier monetary policy. However, the government is currently prioritizing spending cuts and as Niles points out, “the Fed is on hold given their concerns over tariff-driven inflation in the pipeline, and unemployment still remains low.”
U.S.-China relations remain a significant market variable. Prospects of a meaningful resolution in the short term, at least, appear dim.
As we head into the second half of the year, it appears likely that underlying weakness in the economy will show up in the data and will lead to negative GDP growth in the third quarter and S&P500 earnings expectations being revised lower.
Given this scenario, the current Wall Street estimates for over 10% S&P 500 earnings per share growth for 2025 look optimistic and should instead be dialled back down to flat. If we enter a recession, EPS growth is likely to go negative.
This means that the market’s current valuation multiple is too high. The S&P trailing multiple at 23x should probably be closer to 19x at the current inflation levels. Niles explains that in a recession, this PE is usually closer to mid-teens.
Niles comments that the above factors will probably cause a retest of the lows for stock prices at the very least.
The U.S. dollar will continue to fall
The dollar index (DXY) has tumbled 9% below its January peak and tumbled to a three-year low. After a near-term bounce, more dollar weakness is on the horizon.

Cheers
Jacquie
(THE RETAIL INVESTOR & WARREN BUFFETT ARE POLES APART)
May 5, 2025
Hello everyone
WEEK AHEAD CALENDAR
MONDAY, MAY 5
9:45 a.m. PMI Composite final (April)
9:45 a.m. S&P PMI Services final (April)
10:00 a.m. ISM Services PMI (April)
Previous: 50.8
Forecast: 50.6
Earnings: Clorox, Palantir Technologies, Ford Motor, Vertex Pharmaceuticals, Diamondback Energy, Coterra Energy, Zimmer Biomet Loews, Tyson Foods, ON Semiconductor
TUESDAY, MAY 6
8:30 a.m. Trade Balance (March)
10:00 a.m. Canada Ivey PMI
Previous: 51.3
Forecast: 51.2
Earnings: Arista Networks, Wynn Resorts, Electronic Arts, Devon Energy, Advanced Micro Devices, TransDigm Group, Marriott International, IQVIA Holdings, Fastenal, Duke Energy, American Electric Power, Gartner, Marathon Petroleum, Global Payments, Fidelity National Information Services, Constellation Energy, Archer-Daniels-Midland
WEDNESDAY, MAY 7
2:00 p.m. FOMC Meeting
Previous: 4.5%
Forecast: 4.5%
2:00 p.m. Fed Funds Target Upper Bound
3:00 p.m. Consumer Credit SA
Earnings: Paycom Software, Fortinet, Skyworks Solutions, Axon Enterprise, Occidental Petroleum, DoorDash, Corteva, EF Industries Holdings, Rockwell Automation, Uber Technologies, Emerson Electric, Walt Disney.
THURSDAY, MAY 8
7:00 a.m. UK Rate Decision
Previous: 4.5%
Forecast: 4.25%
8:30 a.m. Continuing Jobless Claims (04/26)
8:30 a.m. Initial Claims (05/03)
8:30 a.m. Unit Labour Costs preliminary (Q1)
8:30 a.m. Productivity preliminary (Q1)
10:00 Wholesale Inventories final (March)
Earnings: Expedia Group, Insulet, TKO Group Holdings, Paramount Global, Microchip Technology, Akamai Technologies, Warner Bros. Discovery, ConocoPhillips, Tapestry, Molson Coors Beverage, Match Group.
FRIDAY, MAY 9
8:30 a.m. Canada Unemployment Rate
Previous: 6.7%
Forecast: 6.7%
8:30 a.m. New York Federal Reserve Bank President and CEO John Williams speaks on Taylor Rules in Policy, Stanford University.
10:00 a.m. New York Federal Reserve Bank Director of Research and Head of the Statistics Group Kartik Athreya speaks on NY State Large Credit Unions CEO Roundtable.
10:15 a.m. New York Federal Reserve Bank President and CEO John Williams speaks on Reykjavik Economic Conference, Iceland.
All Eyes on The Fed This Week
The Federal Reserve Meeting will be a key focus this week – traders will be awaiting crucial updates on interest rate projections and the Fed’s assessment of the US economy. The Fed is likely to keep interest rates unchanged, but they will likely stress that the economic outlook is uncertain, thanks to tariffs, federal layoffs, & stricter immigration. It will be interesting to see if the US dollar can continue its bounce.
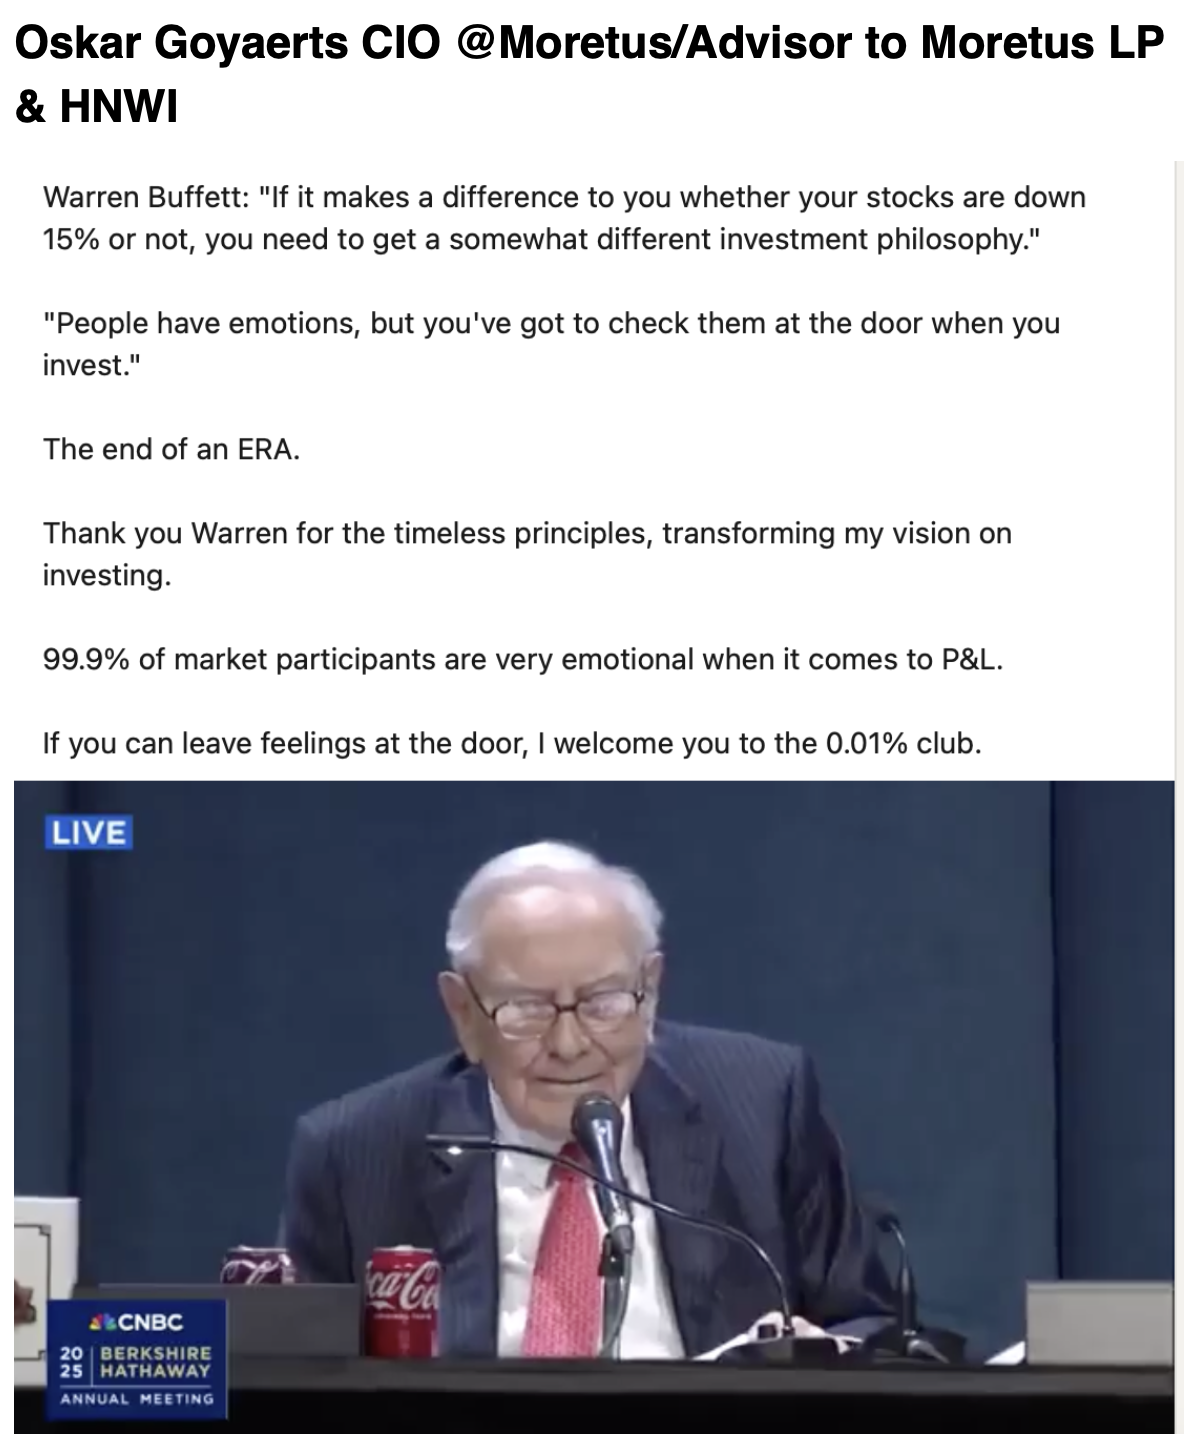
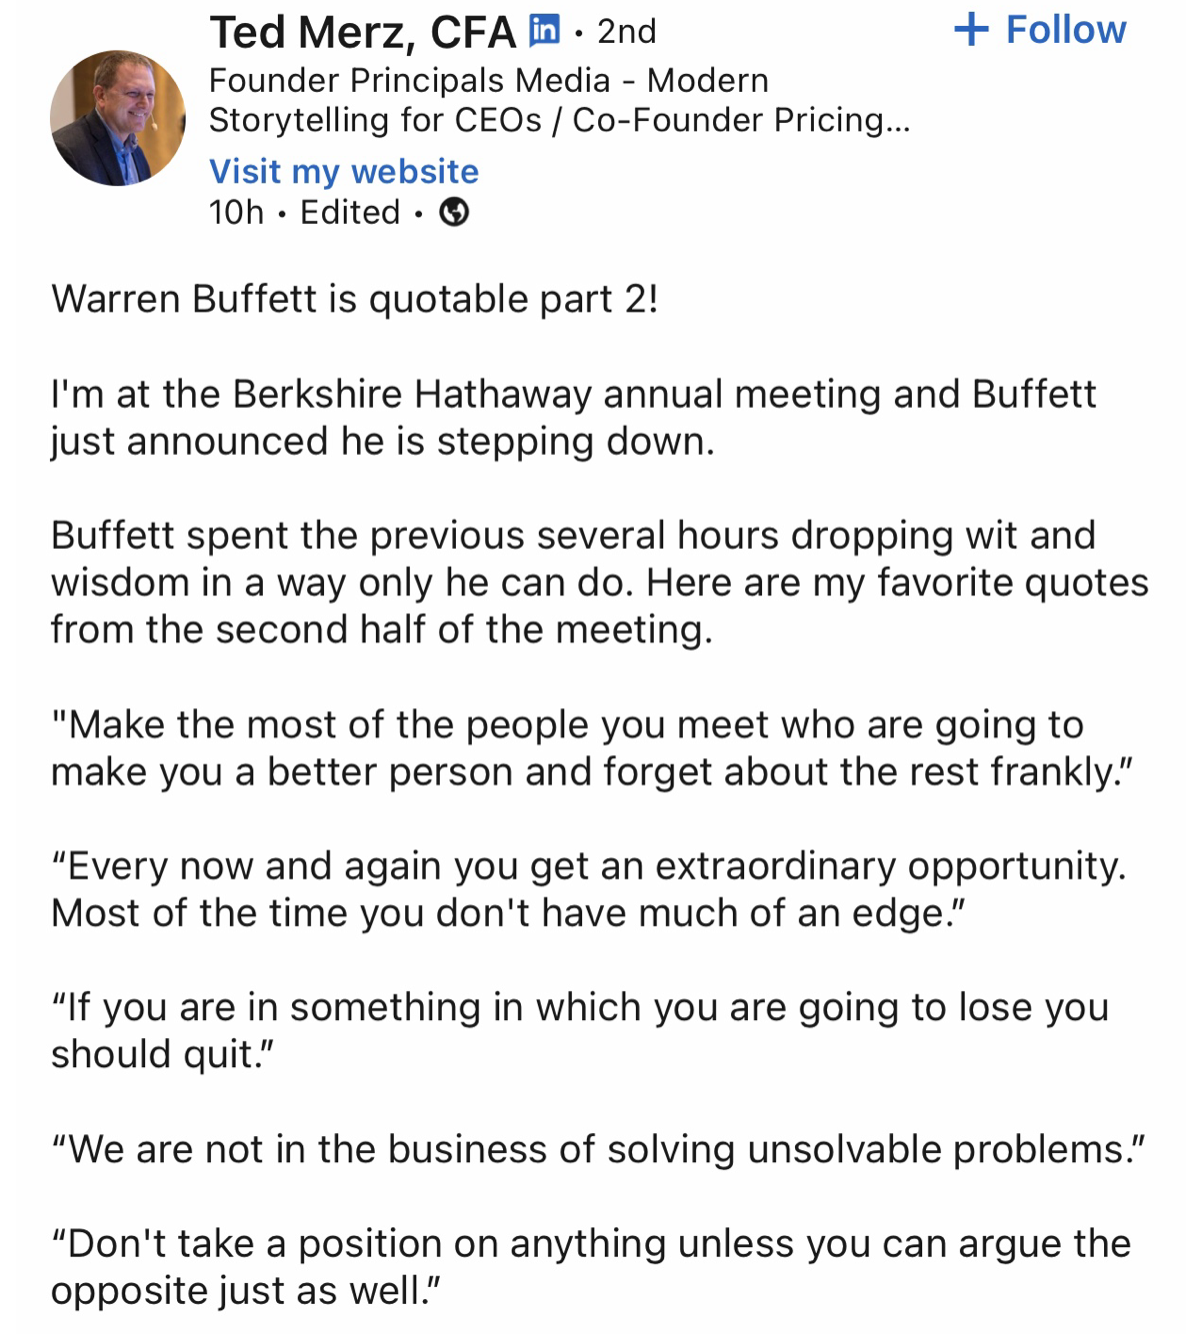
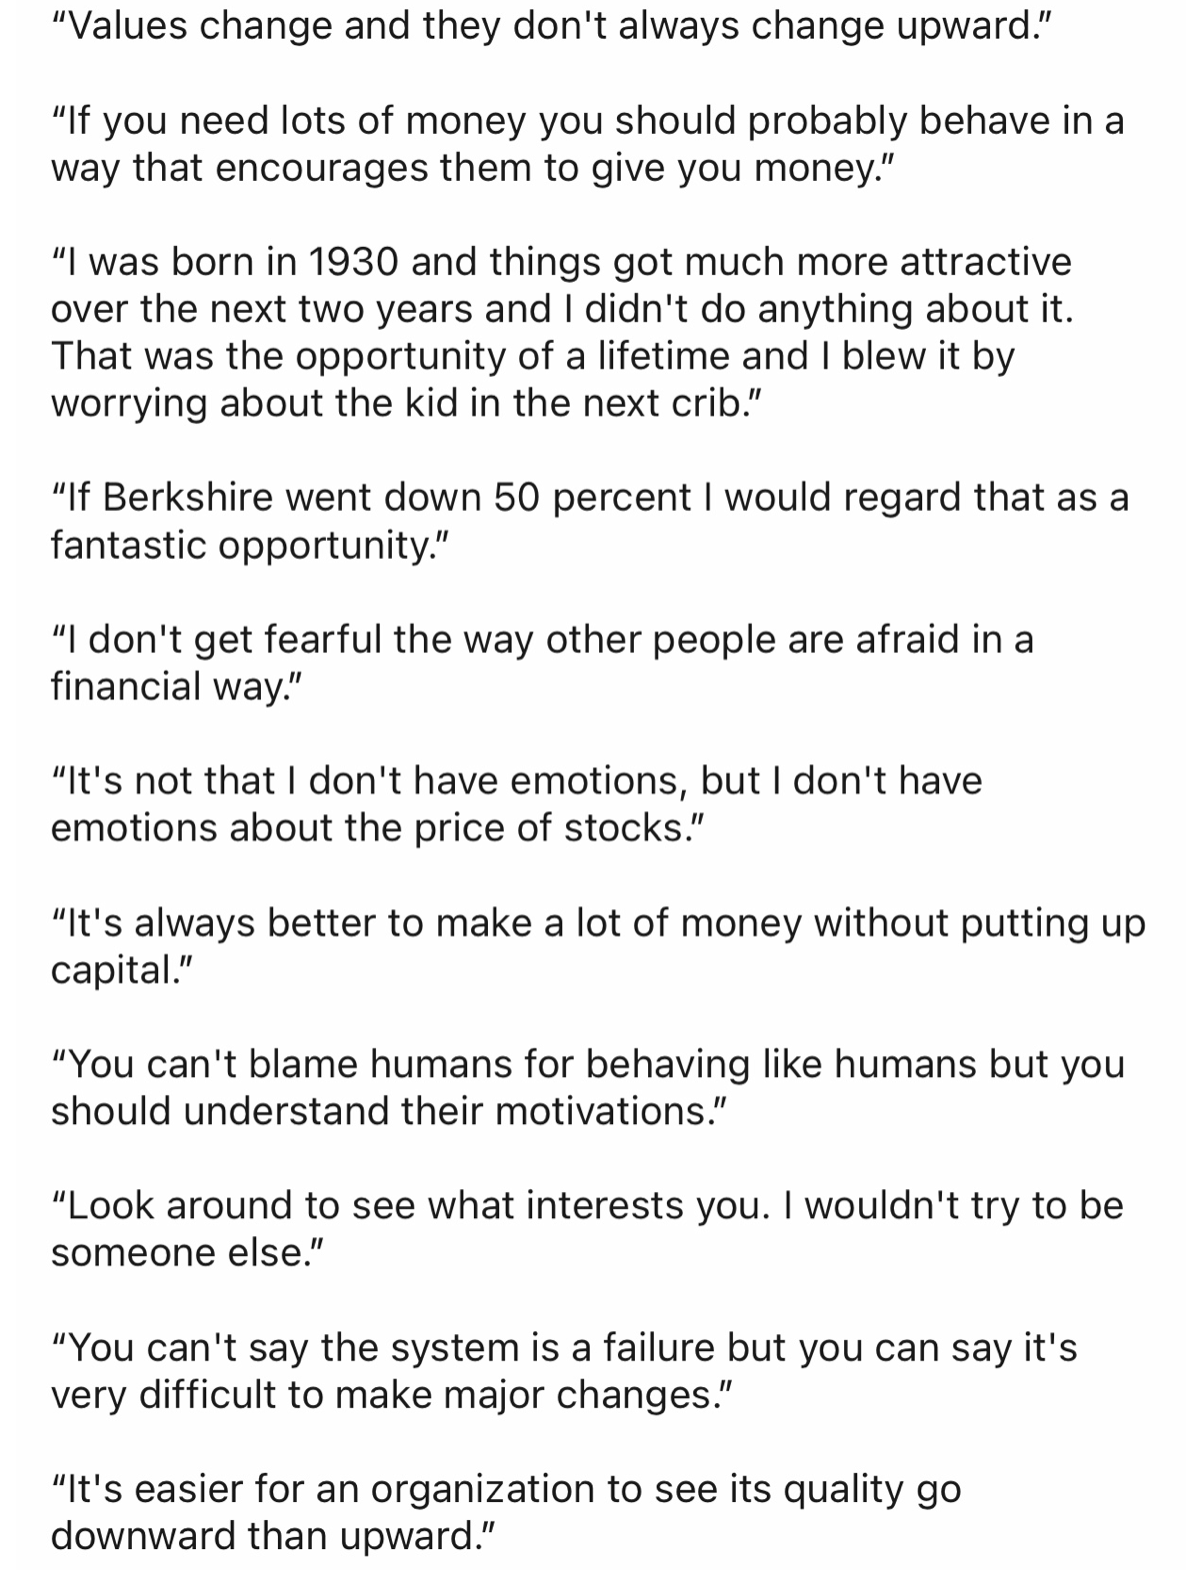
The Average Investor and Warren Buffett – like chalk and cheese
It could be argued that Warren Buffett’s results came from reputation, privilege, access and hard-fought strategic advantage, and not simply buying and holding undervalued stocks.
For most of the last 60 years, Buffett has operated from a position of scale, influence and privilege, that’s completely inaccessible to retail investors. Many of his most lucrative deals weren’t found in the bargain bin of the stock exchange – they were created in private conversations with CEOs, Treasury Secretaries, and Presidents. His returns weren’t solely fuelled by patience, discipline and astute stock selection – they were turbocharged by exclusive deals, regulatory favour and reputation-fuelled access.
So, let’s check out Buffett’s advantages –
Firstly, you and I invest our own money which we need to earn first and then pay taxes on.
Buffett invests other people’s money, for free, pre-tax, and pockets his share of the gains.
That’s thanks to the “Insurance Float Advantage” – this has helped him grow wealth faster than any average investor ever could hope to aspire.
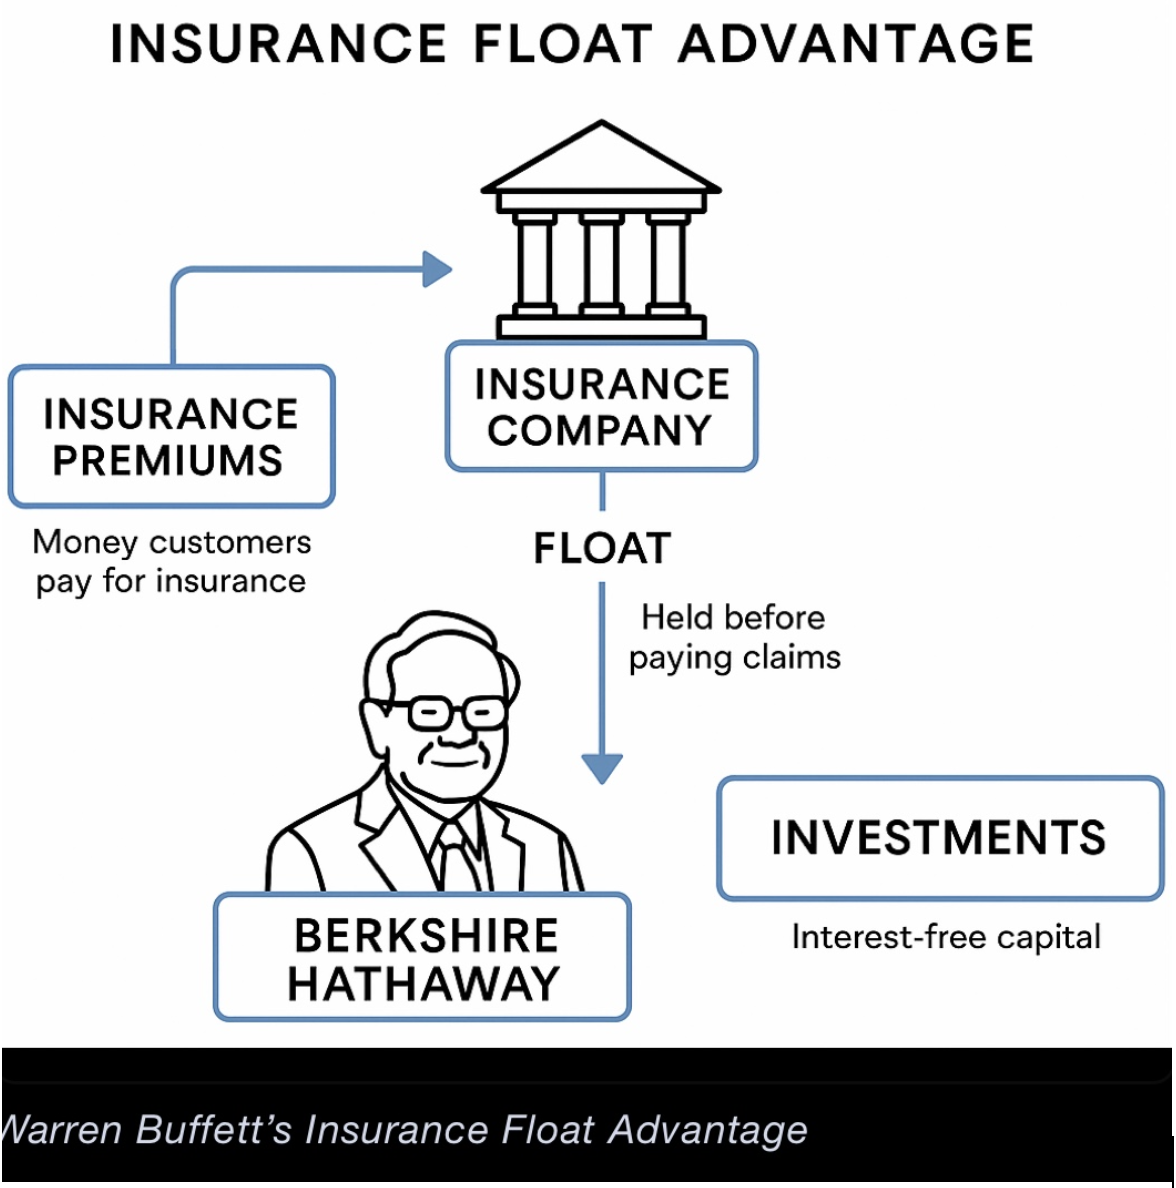
Secondly, Buffett prefers not to pay dividends, allowing Berkshire Hathaway to retain earnings and compound wealth tax-efficiently.
The average investor mostly cannot afford to compound their returns over a 60-year investment career without having to take any out to live on.
Thirdly, many of Buffett’s deals included warrants and preferred shares with terms that provided Berkshire Hathaway with significant upside but very limited risk – structures not available to retail investors who instead must invest in riskier common stock. Billions of Buffett’s profits were accumulated in this fashion.
Next, we can understand Buffett’s additional advantage in having direct access to policymakers and financial government agency officials that the average investor couldn’t even hope to have. Since the 1980’s, Buffett’s companies, such as BNSF and his utilities, have benefited from policies shaped in part by industry lobbying. Berkshire has influence in Washington and Wall Street circles far beyond the average investor’s reach.
Of particular significance is Buffett’s access to private placements and preferential treatment since 1967. For example, Buffett was involved in the rescue of GE Capital in 2008, when he invested $3 billion in preferred GE stock yielding 10% annually, with added warrants. Ordinary investors got none of these protective features.
It is arguable that Buffett’s greatest returns were made decades ago, and that his post-1990s returns were heavily reliant on reputation, access, and scale – not just investment skill.
The average investor has no chance to be like Warren Buffett. Yes, we can be patient, and buy cheap stocks, and hold them, but we certainly don’t have proximity to policymakers and government officials, nor do we get special deals or preferential treatment.
My advice: do not compare yourself to Warren Buffett. Instead, keep educating yourself, and keep buying stocks through turbulent times and when the market is rallying.
MARKET UPDATE
S&P 500
The index has broken above key resistance at 5475/85. The price action could be part of a period of limited ranging, with an upside bias – though don’t expect large moves to the upside. This could last for the next few months.
Resistance: 5700/5780/5885
Support: 5570/5475 area
GOLD
Gold has moved lower from the April 22nd high at $3500. Bearish technical argue that we may have seen the top for at least a month, and potentially much more.
But when topping occurs, we must remember that it is common to see periods of ranging, rather than a one- way decline.
Resistance: $3265/70 and $3367
Support: $3200/$3160/$3049
BITCOIN
Bitcoin has hit 97.9k – that 109.4k peak remains in view. However, some consolidation may be seen for the next few weeks before we see more strong moves to the upside.
Resistance: 97.9/100.5/101k
Support: 95.3/95.8k and 92.7/88.5k
CURRENT TRADES
Take profits in the (IBIT) and (MSTR) options spreads expiring in May. Monitor (MSTR) option spread expiring in July and your (IBIT) expiring in June. It was up to each individual how many contracts they entered for each trade.
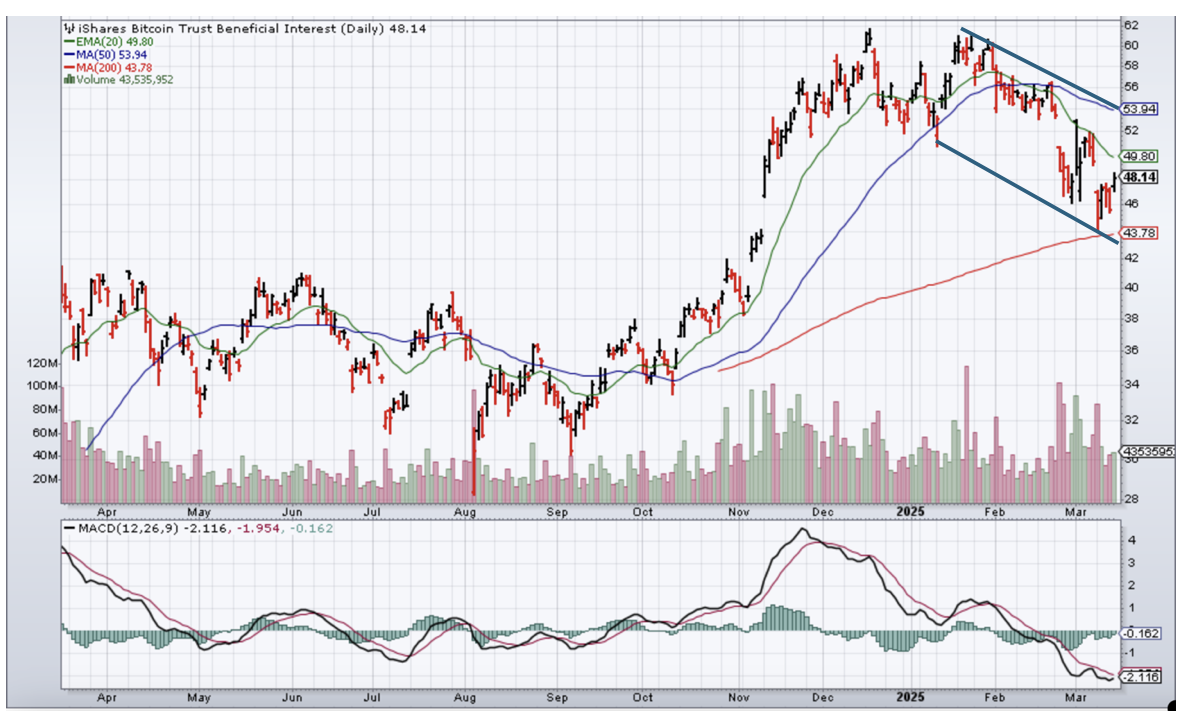
(IBIT)
(IBIT) Price = $48.14 on March 17, 2025
1/ Sell 1 May 16, 2025, (IBIT) $55 call
Buy 1 May 16, 2025, (IBIT) $50 call
Max Profit = $337
Max Loss = $163
Cost = $1.63
Sell 1 June 20, 2025(IBIT) $65 call
Buy 1 June 20, 2025 (IBIT) $55 call
Max Profit = $815
Max Loss = $185
Cost = $1.85
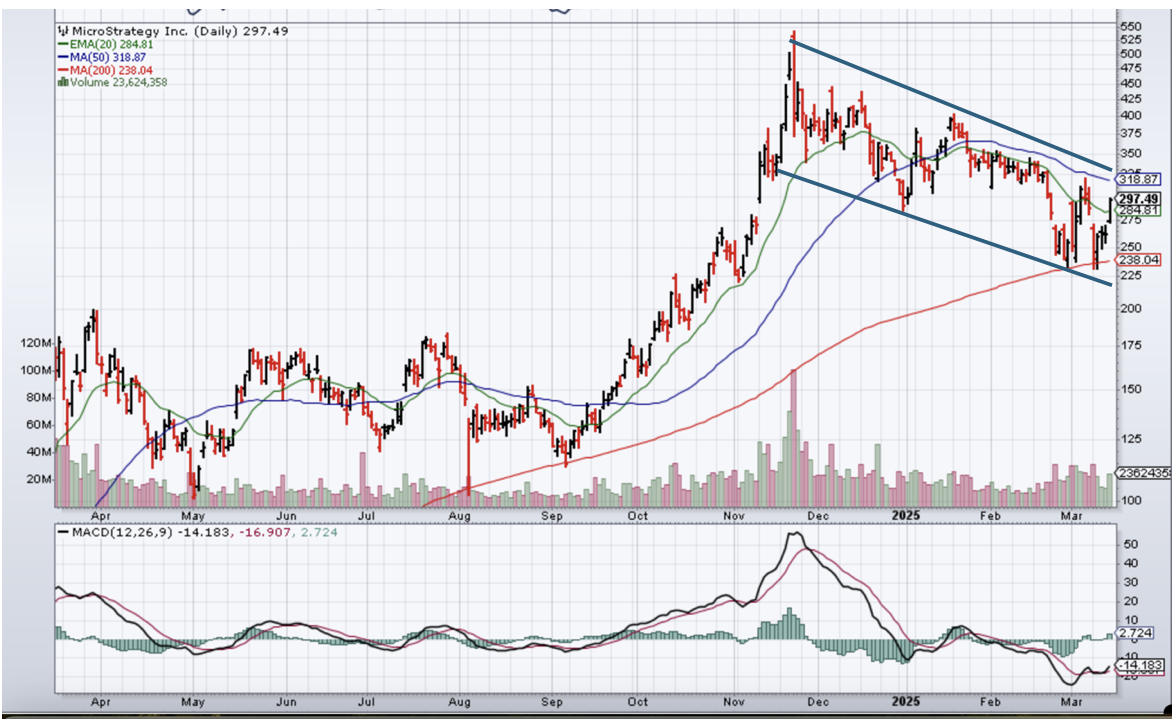
(MSTR)
MicroStrategy (MSTR) Price = $297.49 on March 17,
Sell 1 May 16, 2025 (MSTR) $320 call
Buy 1 May 16, 2025 (MSTR) $310 call
Max Profit = $630
Max Loss = $370
Cost = $3.70
Sell 1 July 18, 2025 ((MSTR) $325 call
Buy 1 July 18, 2025 (MSTR) $315 call
Max Profit = $647
Max Loss = $353
Cost = $3.5
MicroStrategy Daily Chart (March 17, 2025)
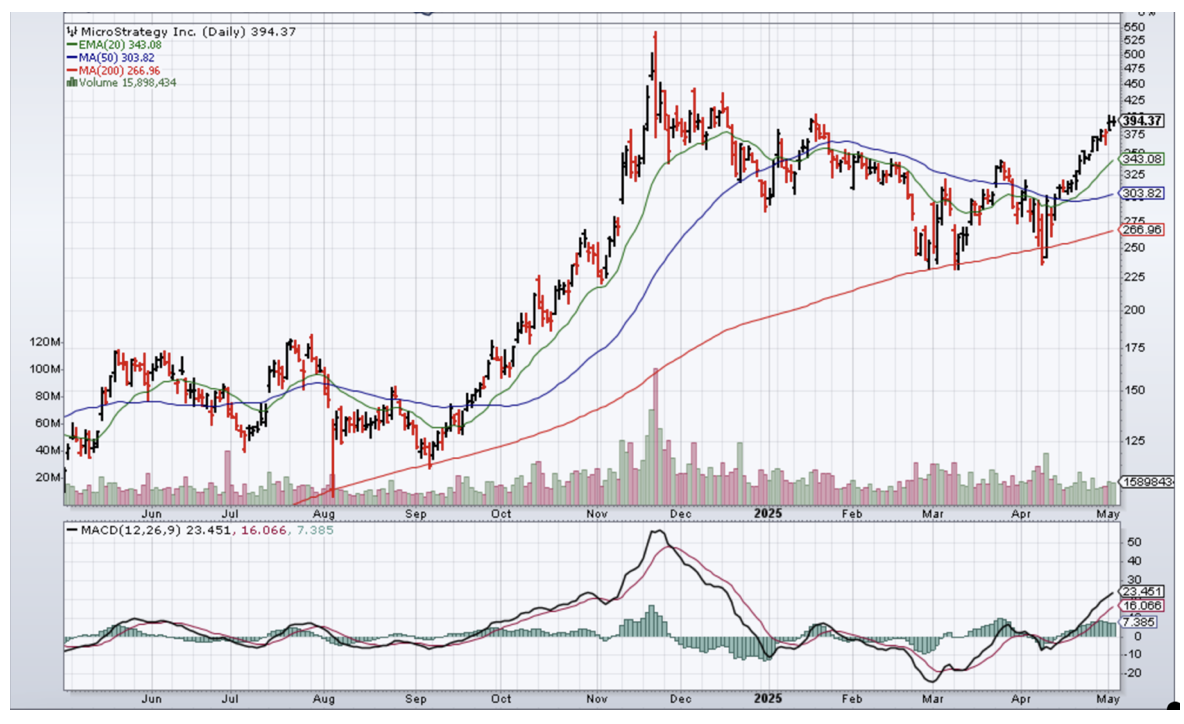
(MSTR) May 2, 2025
(IBIT) Daily Chart (March 17, 2025
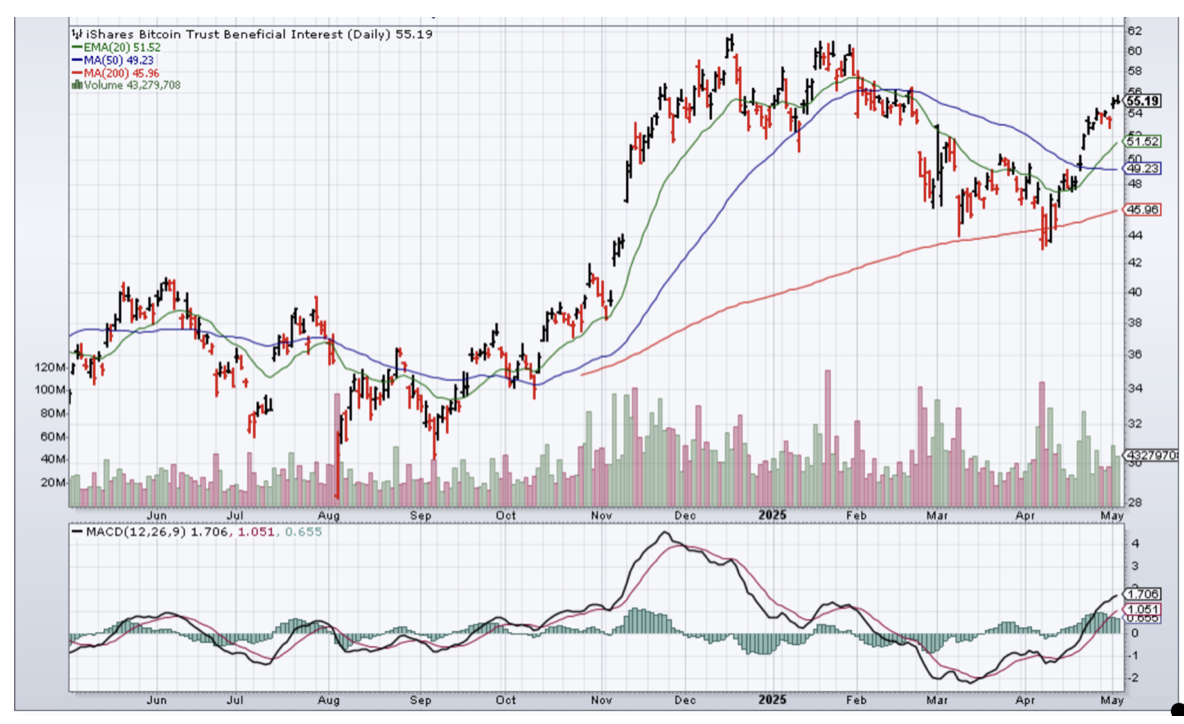
(IBIT) May 2, 2025
HISTORY CORNER
On May 5


QI CORNER
SOMETHING TO THINK ABOUT
Nicole Lapin
NYT bestselling author
Money News Network founder


Cheers
Jacquie
(SUMMARY OF JOHN’S APRIL 30, 2025 WEBINAR)
May 2, 2025
Hello everyone
TITLE – “The Special Recession Issue”
PERFORMANCE –
MTD = 12.69%
2025 YTD = 26.52%
Since Inception = +776%
Trailing one year return = 84.47%
PORTFOLIO –
Risk On
(MSTR) 5/$220-$230 call spread
(MSTR) 5/$250-$260 call spread
(NFLX) 5/$850-$860 call spread
(JPM) 5/$190-$200 call spread
Risk Off
(SPY) 5/ $570-$580 put spread
(GLD) 5/ $275- $285 call spread
(TSLA) 5/$320-$330 put spread (Profits taken)
METHOD TO MY MADNESS
Market looks through the noise to a trade war solution…
Bonds stabilize after Trump backs off Powell firing.
Markets have entered wide trading ranges with a lot of volatility.
Economic data remains consistently weak, capping any upside in stocks.
Recession call is still on, with China in no hurry to negotiate.
US Dollar hits three-year lows on “Sell America” trade
Oil bounces on Iran war risks.
Gold remains golden at new all-time highs, silver ready to play catch-up.
THE GLOBAL ECONOMY – UNIVERSALLY BAD
Negative 0.3% GDP growth, 4.3% March inflation rate point to stagflation.
Jay Powell hints at no rate cuts this year.
Consumer Confidence dives on tariff fears from 57.0 in March to 52.2 in April.
IMF cuts US GDP forecast for 2025 from 2.8% to 1.8%.
Leading Economic Indicators plunge, down 0.7% to 100.5.
Europe lowers interest rates, down 0.25% to 2.25%.
Unemployment fears hit five year- high.
US Inflation Expectations hits 44 year- high.
STOCKS – ROLLER COASTER
Stock markets suffer worst start to a year in history, but still expensive.
Morgan Stanley marks down (SPX) earnings, from $270 to $257 per share.
The Volatility Index ($VIX) spikes to $54.
All Capital gains of the last 13 months wiped out at market lows.
Chaos reigns supreme, with the (SPX) dropping 20% at the lows.
Hedge Funds are still dumping technology stocks, as they still command big premiums to the main market.
Tech leads the downturn on every selloff.
All long-term technical indicators have rolled over, meaning that the bear market could continue until summer at the earliest and next year at the latest.
2025 will be a down year for stocks.
John is looking to buy gold and banking stocks.
Vistra (VST) long term hold.
BONDS – STABILIZING
Foreign Central Banks selling US Treasury Bonds and buying Treasury bills.
Treasury discussed banning sales of bonds by foreign investors or hitting T-bills with withholding taxes.
With Bonds suffering their worst selloff in 25 years no one is rushing back in.
Continuing collapse of the US dollar is keeping away bond investors.
Bond Credit Quality is crashing, as recessions lead to more defaults.
Avoid (TLT), (JNK), (NLY), (SLRN) and REITS.
FOREIGN CURRENCIES
US dollar hits three year low, as the flight from America trade accelerates.
Rising rates didn’t provide any help, meaning the weakness is structural.
15 years of long dollar positions are unwinding.
The Trump economy is forcing investors to flee all US assets, including stocks and currency.
Massive cash flight is running away from the US and into Europe and China.
Buy (FXA), (FXE), (FXB), (FXC), and (FXY).
ENERGY & COMMODITIES – Crash!
Oil crashes down an amazing $13 or down 18% in a week, from $72 to $59.
High dividend paying (XOM) has collapsed by 18%.
It is the sharpest fall in Texas tea prices since the 1991 Gulf War.
Recession fears are running rampant, and no one wants to pay for storage until a recovery which may be years off.
Sell all energy rallies.
A global recession is looming large.
Avoid all energy plays like the plague.
PRECIOUS METALS – Taking a Break
JP Morgan targets Gold at $4000 in Q2, as the “Sell America” trade gathers steam.
Gold tops $3,424, the 1980 inflation adjusted all-time high.
Interest rates seem to be no longer a factor in the gold trading, losing the opportunity cost.
Gold sees first $100 up day in history.
Natural profit taking takes gold back 5%.
Central bank buying and Chinese savings demand continues unabated with China devaluing its currency.
Keep buying all (GLD) metal dips.
REAL ESTATE – Gone Quiet
New Home Sales Jump in March. The median price of a new home sold is down 7.5% YOY thanks to greater demand for lower priced homes. Interest rates delivered a short-term dip in March which they gave back in April.
Existing Homes Sales hit 16 year low.
Sales of previously owned U.S. homes fell 5.9% in March to an annualized rate of 4.02 million, the weakest March since 2009.
The median sales price increased 2.7% from a year ago to $403,700, a record for the month of March and extending a run of year-over-year price gains dating back to mid-2020.
Weekly mortgage demand has plunged 13%.
THE WRAP
Stocks – sell rallies
Bonds – stand aside
Commodities – stand aside
Currencies – buy dips
Precious Metals – buy dips
Energy – stand aside
Volatility – sell over $50
Real Estate – stand aside
NEXT STRATEGY WEBINAR
12:00 EST Wednesday, May 14, 2025
From Incline Village, NV.

Cheers
Jacquie
(THE STOCK MARKET IS HEADED HIGHER NEXT YEAR ACCORDING TO THIS SIGNAL)

April 30, 2025
Hello everyone
Have you ever heard of the Zweig Breadth Thrust?
Well, last Thursday, April 24, it was signalled.
And yes, that’s a good thing.
The Zweig Breadth Thrust was developed by legendary investor Martin Zweig. He published a major stock market newsletter in the 1970’s. He is perhaps best known for predicting Black Monday in 1987, when stocks lost over 20% in one day.
He developed the Zweig Breadth Thrust after realizing that a shift from widespread selling to buying in 10 days or less had led to significant gains over the following year.
The Zweig Breadth Thrust triggered on April 24 is just the 20th since 1945, according to Carson Investment Research. The last time we saw one was near the S&P 500’s low in November 2022.
In the past, the benchmark S&P 500 has produced gains 100% of the time one year later, with an average and median return of over 23%.
Zweig Breadth Thrusts are uncommon because they require a period of extremely broad selling immediately followed by extremely broad buying.
The measure is calculated by dividing a moving average of the number of NYSE stocks advancing by the total number of advancing plus declining stocks.
Initially, a ratio of 0.659 was considered a buy signal, while 0.366 was a sell signal. However, the indicator’s buy signal has since been modified to be when the 10-day exponential moving average of stocks rises above 61.5% after being below 40% within the past two weeks
The S&P 500 has historically delivered robust returns after a Zweig Breadth Thrust.
Not only was the S&P 500 up one year later by an average of nearly 24% following every previous occurrence, but it has also delivered impressive short- and intermediate-term results.
The average historical return over the following one, three, and six months is 5%, 8%, and 15%, with a 95%, 79%, and 100% success rate.
But the lesson here is to be cautious. Rightfully so, this signal is one to respect. But remember that stocks have retested and even made new lows in the past following them, including in 2023, when we got two signals, one in spring and the other in the fall.
Investors have plenty to be concerned about. Inflation, unemployment numbers are rising, and a decelerating (GDP). And then there is the muddy tariff landscape on top of that, which can influence people’s spending habits.
In short, a Zweig Breadth Thrust doesn’t mean we have escaped the bear just yet. Stocks often require back-filling of gains, meaning a retest or new low isn’t out of the question.
Nevertheless, the returns associated with a Zweig Breadth Thrust are undeniably encouraging for long-term investors with horizons longer than six months or one year.
BITCOIN TARGETS ACCORDING TO AN ARK STUDY
An ARK study sees Bitcoin hitting up to $2.4 million by 2030, driven by institutional inflows, nation-state adoption, and growing on-chain utility.
The analysis by the firm highlights institutional investment — spot Bitcoin ETFs in particular — as the biggest driver in the bull case, contributing 43% of total capital inflows.
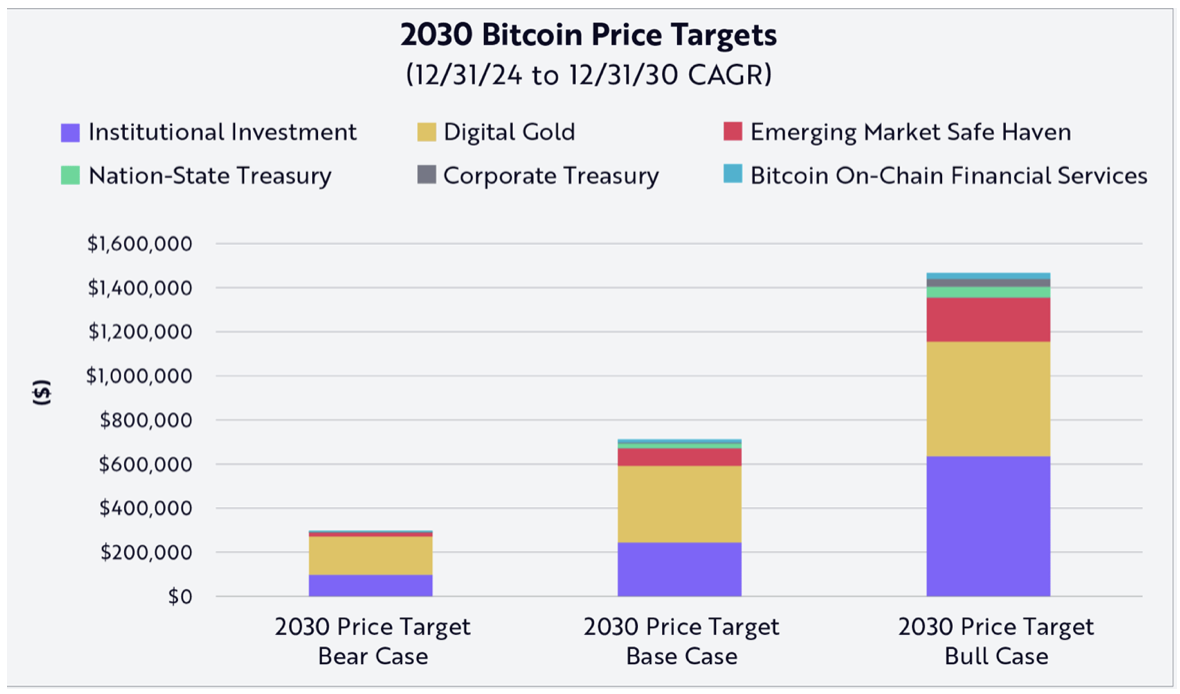
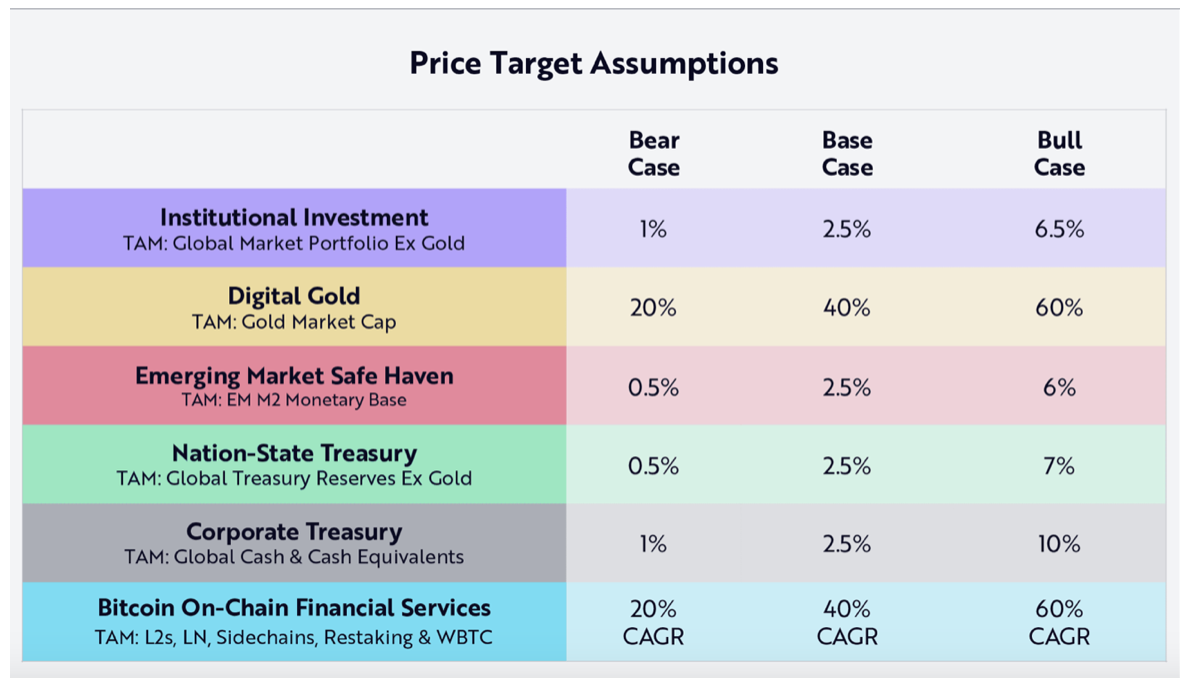
ARK Invest believes that Bitcoin’s future price targets are justified by its increasing role as a global financial asset that is receiving capital inflows from numerous avenues. It’s being considered a store of value, especially in developing countries where citizens face inflation and currency devaluation.
The spread of nation-state adoption, starting with nations such as El Salvador and Bhutan, also recently announced by President Donald Trump in the U.S., reinforces the bull case ARK is assuming.
Furthermore, growing corporate adoption of Bitcoin and the growth of on-chain financial services such as the Lightning Network and WBTC are further boosting the capital potential of Bitcoin. These dynamics, Ark says, lend their forecast structural validity.
Wrapped Bitcoin (WBTC) is an Ethereum token that is intended to represent Bitcoin (BTC) on the Ethereum blockchain. It is not Bitcoin, but rather a separate ERC-20 token that’s designed to track Bitcoin’s value.
The journey to 2030 through this vehicle will be full of peaks and troughs – put BITCOIN in the bottom drawer and leave it alone.

Cheers
Jacquie