September 25, 2024

(WHAT’S UNDERVALUED IN THE STOCK MARKET?)
September 25, 2024
Hello everyone
We are in the final week of September. Fall has begun, and Spring in the southern hemisphere is witnessing a plethora of blooms occupying gardens.
We will also soon be entering the festive season, where most people are looking for bargains. But, if we stay out of the proverbial well-marketed company shops, and bypass their products, and look at the stock market instead as a place to go shopping, where might we find value?
THE SALE CORNER
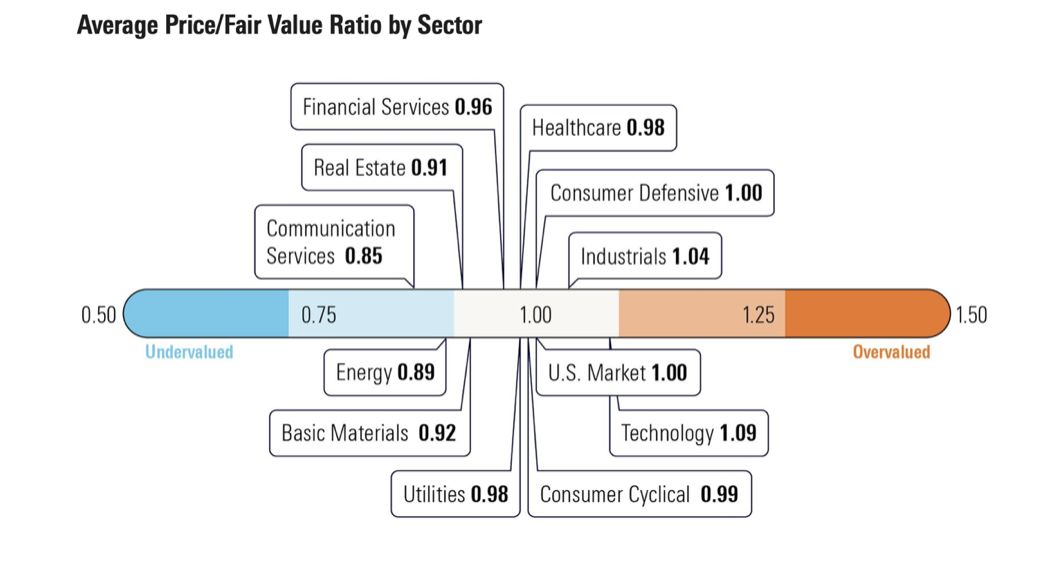
Real estate, communication services, and energy stocks are among the most undervalued categories. With a P/FV ratio of 0.89, energy stocks traded at an 11% discount. Communication services stocks also traded at a discount, with an average P/FV ratio of 0.85.
Look at:
(CCI) Crown Castle International (Wireless Communication Service)
(DUK) Duke Energy (Energy)
(XOM) Exxon Mobil (Energy)
(BHP) Broken Hill Proprietary Company Limited (Energy) Investment in alternative energies will drive Energy stocks higher. Also, a slowly recovering Chinese economy will be good news for (BHP) and its shareholders.
(NEE) NextEra Energy (Utilities – industry electricity)
Stock has severely underperformed in the past and is trading at a very attractive valuation. It will service the AI revolution.
(O) Realty Income (Real Estate) REITS are a play on falling interest rates and investment in data centers.
(GS) Goldman Sachs (Banking Services) Financial services sector will benefit from falling interest rates.
(JPM) JP Morgan (Banking Services)
Some of you may already have a few of these in your portfolio.
PORTFOLIO UPDATE
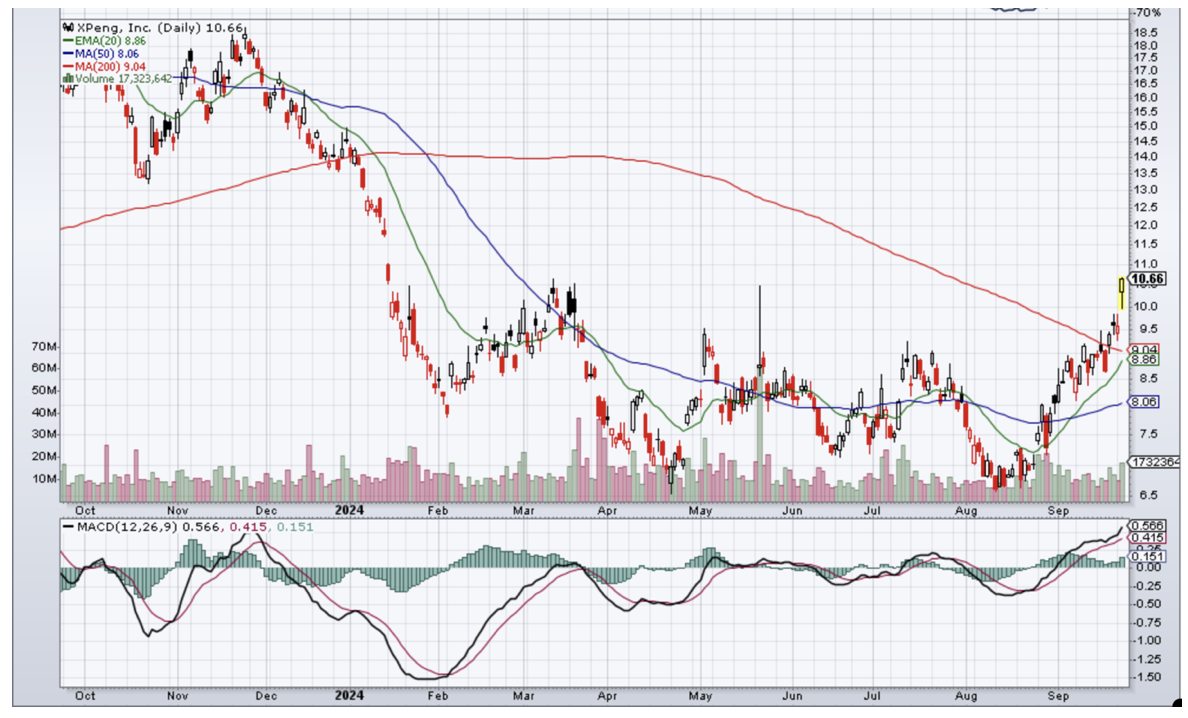
Xpeng (XPEV)
Date Recommended: March 15, 2024
Price: $10.05 on 03/15
Targets: (from various analysts) $11.70, $15.40, $18.00
Rising EV company in China, which is poised to deliver new models in the 4th quarter.
After the recommendation the price dropped, and the range traded for several months. Recently it has started to rally with the Chinese attempts to stimulate their economy. In addition, the CEO recently bought 2 million shares. The P7+ is expected to give stiff competition to American EV maker Tesla (TSLA) as it boasts a vision advanced driver-assistance system that is comparable to the latter’s FSD (full-serve driving) system. Analysts believe the new models being released this year could boost XPeng’s deliveries and become major sales drivers for the remainder of the year.
Daily chart (XPEV)
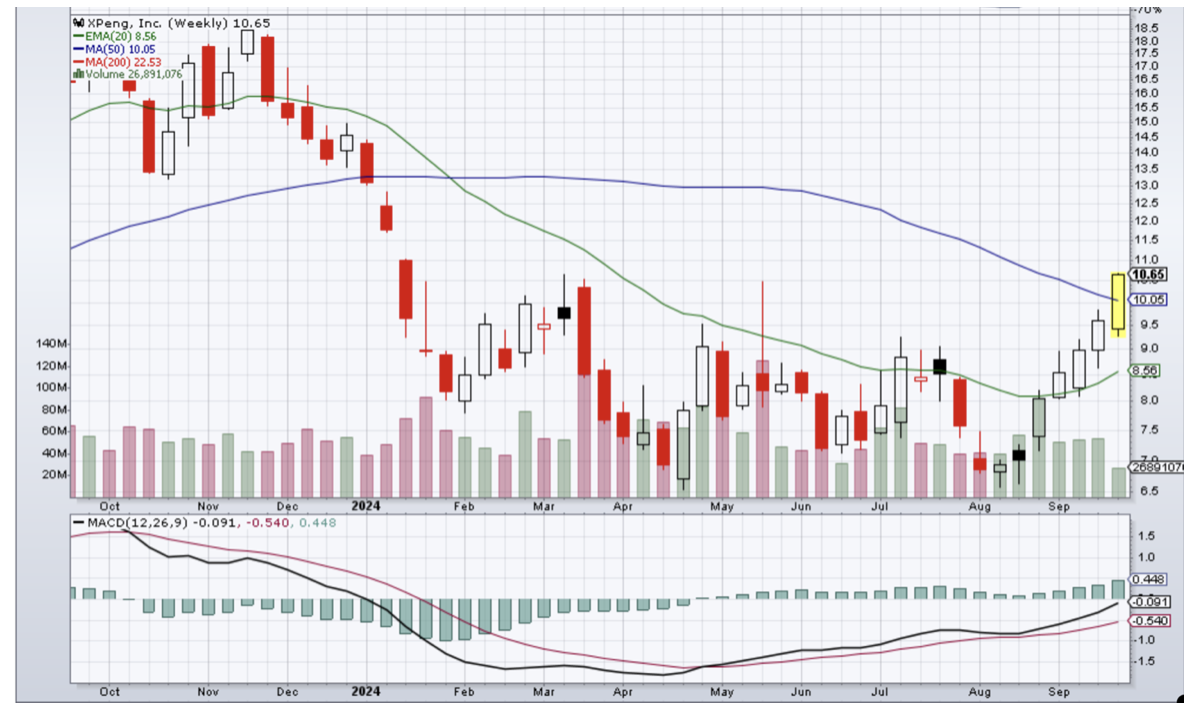
WEEKLY CHART (XPEV)
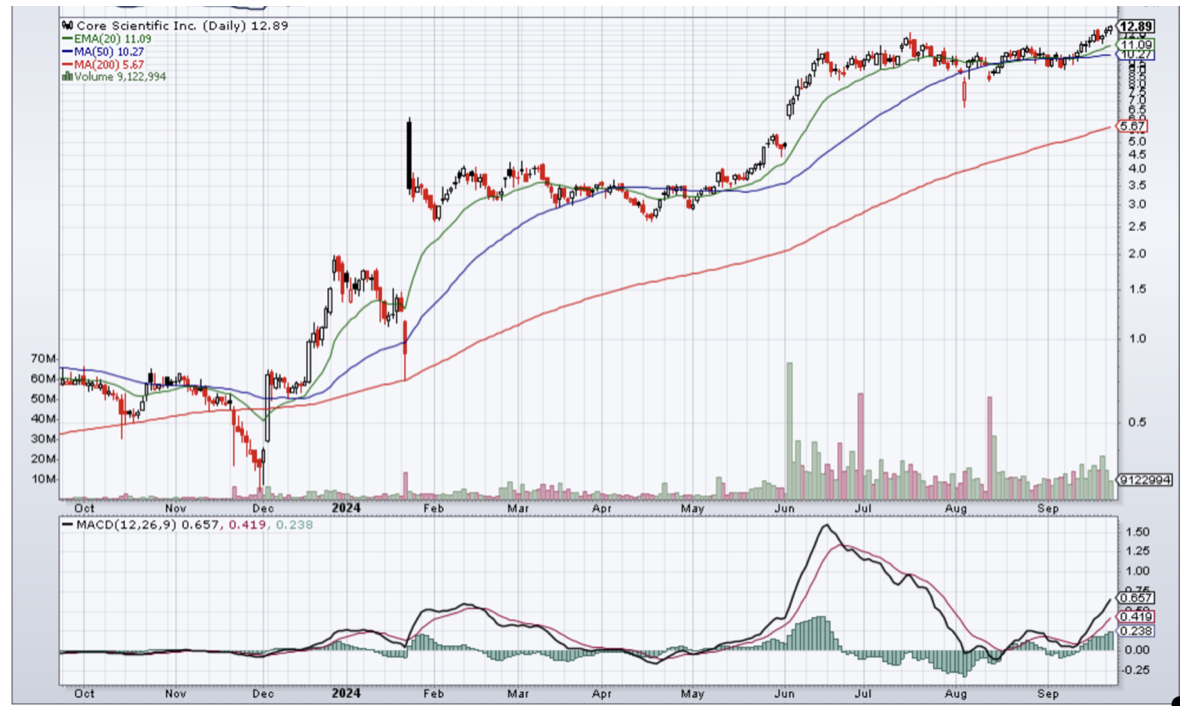
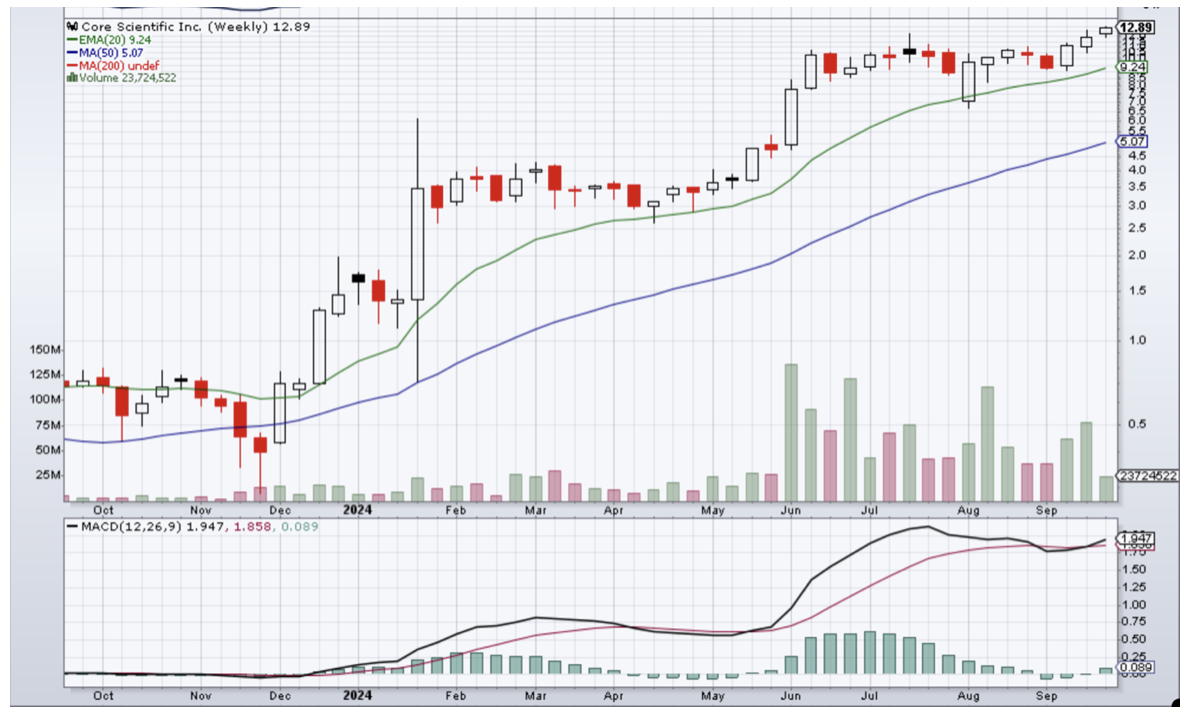
Core Scientific (CORZ)
Date Recommended: August 7, 2024
Price: $9.71 on 08/07
Targets (from various analysts): $13.00, $16.13, $20.00
Core Scientific is a leader in Artificial Intelligence and Blockchain technologies and provides the infrastructure that powers customers’ AI and Blockchain results.
Core Scientific, Inc. is showing rising earnings estimates. A consequent rating upgrade fundamentally means an improvement in the company’s underlying business. Investors’ appreciation of this improving business trend should push the stock higher.
DAILY CHART (CORZ)
WEEKLY CHART (CORZ)
CRYPTO CORNER
This is for those of you who don’t own Bitcoin or Ethereum, or for those who want to add weight. Your percentage weight is up to you. Anywhere from 1%-10%.
Recommendation: Scale into Bitcoin and Ethereum, and then transfer it to your decentralized wallet and just hold it there, and don’t touch it.
I am not asking you to participate in any crypto projects that promise huge rewards. Please avoid, it unless you want to lose your money.
This is a recommendation to buy the coin/s – pure and simple. You will need an account with a crypto exchange to buy the coins.
If you look at the Bitcoin chart, you will see it is coiled up in a flag pattern, which it will eventually break out of to the upside.
I have been buying small parcels of Bitcoin and Ethereum every month for several years.
My decentralized wallet is Exodus. That’s where I hold all my crypto.
You will need to hold a “seed phrase” which is basically your password to that wallet.
Please DO NOT screenshot that phrase on your iPhone or your laptop.
Get a pen and write it down in a book. In fact, write it down in two books. One should go in a safe, the other in a safe place only you and your other half know about. If you lose that seed phrase, you have basically lost your crypto. Don’t contact me as there would be nothing, I could do to help you.
DAILY BITCOIN CHART

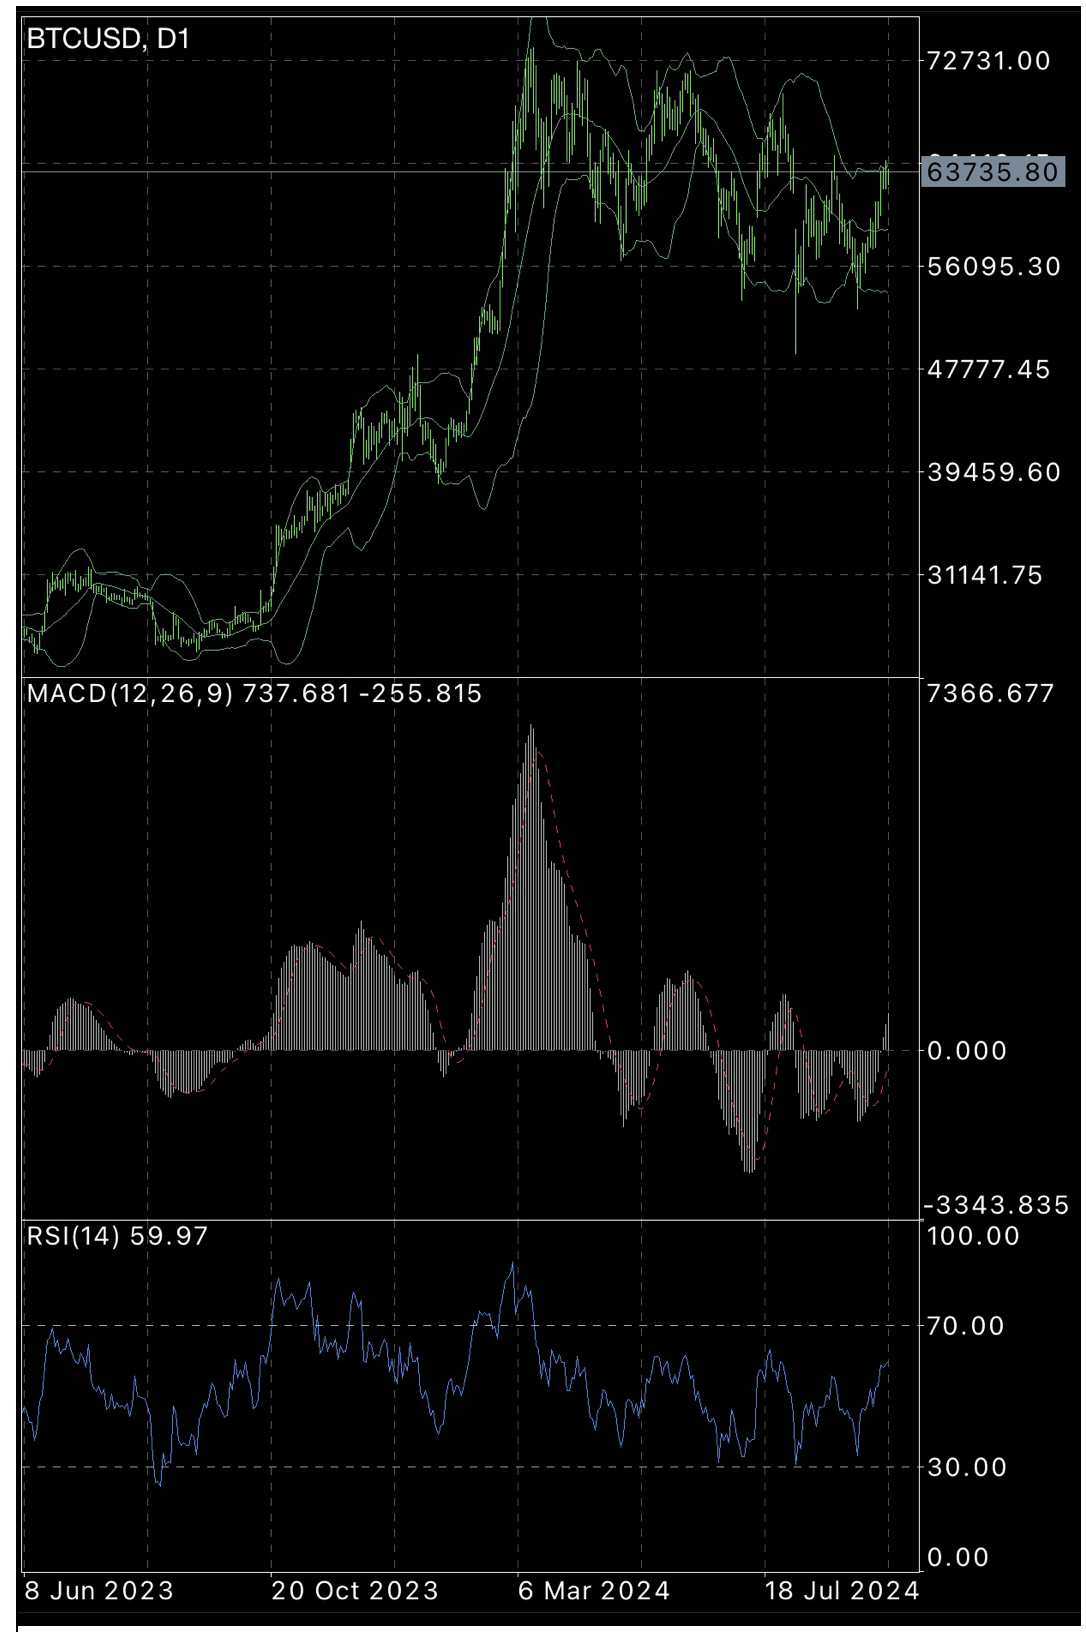
In the Daily chart above, you can see I have drawn a blue line above the flag pattern and below it. The square box shows the low on August 5 at $49,577.
The larger square box shows a lower support zone, situated about the middle of the flagpole. If you look in the MACD section directly below this box, you will note that the MACD has dipped below the 0 line. You will also see that I have drawn a line connecting three drops under the 0 line. The next dip, after the third connected drop, is higher which represents the low in Bitcoin on August 5. This represents a divergence.
Clearly, there is a great overall divergence on the Bitcoin chart. The line connecting the MACD dips below 0 is pointing down, while the line connecting the middle of the flagpole, and the flag pattern is pointing up.
We are now patiently waiting for a break-out from the flag pattern.
WEEKLY BITCOIN CHART

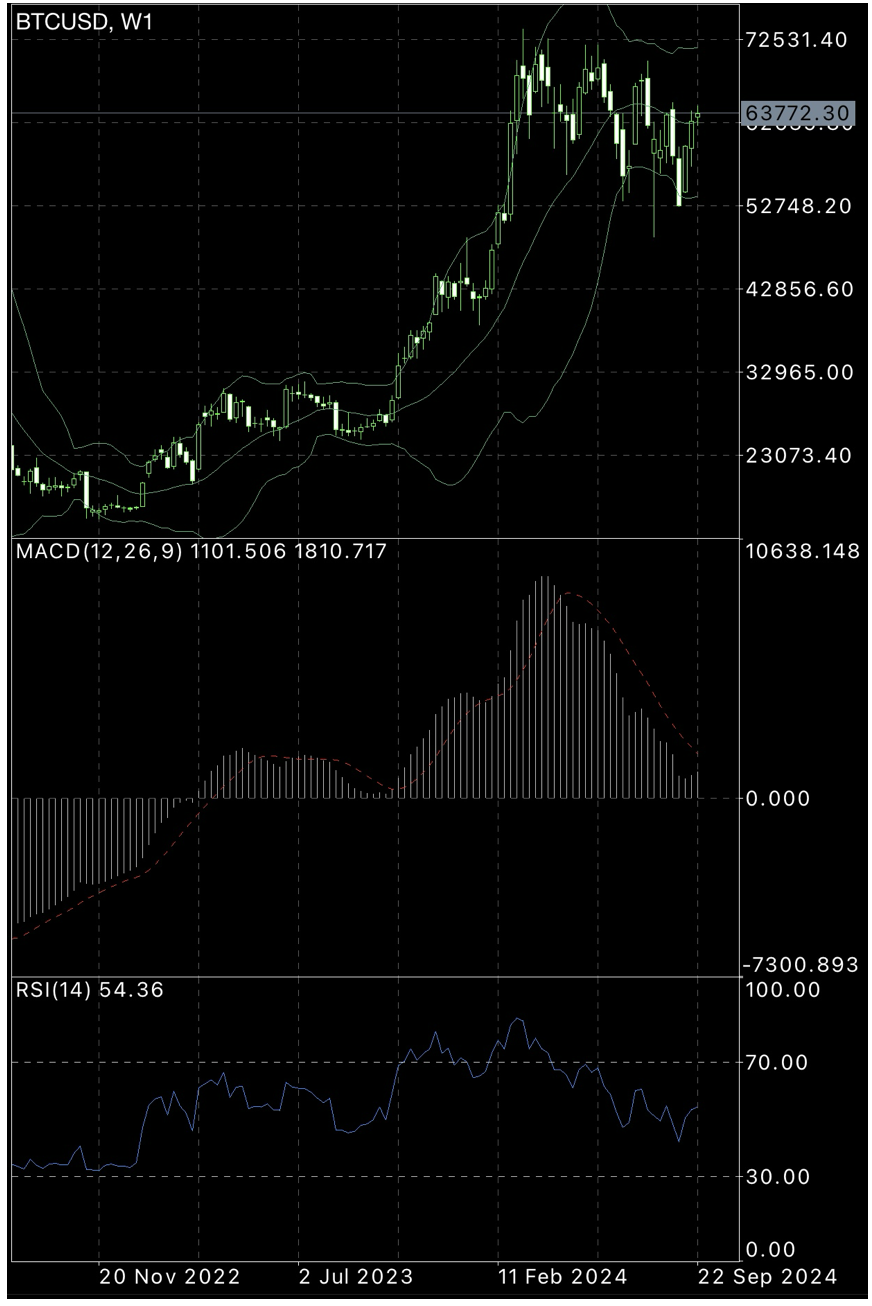
On the Weekly chart above, I have once again drawn the lines above and below the flag pattern. On the underside of the flag pattern, you can see three distinct points I have connected. (The two points make a third pattern). I have circled the middle of the flag pattern to highlight a candlestick there, which is a pin bar, or a hammer. A hammer found at the bottom of a range can indicate a potential bullish move, which has been illustrated here. (If the same candlestick pattern was found at the top of a range, it would be called a “Hanging Man”. And that indicates a potentially bearish move may be about to happen). The long candlestick that made the low on August 5 can be seen as a hammer, which also indicates bullish potential ahead.
QI CORNER
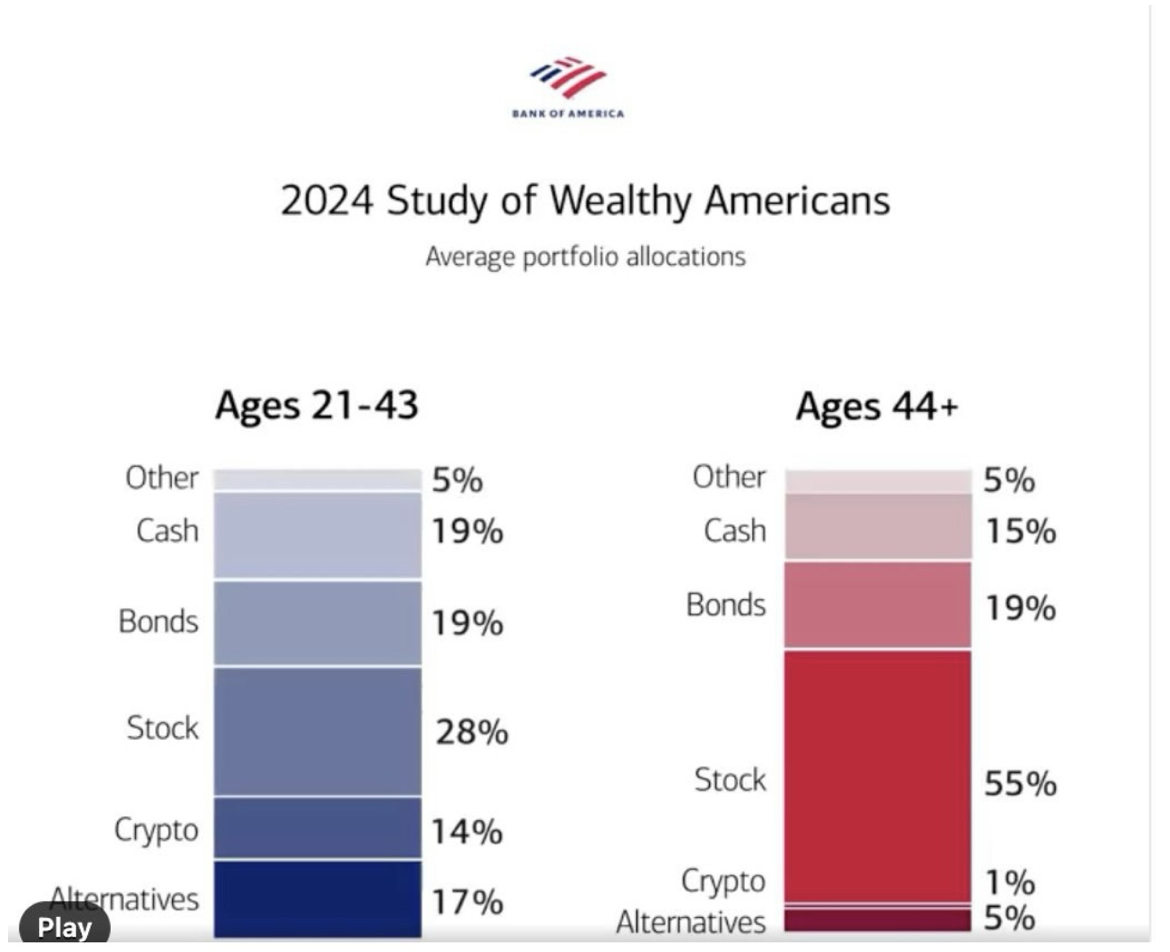
Alternatives represent investments in real estate, hedge funds, private equity, natural resources, and infrastructure.
SOMETHING TO THINK ABOUT

Cheers
Jacquie
