'We live in a nominal world right now. Inflation is going up modestly, so the dollars we are making are nominal dollars, not real dollars,' said legendary value investor, Leon Cooperman, of Omega Advisors.

'We live in a nominal world right now. Inflation is going up modestly, so the dollars we are making are nominal dollars, not real dollars,' said legendary value investor, Leon Cooperman, of Omega Advisors.
Featured Trades: (ELIOT WAVE'S GRIM MESSAGE), (SPX)
3) Eliot Wave's Grim Message. Regular readers are well aware that I rely on John Murphy and Arthur Hill at StockCharts .com for top drawer technical analysis of the financial markets. Lately they have been knocking the ball out of the park, pumping out indicators that global markets were topping and that risk was high, almost on a daily basis.
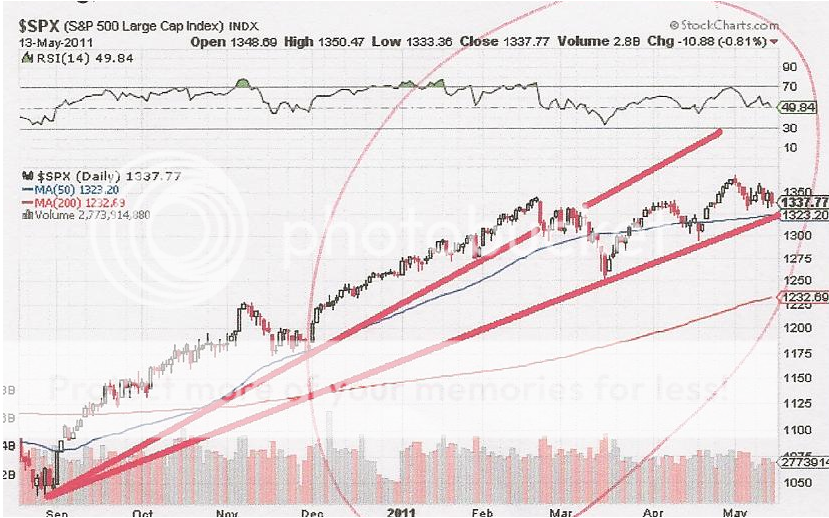
So I wanted to highlight a chart they prepared that applies a traditional Eliot Wave analysis to the S&P 500. Eliot Wave theory was first created by Ralph Nelson Elliot in the 1930's, and the modern day iteration is propagated by disciple, Robert Prector. In the simplest terms, Eliot Wave theory calls for bull markets with five up waves to be followed by bear markets with three down waves.
That makes the chart below particularly alarming. It shows that the bull market that began in August reached its wave 5 top on April 29 and is now has three down waves ahead of it. That means that the era of buying dips is behind us, and that the prudent thing to do from here is to sell every rally.
If you need more reasons to stay awake at night, then take a look at the next chart of stocks trading above their 50 day and 200 day moving averages. Those have both started to show a sharp decline, presaging a broader fall in the market.
Over the years I have noticed that the people who slavishly follow Eliot Wave, or any other technical program, get slaughtered. None of this takes into consideration the end of QE2, the expiring debt ceiling, or out plummeting economic growth. However, it can be a very useful tool when combined with the dozens of other that I use.
StockCharts.com provides one of the best value for money research products out there. They offer an impressive range of tools to all comer for free. A one year subscription to their 'ExtraRT' service products costs only $369 per year. This includes an interactive section where readers are permitted to post their own technical analysis. Some of them have attracted quite massive followings in their own right. You can visit their site at www.StockCharts.com .

-

-

-

Eliot Wave Has Multiple Alarm Bells Ringing
Featured Trades: (THEY'RE SHOOTING ALL THE GENERALS),
(GS), (AAPL), (FCX), (GOOG)
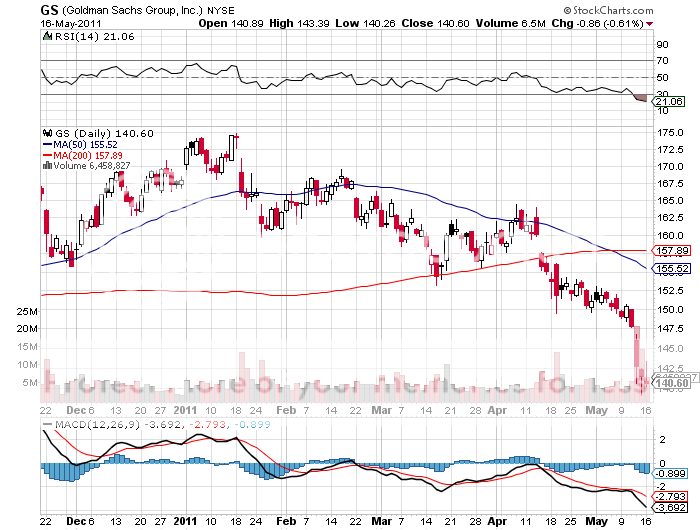
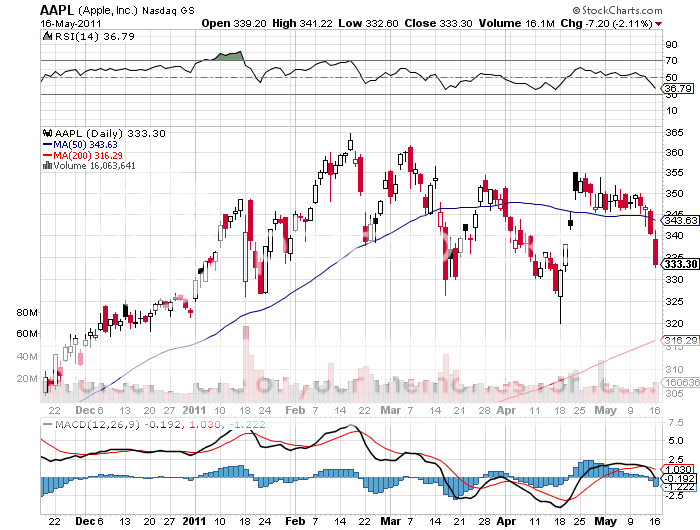
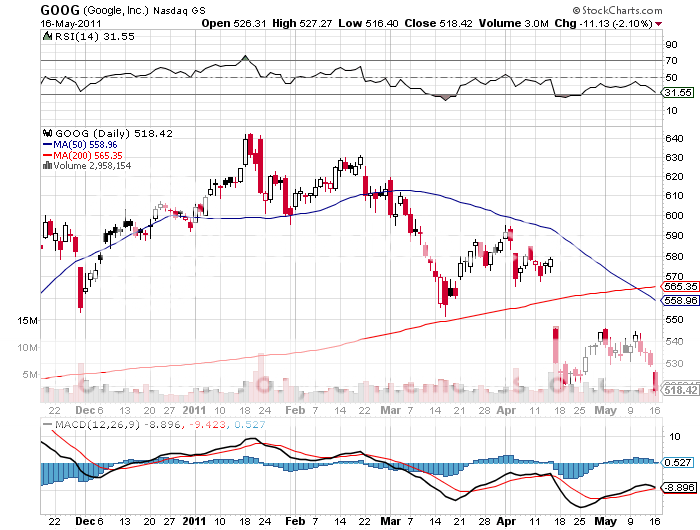
1) They're Shooting All the Generals. Those looking for guidance on the medium term trend in the market better take a look at the best of breed, benchmark stocks for the leading sectors; the companies traders call 'the generals'. I am talking about Goldman Sacks (GS), Apple (AAPL), Freeport McMoRan (FCX), and Google (GOOG). They are all telling us that the market peaked last February, not on April 29, as the indexes are suggesting.
When the charts for the stock prices of the best run companies in the most profitable industries are rolling over like the Bismarck, you know that it is time to bail out. That is why I have been a seller of rallies, not a buyer of dips for the past three months.
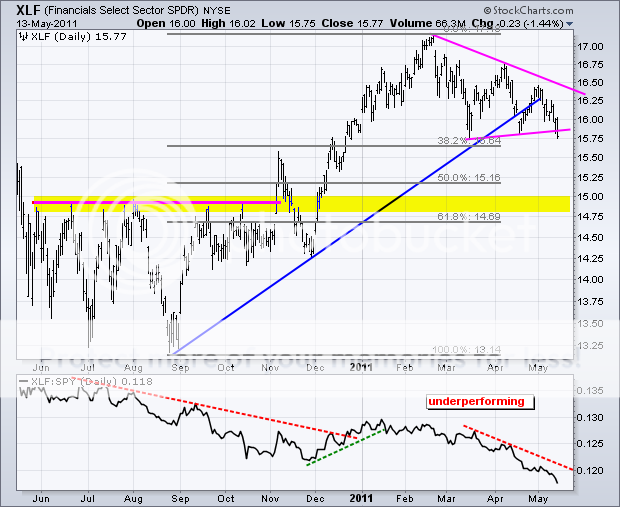
If you are one of those cynical, glass is half full, tough to convince investors, then take a look at the chart of the financials ETF (XLF). It also peaked in February and has been in a clear downtrend since. There is no way the S&P 500 can make progress when one of its heaviest sectors is suffering from Montezuma's revenge.
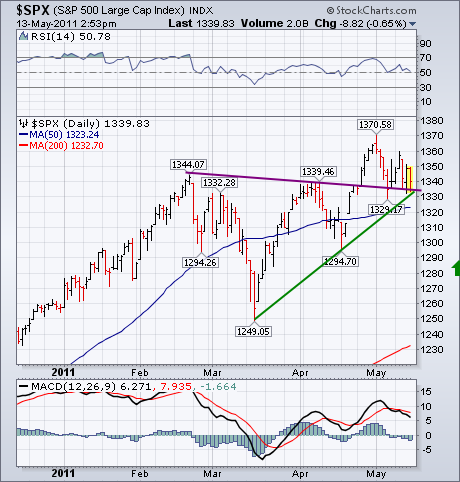
Still unconvinced? Check out the bottom chart of trend lines for the S&P 500, when I lifted from my friend, Dennis Gartman of The Gartman Letter. It indicates that we broke a steep trend line in February and are imminently about to break a much more shallow trend line this week.
The bottom line? The best case is that we are nearly three weeks into a 10% correction that will take us to the 200 day moving average for the (SPX) at 1,234; the worst case is that a new bear market has started. Look out below!
-
-
-
-
-

Featured Trades: (TAKING AIM AT SMALL CAPS)
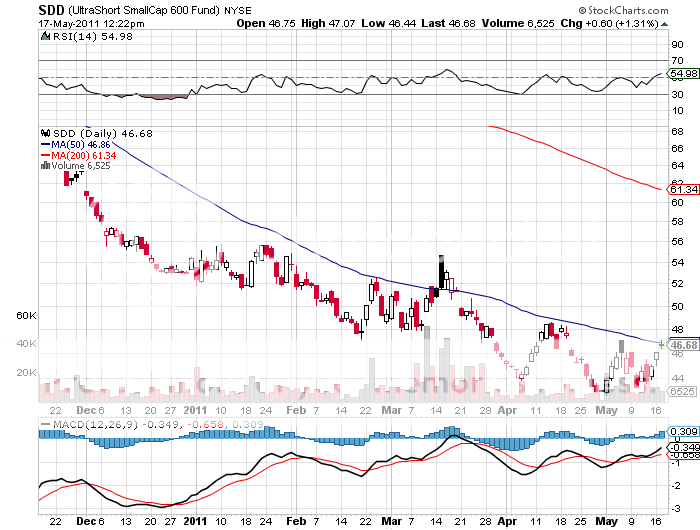
2) Taking Aim at the Small Caps. One of the cardinal rules of any hedge fund manager is to buy the cheapest assets in the world, and go short the most expensive assets against them. In a perfect world your longs go up, your shorts go down, and you make a bundle of money.
If we are seeing a slowdown in the US economy, be it temporary or permanent, then US small cap stocks have to be among the most richly priced assets out there. The big cap S&P 500 is currently selling at an historically middling 15 times earnings. That puts small caps selling at a 21 multiple in positively nosebleed territory. Small caps lacking serious assets or reserves are the most dependent on external financing and are the most sensitive to the short term economic cycle. In my book that makes them a short.
However, selling small cap stocks short is easier said than done. Good luck finding stock to borrow for your shorts, which are often illiquid and hard to find, They can be tightly held by a limited number of owners who just so happen to hate short sellers. Try selling their stock and they might even sue you.
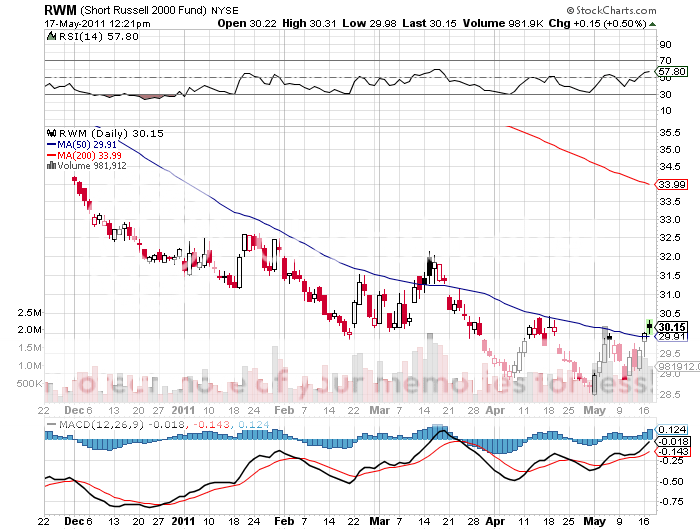
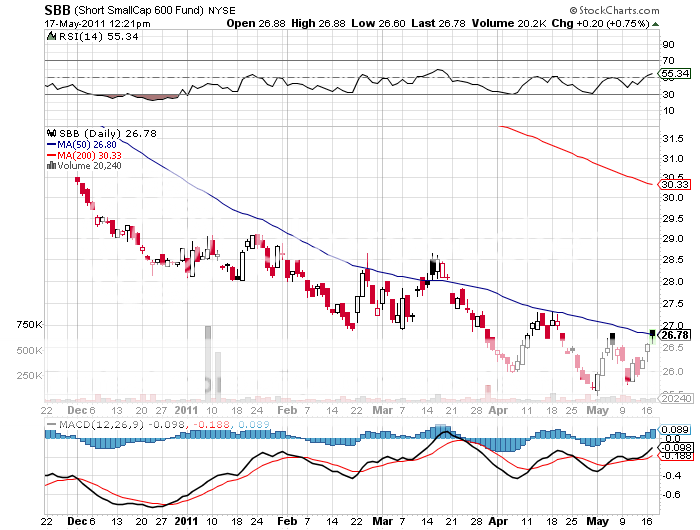
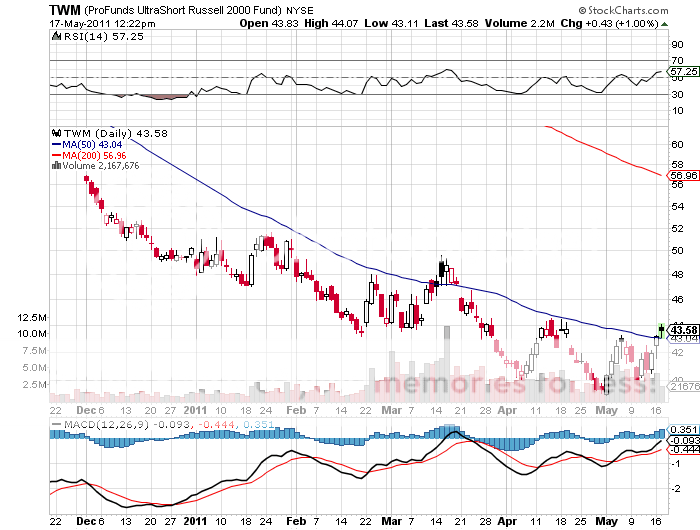
So it is wise to let someone else do the scut work here. ProShares has a range of alternative short bias ETF's here that lets them do the heavy lifting. The (RWM) offers a -1X short on the Russell 2000, while the (TWM) gives you a -2X exposure, a 200% short position against the sector. The (SBB) has a -1X short exposure to the Small Cap 600, while the (SDD) gives you a -2X short exposure.
If you really want an 'E ticket' ride, you can buy options on these funds, although the liquidity is not great and spreads are wide. The October, 2011 (RWM) $29 put, which is 4% out of the money, sells at a middle market of $1.50. This is not something that I would necessarily do today. Rather, hold it in reserve, and when you get a nice sharp counter trend rally, strap some of these babies on at much better prices.
-
-
-
-

Featured Trades: (CHEWING THE FAT WITH HARRY S. DENT)
2) Chewing the Fat With Harry S. Dent. Given the fresh dose of uncertainty besieging the markets these days, I thought I'd touch base with my pal, co-conspiring Eagle Scout, and fellow traveler, Harry S. Dent. Harry runs an independent research boutique, which has accurately predicted many of the major moves in financial markets during the past 25 years.
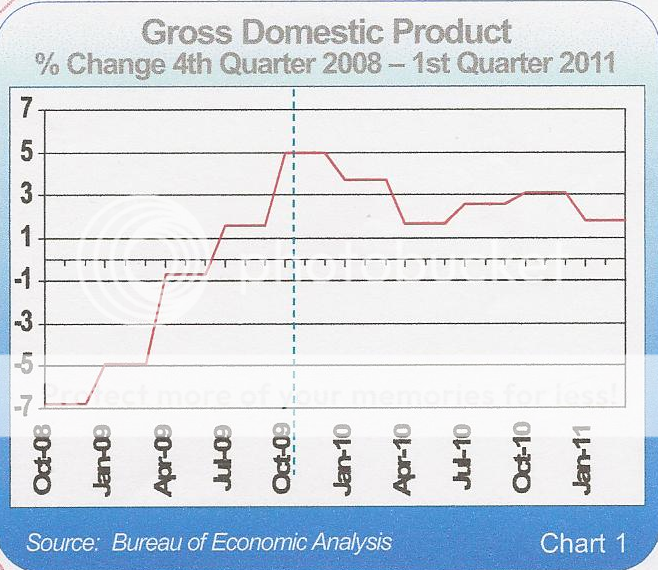
Harry believes that the economy is fizzling because QE2 had a smaller impact than QE1. The Federal Reserve's second monetary stimulus program generated only 2% in additional GDP growth, proof that it is fighting a losing battle. High oil and commodity prices will provide the coup de grace, forcing consumers to retrench further. We won't see this in the data for a couple of months. Once a more serious slowdown appears, Ben Bernanke may entertain a QE3, despite his indications to the contrary.
Residential real estate continues to provide a relentless drag on economic growth, and will worsen. Be happy you aren't trying to sell a house in Florida, where 18% of the homes are already vacant, compared to 16% in Arizona, and 14% in Nevada. Amazingly, some one third of the houses in Naples, Florida are empty.
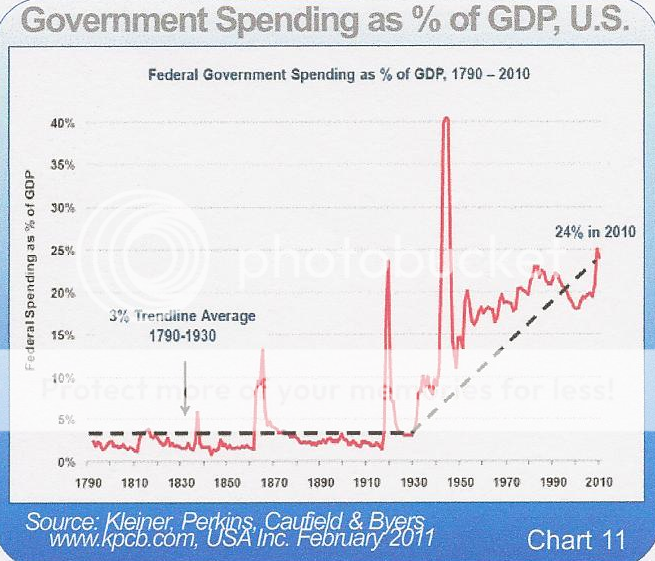
Growth of the national debt continues to be a major headache. Since the Great Depression, public spending has grown steadily, from supporting small town 'Mayberry' to the equivalent of a New York City. While much of the early deficit explosion resulted from WWII and Vietnam, all of the recent growth has come from entitlements, like Medicare and Social Security. Government estimates of $46 trillion in unfunded liabilities are wildly inaccurate, with $70 trillion closer to reality.
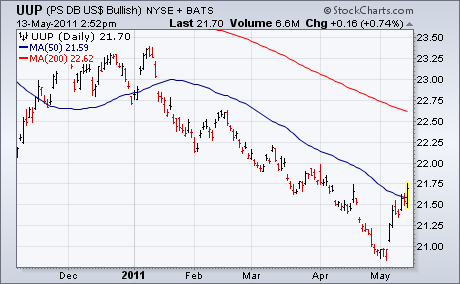
Harry's advice to investors is to use any strength in coming months to unload stocks. He would sell all remaining holdings in gold and silver. He also wants to dump oil and other energy plays. And he believes we are about to enter a prolonged period of dollar strength. His favorite vehicle for the greenback is the ETF (UUP), which offers investors a long position against a basket of foreign currencies.
Harry is a native of South Carolina, who like Federal Reserve governor Ben Bernanke, improbably went off to Harvard where he got his MBA. His career then took him to the top notch management consulting firm, Bain & Co. After years of consulting with Fortune 100 companies, he found gaping holes in their understanding of the global economy. That spurred him to take off and create his own research boutique to address these grievous shortfalls in understanding.
To learn more about Harry S. Dent, please go to his website at http://www.meetharrydent.com/
-
-
-

Featured Trades: (AIRLINES STOCKS ARE CLEARED FOR TAKEOFF)
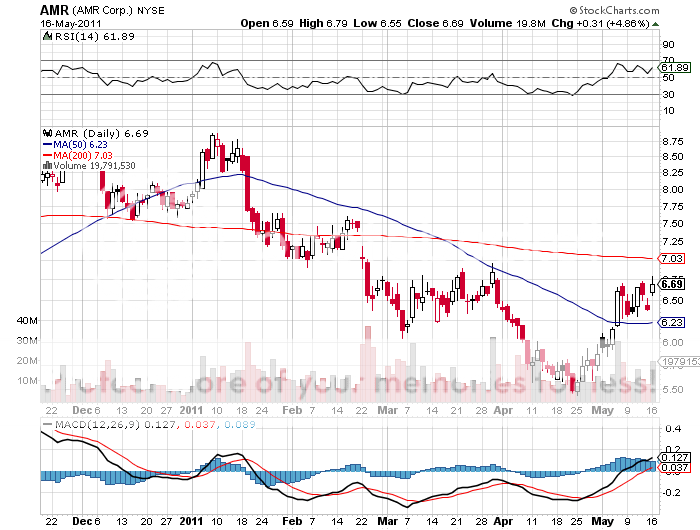
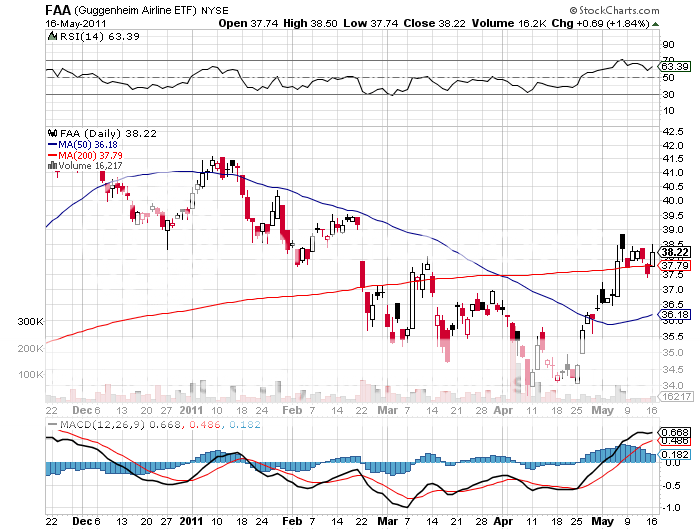
3) Airline Stocks Are Cleared for Takeoff. The checklist is complete, the IFR clearance is in hand, and it is now time to push the throttles to the firewall for the airline stocks. I almost never remind readers of past trade recommendations which came good, but this time I think I'll make a rare exception.
I recommended airline stocks six weeks ago as a cheap undated put on the price of oil in my piece 'Airline Stocks Could be Ready for Takeoff' (click here for the link) . Since the April peak in oil at $115, airline stocks have been on an absolute tear, while the rest of the stock market has been plummeting to the ground in a death spiral. My pick in the sector, legacy carrier American Airlines (AMR) has roared ahead by a heady 20%.
What is amazing is the industry's robust performance, compared to the last oil spike three years ago. Airlines have undergone one of the most rapid, and painful restructurings in American industrial history. When oil was last at these triple digit prices, it was hemorrhaging red ink. Today it is largely profitable. The $20 price drop we have seen in the past three weeks has added a further $3.5 billion in profits.
I am generally loathe to own stocks here. Airlines have already had their bear market. Use further spikes in the price of crude to add to your long positions through stock or the airline sector ETF (FAA). And no, I am not getting free frequent flier points for writing this piece, but I'll take an upgrade and some free pretzels if offered.
-
-

Up, Up, and Away!
'The investment theme over the last several weeks has changed from 'go global' to 'stay home,' said Ed Yardeni, president of Yardeni Research.

Featured Trades: (THE MARKETS ARE ON A KNIFE EDGE)
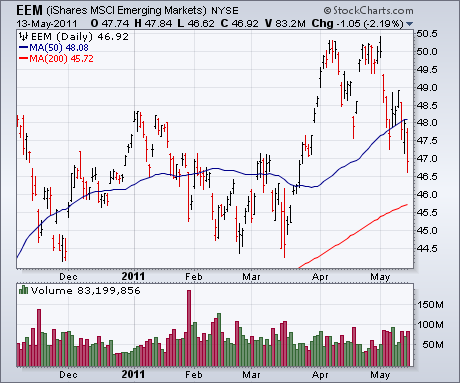
1) The Markets Are On a Knife Edge. All global asset classes are within a hair's breadth of completely breaking down.
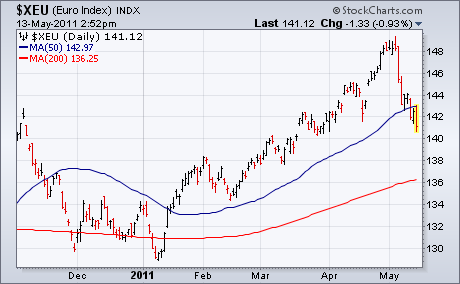
The S&P 500 sits perilously on its neckline. Just below here there are a ton of sell stops that could pare 5% off the index very rapidly. The more volatile and leading emerging market ETF (EEM) has already broken this key level. Look also at the euro, which has been marching in almost complete lockstep with stocks. It has crashed through the 50 day moving average, and has so far struggled unsuccessfully to recover it. The flip side of all of this is the (UUP), a dollar long against a basket of currencies, which appears to have entered new bull market territory.
What positive surprise is out there that could possibly hold things out there for a few more weeks or months? I can't think of one. What surprise negative is out there that could cause the whole house of cards to collapse. I can think of a dozen. Only Ben Bernanke has the power to stick his finger in the dyke, and right now he is keeping his hands in his pocket.
-
-
-
-
Ben, Where are You?
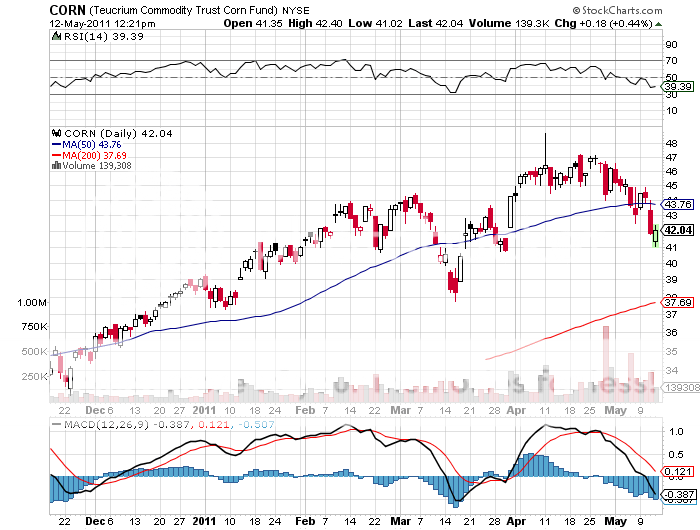
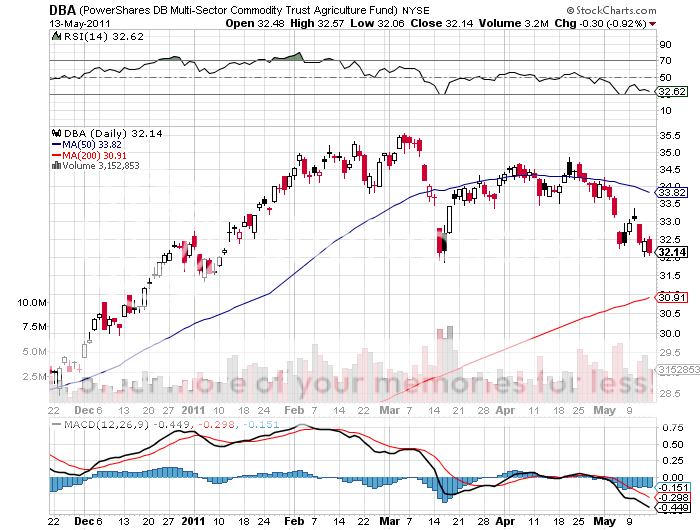
Featured Trades: (THE CORN CONUNDRUM), (JJG), (DBA), (CORN)
2) The Corn Conundrum. In the days of olde, the prices of agricultural commodities were determined by the birds, the bees, and Mother Nature. No more.
The Mississippi River basin is suffering once in a century floods, thousands of acres of farmland have been destroyed, and those still in operation are far behind schedule in their spring plantings. Private analysts are predicting a substantial fall in yields this year. Drought in Texas means they may lose half their wheat crop. China has flipped from a net exporter of food to a large net importer for the first time in many years. So prices for corn, wheat, and soybeans should be absolutely going through the roof right now. Right?
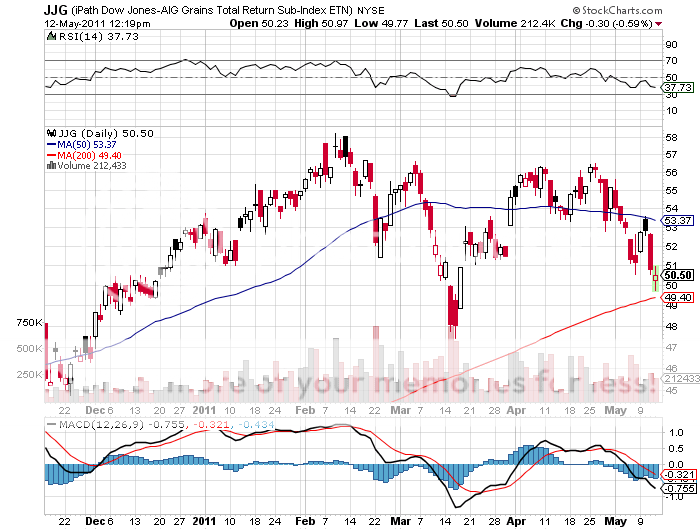
Wrong. Take a look at the charts below for the grain ETF (JJG), the agricultural ETF (DBA), and the fund for corn (CORN), and it is clear that they all peaked at the end of April, right when oil, the euro, gold, silver, stocks, and other commodities began to sell off in earnest. The harsh reality is that food has become just another asset class to be flailed mercilessly by high frequency traders and momentum driven hedge funds. And with the world now in 'RISK OFF' mode that means the ags go down with everything else, big time.
This is only a temporary state of affairs. The basic fact is that the world is still making people faster than the food to feed them. The long term fundamentals for food are in fact getting worse at an ever accelerating rate. Has anyone mentioned? that the world is running out of fresh water with which to irrigate?
So once the hot money has had its way on the downside, they will reverse and pile back in on the long side. Bring an end to the 'RISK OFF' trade, and the ags will be one of the first sectors that you will want to buy.
-
-
-

Still Looking for the 'BUY' Signals for the Ags
'The speculative fever seems to have broken. The old adage that the best cure for high commodity prices is high commodity prices is working,' said Ed Yardeni, president of Yardeni Research.