As a potentially profitable opportunity presents itself, John will send you an alert with specific trade information as to what should be bought, when to buy it, and at what price. This is your chance to ?look over? John Thomas? shoulder as he gives you unparalleled insight on major world financial trends BEFORE they happen. Read more
As a potentially profitable opportunity presents itself, John will send you an alert with specific trade information as to what should be bought, when to buy it, and at what price. Read more
Global Market Comments
September 3, 2015
Fiat Lux
Featured Trade:
(WILL THE MARKETS BOTTOM TOMORROW?),
(SPY), (IWM), (QQQ), (VIX), (XIV),
(THE GREAT SOCIAL SECURITY MARRIAGE BENEFIT YOU?VE NEVER HEARD OF)
SPDR S&P 500 ETF (SPY)
iShares Russell 2000 (IWM)
PowerShares QQQ Trust, Series 1 (QQQ)
VOLATILITY S&P 500 (^VIX)
VelocityShares Daily Inverse VIX ST ETN (XIV)

Let the healing process begin!
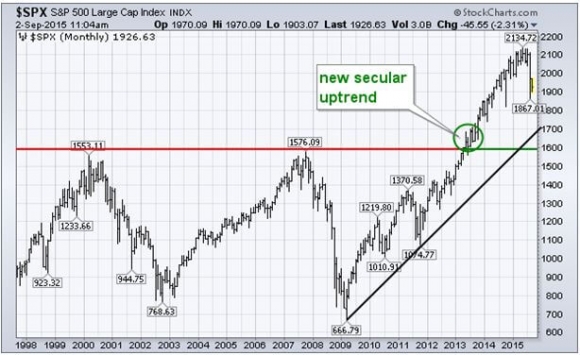
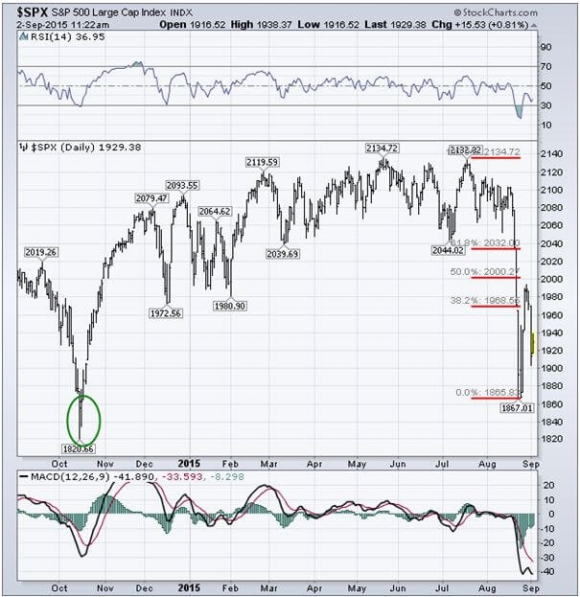
Having just barely missed tickling a new all time high in early August at $214, then tagging a cataclysmic low at $186 on August 24, the market has defined the range that it will settle into for the next 4-6 weeks.
What then follows are a series of lower highs and higher lows to create a rightward pointing apex of a triangle on the charts. This also will cause volatility (VIX) to bleed off substantially.
This scenario leads to a final upside breakout in October. You can bet the ranch on that.
Yesterday?s successful test of the low end of the range only gives further credence to this analysis.
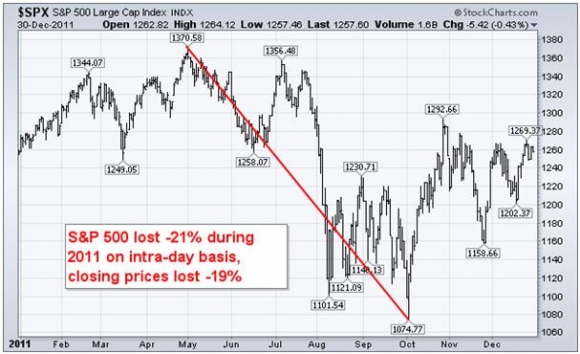
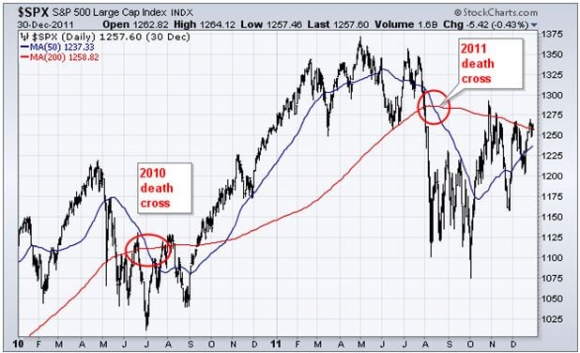
To prove that history not only repeats itself, it hums, whistles, and rhymes, look at the charts below for the last major low in 2011 so eloquently produced by my friends at Stockcharts.com.
Expect an encore of this performance.
I am not so confident of this prediction because I am cocksure, presumptuous, or full of hubris.
Ever the mathematician (with many thanks to John Nash, Fisher Black, Myron Scholes, and Edward Lorenz), I simply point to the numbers 3.7, 5.3, 18, 10, 40, 15, 13.5.
What, you don?t recognize these digits? Pshaaaw! They should be at the tip of your tongue.
Let me inform you.
3.7% was the blistering US Q2 GDP growth.
5.3% is the latest headline unemployment rate, a decade high.
18 million is annual sales rate the American auto industry headed for.
10 is the number of years since we have seen new housing starts that were this hot.
$40 a barrel means the global energy tax cut is increasing.
15 was the 2015 S&P 500 earnings multiple at the August $186 low.
13.5 was the 2016 S&P 500 earnings multiple at the August $186 low.
What all of these mean is that the summer swoon in share prices is purely a stock market only event. It is not at all justified by the hard data spewing out of the economy, which is strengthening by the day.
Markets behave rationally most of the time, moving based on their underlying fundamentals. But occasionally they go crazy, and emotion, superstition, and folk economics take over.
This is one of those crazy times.
And like any errant child who suddenly throws a temper tantrum at the shopping mall, the best thing to do is ignore it.
If you embarked on the Queen Mary 2 100 day Around the World cruise in early August, as many of my readers are prone to do, thanks to my many postings from the fabulous Cunard ship, and didn?t come home until November, I doubt they would find any change in share prices.
They would think it was just another boring autumn.
I am sorry to have to delve into the mumbo jumbo of all these technicals after spending nearly a decade training you that fundamentals rule all.
But in insane conditions like these, technicals take the lead.
You can see this in how the indexes perfectly test, pivot, and reverse around key Fibonacci numbers (click here for ?My Old Pal, Leonardo Fibonacci).
So if you are a long-term investor, just turn off your TV, send all that dubious stock research to your spam folder, and take the above mentioned cruise.
In the long-term scheme of things, the current market sturm und drang will amount to absolutely nothing.
If you?re a short-term trader, keep you head low and you positions small, as I have done. Live to fight another day.
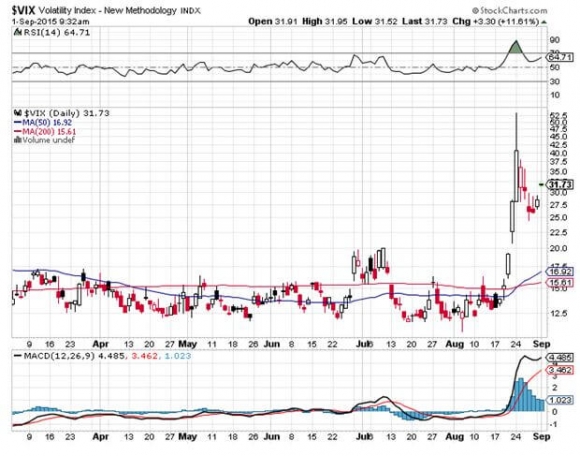
It also might be a good time to sell short volatility (VIX), (XIV), which I did on Tuesday.
After a few heart stopping hours, the (VIX) has plunged from $32 to $27, and I am already well in the money.
 It?s a Great Time to Take a Long Cruise

While the Diary of a Mad Hedge Fund Trader focuses on investment over a one week to six-month time frame, Mad Day Trader, provided by Bill Davis, will exploit money-making opportunities over a brief ten minute to three day window. It is ideally suited for day traders, but can also be used by long-term investors to improve market timing for entry and exit points. Read more
Global Market Comments
September 2, 2015
Fiat Lux
Featured Trade:
(BETTING ON FALLING VOLATILITY),
(SPY), (XIV), (SVXY), (VIX), (VXX),
(THE BLOCKBUSTER READ IN THE HEDGE FUND COMMUNITY)
SPDR S&P 500 ETF (SPY)
VelocityShares Daily Inverse VIX ST ETN (XIV)
ProShares Short VIX Short-Term Futures (SVXY)
VOLATILITY S&P 500 (^VIX)
iPath S&P 500 VIX ST Futures ETN (VXX)

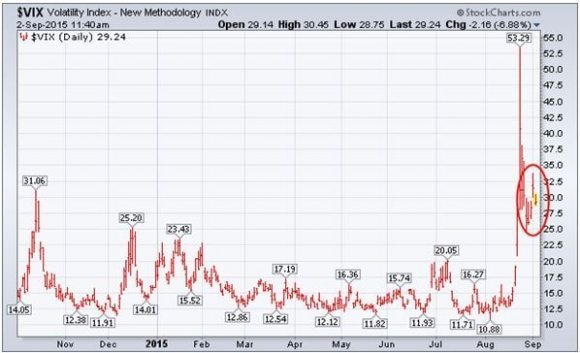
I?m betting that sometime in my life, the Volatility Index (VIX) will trade below today?s $31. In fact, I expect it to trade back to the mid teens within the next two months.
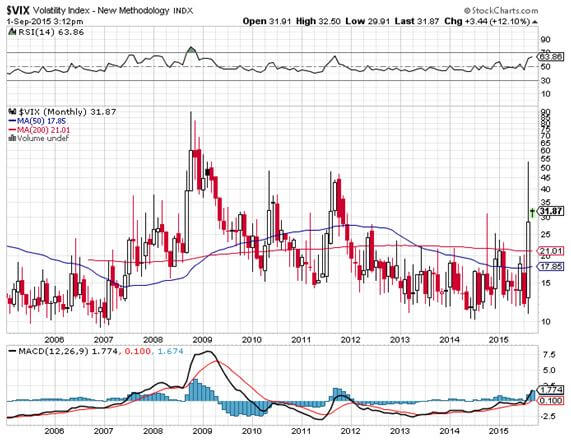
After spending years stuck in the $12-$15 range, it is nothing less than mind blowing to see it spike up to $31 this morning.
However, it hit $53 at the opening of the August 24 flash crash, albeit briefly. And we rocketed all the way up to an eye popping $89 at the bottom of the 2008-2009 crash.
I am not calling the bottom of the stock market here, nor a top in volatility. Those could be days, weeks, or even months away.
What I am saying is that I expect the (VIX) to return to the mid teens by November 1, when stocks begin a six month period of seasonal strength.
When the bottom does come, you will see it in one of those screaming, up 400-point market openings that are impossible to get into.
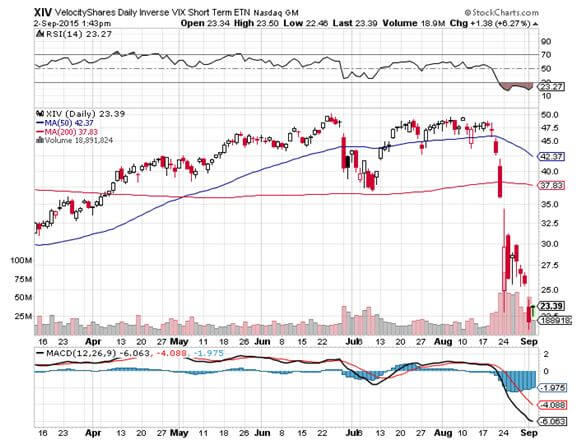
That?s why I?m buying the Velocity Shares Daily Inverse VIX Short Term ETN (XIV) now. You may have to take some heat for the short term, but it will be richly rewarding for the long term.
To make it easy, I am avoiding the 2X and 3X short volatility ETN?s out there, as well as the options market. That way, you don?t have to fight against the clock.
Get the (VIX) back to the mid teens, and the (XIV) should double in value.
If I?m wrong, and the (VIX) stabilizes in the low twenties, where it lived from 2009-2011, then I?ll only be half wrong, and the (XIV) will strap on a mere 50%.
I?m sure you?ll take that gift all day long.
This is a rare opportunity for you to join almost every trader in Chicago on the short side in the (VIX) trade. You have just been adopted by a new rich uncle.
This is because the natural state is for volatility to fall, which it spends 90% of the year doing. The current 30-day historic volatility for the S&P 500 is only 23%, and includes the horrific 1,100 down day we saw on August 24th.
The CBOE Volatility Index (VIX) is a measure of the implied volatility of the S&P 500 stock index.
You may know of this from the many clueless talking heads, beginners, and newbies who call this the ?Fear Index?.
Long-term followers of my Trade Alert Service profited handsomely after I urged them to sell short this index three years ago with the heady altitude of 47%. We kept rolling positions down all the way down to the $11 handle.
For those of you who have a PhD in higher mathematics from MIT, the (VIX) is simply a weighted blend of prices for a range of options on the S&P 500 index.
The formula uses a kernel-smoothed estimator that takes as inputs the current market prices for all out-of-the-money calls and puts for the front month and second month expirations.
The (VIX) is the square root of the par variance swap rate for a 30 day term initiated today.
To get into the pricing of the individual options, please go look up your handy dandy and ever useful Black-Scholes equation. You will recall that this is the equation that derives from the Brownian motion of heat transference in metals.
Got all that?
For the rest of you who do not possess a PhD in higher mathematics from MIT, and maybe scored a 450 on your math SAT test, or who don?t know what an SAT test is, this is what you need to know.
When the market goes up, the (VIX) goes down. When the market goes down, the (VIX) goes up. End of story.
Class dismissed.
The (VIX) is expressed in terms of the annualized movement in the S&P 500, which today is at 1,800. So a (VIX) of $14 means that the market expects the index to move 4.0%, or 72 S&P 500 points, over the next 30 days.
You get this by calculating $14/3.46 = 4.0%, where the square root of 12 months is 3.46. The volatility index doesn?t really care which way the stock index moves. If the S&P 500 moves more than the projected 4.0%, you make a profit on your long (VIX) positions.
Probability statistics suggest that there is a 68% chance (one standard deviation) that the next monthly market move will stay within the 4.0% range.
I am going into this detail because I always get a million questions whenever I raise this subject with volatility-deprived investors.
It gets better. Futures contracts began trading on the (VIX) in 2004, and options on the futures since 2006.
Since then, these instruments have provided a vital means through which hedge funds control risk in their portfolios, thus providing the ?hedge? in hedge fund.
Buying (VIX) is the only way the vast majority of traditional long only mutual funds can profit in falling markets. This is why the (VIX) gets temporarily bid up to such insane levels.
Their error is your gain.
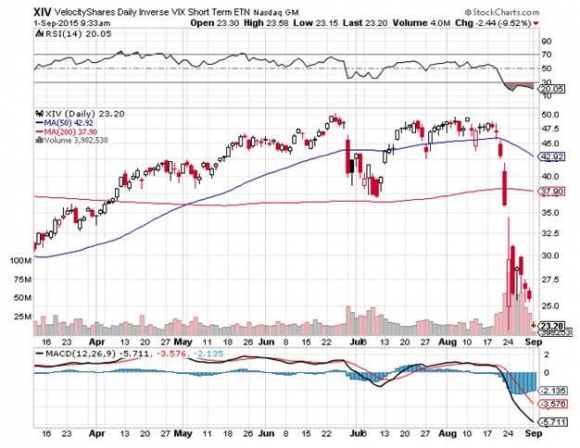
Therefore, if you sell short the (VIX) here at $31 via the (XIV) you are picking up a derivative at a nice artificially overbought level.
Only prolonged, ?buy and hold? bull markets see volatility stay under $14 for any appreciable amount of time.
That?s probably what were still in, once the world gets it head screwed on right again and current bout of volatility subsides.
For a detailed description of this 1X short volatility ETN please click here for the issuer?s website at http://www.velocitysharesetns.com/xiv.
![Pogo Stick]() I Bet the Next Move is Down
I Bet the Next Move is Down

As a potentially profitable opportunity presents itself, John will send you an alert with specific trade information as to what should be bought, when to buy it, and at what price. Read more
As a potentially profitable opportunity presents itself, John will send you an alert with specific trade information as to what should be bought, when to buy it, and at what price. This is your chance to ?look over? John Thomas? shoulder as he gives you unparalleled insight on major world financial trends BEFORE they happen. Read more
As a potentially profitable opportunity presents itself, John will send you an alert with specific trade information as to what should be bought, when to buy it, and at what price. Read more