August has been our biggest positive month in a year for subscribers to the Diary of a Mad Hedge Fund Trader, gaining more than 7%. During September, 2015, I brought in a ballistic 11.99% for investors.
My 69 month performance hit 205% at the Friday close, a new all time high.
More on that tomorrow.
In the meantime, the new Fed policy has suddenly become crystal clear.
At the Jackson Hole confab Chairwoman Janet Yellen said that ?The case for a rate hike has strengthened,? but then laid out a list of qualifications and conditions as long as her very short arm.
Stocks rocketed.
An hour latter, vice chairman Stanley Fischer then opined that there might not only be one rate hike this year, BUT TWO.
Stocks tanked.
So here is the new Fed policy in a nutshell: Evolve from changing their mind from every day to EVERY HOUR!
Think of it as the Twitter version of a central bank.
If those who built the Internet 30 years ago had only known, they would have deliberately short-circuited their IBM mainframes.
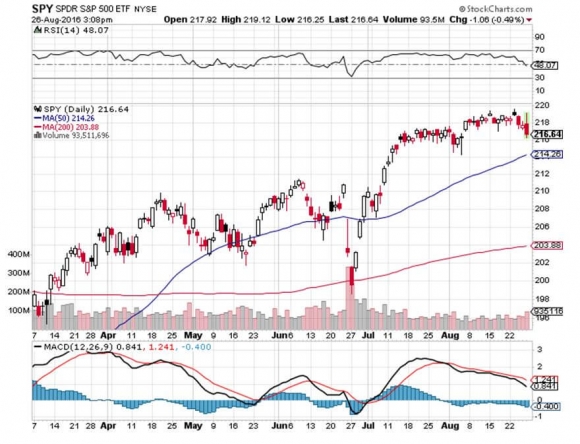
The net net of all of this is that the intraday range for the (SPY) came in at 2.6 points, the first time it has exceeded 1% in 1 ? months.
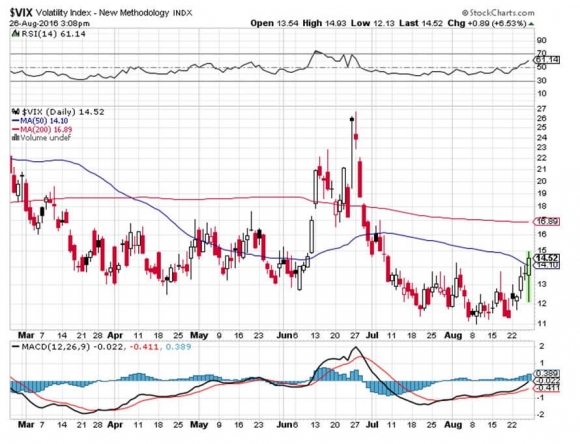
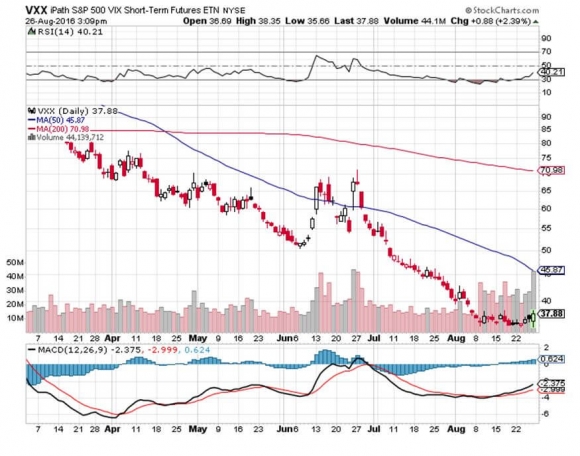
I bobbed and weaved as is demanded by the markets these days. I used the $15 point rally in the (SPX) to buy the Volatility Index (VIX) through the (VXX). The (VIX) then soared by some 20% in the next 60 minutes.
It was one of the most rapid profits I have booked in my entire half century long career.
I then used the $15 dip that followed to take profits on my existing short position in the (SPY).
All in all it was a pretty good day, except that I learned the Oakland Raiders, whose stadium I can see from my office, might move to Las Vegas. It?s something about the neighborhood.
Most individual traders have a horrendous experience trading the (VIX). Time decay eats them alive.
However, by going with a call spread structure you nearly neutralize this problem. Suddenly, time decay and contango become your friends.
What my former Berkeley economics professor has done is set the stage for another three weeks of tedious, boring, sideways market action into the Fed?s September 20-21 Open Market Committee Meeting to see if she actually does it.
Worst case, the (VIX) continues to bounce around this level. Best case, it gently rises into the meeting. Either one is a ?win? for this (VXX) position.
With Janet?s Jackson Hole speech, the preeminent market-moving event of the month is now behind us.
The next one will be the August Nonfarm Payroll released on Friday, September 1, and the big Fed interest rate decision on September 20-21.
It all sets up a nice yawn going into the September 2-5 Labor Day weekend. There should be no major breakouts, or breakdowns.
On Monday, August 29 at 10:30 AM EST, the Dallas Fed Manufacturing Survey should see some gains.
Tuesday, August 30 will be a big day. That?s when we receive an update on the S&P Case-Shiller Home Price Index. Extreme home shortages is the key, high growth markets should keep the numbers rising.
On Wednesday, August 31 at 10:00 AM we see Pending Home Sales, which are moving from strength to strength. We also get no less than three Fed speakers that day, further adding to our monetary confusion.
On Thursday, September 1 at 8:30 AM EST the Weekly Jobless Claims should confirm that employment remains at four decade highs. We will also get the PMI Manufacturing Index at 9:45.
Friday, September 2 should be a snore, with nothing major happening ahead of a three day weekend heralding the end of summer.
We wind up with the Baker HughesRig Count on Friday at 1:00 PM EST. Worryingly, the trend has been up for the past two months, driving oil prices lower.
More on that tomorrow.
Learning How to Dance the Contango
https://www.madhedgefundtrader.com/wp-content/uploads/2016/08/Couple-Dancing-the-Tango-e1472264863262.jpg267400DougDhttps://madhedgefundtrader.com/wp-content/uploads/2019/05/cropped-mad-hedge-logo-transparent-192x192_f9578834168ba24df3eb53916a12c882.pngDougD2016-08-29 01:07:572016-08-29 01:07:57What?s On Your Plate for This Week?
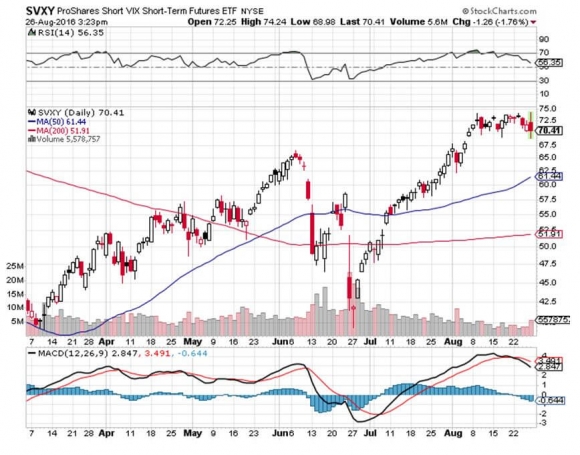
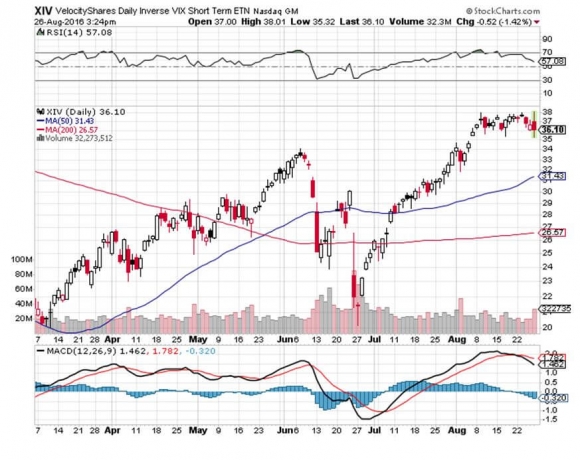
Well, I certainly earned my crust of bread last week.
After buying the Volatility Index at the Friday lows, it rocketed by an incredible 25%.
If I continue to be right, you want to use every subsequent (VIX) dip to go long.
I am one of those cheapskates who buys Christmas ornaments by the bucket load from Costco in January for ten cents on the dollar, because my eleven month theoretical return on capital comes close to 1,000%.
I also like buying flood insurance in the middle of the summer drought, when the forecast in California is for endless days of sunshine.
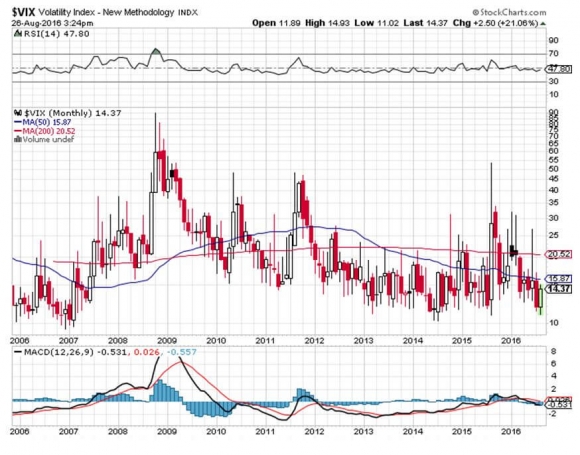
That is what we are facing now with the volatility index (VIX) where premiums probed such rock bottom prices.
Yikes!
?Get this one right, and the profits you can realize are spectacular.
It gets better. If the bottom in volatility exactly coincides with the peak in the stock market that it measures, volatility could be headed back up to the 20 handle, and maybe more.
I double dare you to look at the charts below and tell me this isn?t happening.
Watch carefully for other confirming trends to affirm this trade is unfolding. Those would include a strong dollar, falling stocks, plunging oil, and a weak Yen, Euro, and fixed income instruments of any kind.
Notice that every one of these is happening this week!
Reversion to the mean, anyone?
You may know of this from the many clueless talking heads, beginners, and newbies who call (VIX) the ?Fear Index?.
Long-term subscribers to? my Trade Alert Service profited handsomely after I urged them to sell short this index three times since January. Shorting every spike up has worked like a charm.
For those of you who have a PhD in higher mathematics from MIT, the (VIX) is simply a weighted blend of prices for a range of options on the S&P 500 index.
The formula uses a kernel-smoothed estimator that takes as inputs the current market prices for all out-of-the-money calls and puts for the front month and second month expirations.
The (VIX) is the square root of the par variance swap rate for a 30 day term initiated today. To get into the pricing of the individual options, please go look up your handy dandy and ever useful Black-Scholes equation.
You will recall that this is the equation that derives from the Brownian motion of heat transference in metals. Got all that?
For the rest of you who do not possess a PhD in higher mathematics from MIT, and maybe scored a 450 on your math SAT test, or who don?t know what an SAT test is, this is what you need to know.
When the market goes up, the (VIX) goes down. When the market goes down, the (VIX) goes up. Period. End of story. Class dismissed.
The (VIX) is expressed in terms of the annualized movement in the S&P 500, which today is at $2,163.
So for example, a (VIX) of $14 means that the market expects the index to move 4.0%, or 72 S&P 500 points, over the next 30 days.
You get this by calculating $14/3.46 = 4.0%, where the square root of 12 months is 3.46.
The volatility index doesn?t really care which way the stock index moves. If the S&P 500 moves more than the projected 4.0%, you make a profit on your long (VIX) positions.
Probability statistics suggest that there is a 68% chance (one standard deviation) that the next monthly market move will stay within the 4.0% range.
I am going into this detail because I always get a million questions whenever I raise this subject with volatility-deprived investors.
It gets better. Futures contracts began trading on the (VIX) in 2004, and options on the futures since 2006.
Since then, these instruments have provided a vital means through which hedge funds control risk in their portfolios, thus providing the ?hedge? in hedge fund.
If you make money on your (VIX) trade, it will offset losses on other long positions. This is how the big funds most commonly use it.
No one who buys fire insurance ever complains when their house doesn?t burn down.
Make Volatility Your Friend Not Your Enemy
https://www.madhedgefundtrader.com/wp-content/uploads/2016/07/Woman-Swimming-with-Tiger-e1469129086631.jpg260400DougDhttps://madhedgefundtrader.com/wp-content/uploads/2019/05/cropped-mad-hedge-logo-transparent-192x192_f9578834168ba24df3eb53916a12c882.pngDougD2016-08-29 01:06:422016-08-29 01:06:42The Volatility Bottom is In
While the Diary of a Mad Hedge Fund Trader focuses on investment over a one week to six-month time frame, Mad Day Trader, provided by Bill Davis, will exploit money-making opportunities over a brief ten minute to three day window. It is ideally suited for day traders, but can also be used by long-term investors to improve market timing for entry and exit points. Read more
As a potentially profitable opportunity presents itself, John will send you an alert with specific trade information as to what should be bought, when to buy it, and at what price. This is your chance to ?look over? John Thomas? shoulder as he gives you unparalleled insight on major world financial trends BEFORE they happen.Read more
https://www.madhedgefundtrader.com/wp-content/uploads/2011/10/slider-05-trader-alert.jpg316600DougDhttps://madhedgefundtrader.com/wp-content/uploads/2019/05/cropped-mad-hedge-logo-transparent-192x192_f9578834168ba24df3eb53916a12c882.pngDougD2016-08-26 13:02:512016-08-26 13:02:51Trade Alert (SPY) - August 26, 2016
As a potentially profitable opportunity presents itself, John will send you an alert with specific trade information as to what should be bought, when to buy it, and at what price.Read more
https://www.madhedgefundtrader.com/wp-content/uploads/2016/02/Alert-e1457452190575.jpg135150DougDhttps://madhedgefundtrader.com/wp-content/uploads/2019/05/cropped-mad-hedge-logo-transparent-192x192_f9578834168ba24df3eb53916a12c882.pngDougD2016-08-26 11:34:492016-08-26 11:34:49Trade Alert (VXX) - August 26, 2016
While the Diary of a Mad Hedge Fund Trader focuses on investment over a one week to six-month time frame, Mad Day Trader, provided by Bill Davis, will exploit money-making opportunities over a brief ten minute to three day window. It is ideally suited for day traders, but can also be used by long-term investors to improve market timing for entry and exit points. Read more
https://madhedgefundtrader.com/wp-content/uploads/2019/05/cropped-mad-hedge-logo-transparent-192x192_f9578834168ba24df3eb53916a12c882.png00DougDhttps://madhedgefundtrader.com/wp-content/uploads/2019/05/cropped-mad-hedge-logo-transparent-192x192_f9578834168ba24df3eb53916a12c882.pngDougD2016-08-26 09:20:132016-08-26 09:20:13August 26, 2016 - MDT Pro Tips A.M.
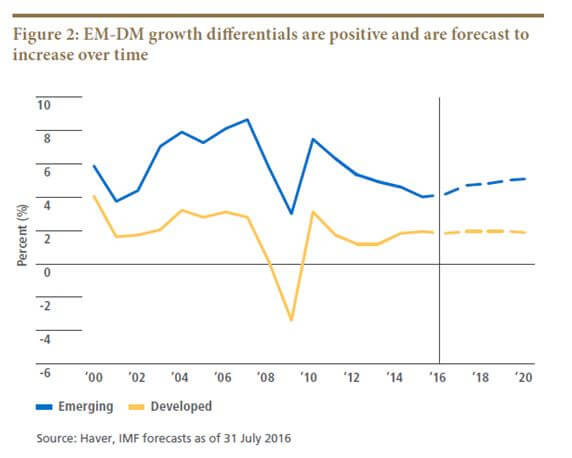
Boy, did we have a great run in emerging markets during the 2000s!
A global commodity boom caused many of these markets to rise tenfold or more.
Go back to the earliest newsletters published by the Diary of a Mad Hedge Fund Trader in 2008, and you will find them chock full of recommendations to buy hard assets, emerging market ETFs, debt, and currencies.
As former colonies, many of these countries still base their economies on production of the precious and base metals, energy, and foodstuffs they once supplied the motherland.
And as a former correspondent for The Economist magazine covering this territory, I knew them well.
Then in 2011, the party abruptly ended, and a vicious five-year bear market ensued.
Oil peaked first, eventually nosediving some 82.5%, from $149 to $26.
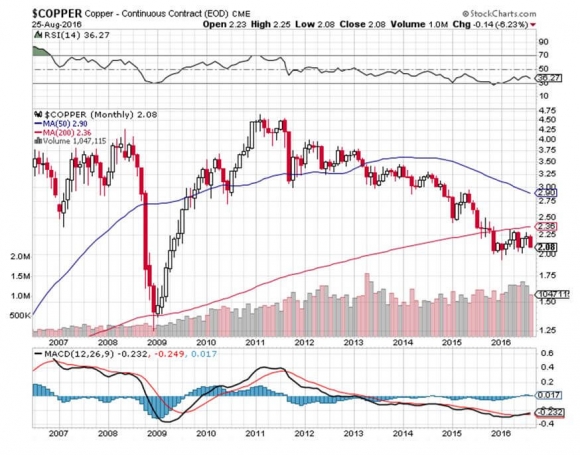
Remember Dr. Copper, the only commodity with a PhD in economics? He gave up 57.9%.
And gold, that ultimate store of value for Armageddonists and conspiracy theorists everywhere? It plunged by 48.2%.
There are still a lot of unhappy American gold eagles sitting in bank deposit boxes around the country gathering dust, thanks to those ridiculous theories.
It didn?t help that a raging bull market in developed market government bonds sucked even more money out of these beleaguered countries.
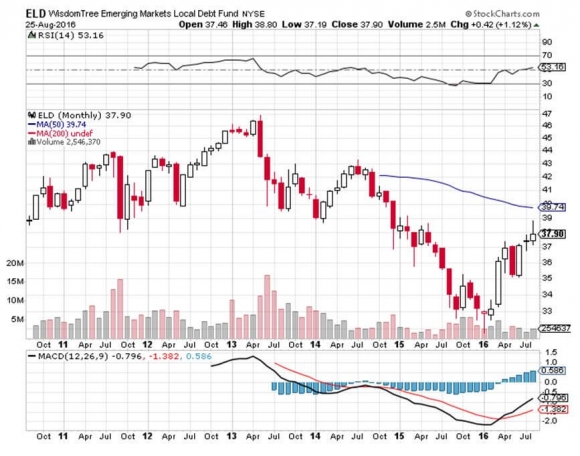
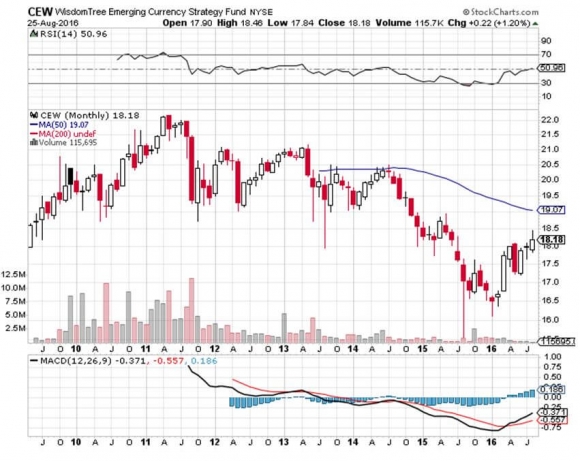
The Emerging market debt ETF (ELD), collapsed by 32%. The emerging market currency ETF (CEW) dropped by 35.5%.
My long-term subscribers can already see where this is going.
The wonderful thing about all of these cross asset class declines is that they have a leveraged effect on each other.
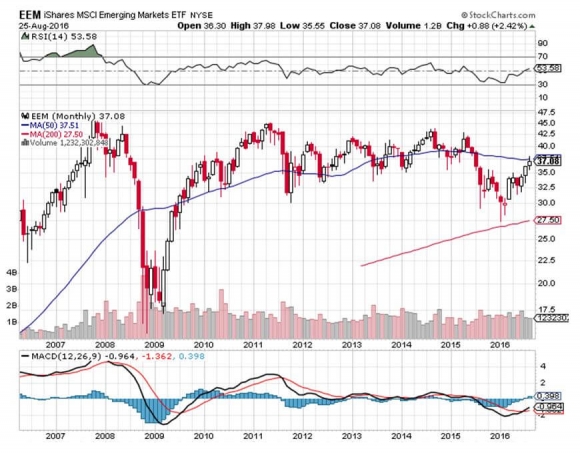
So while the ishares MSCI Emerging Market ETF (EEM) fell by 38.9%, in dollar terms it declined by more than half.
Then a funny thing happened during the second week of January 2016.
Gold took off like a rocket.
It was closely followed by silver, oil copper, palladium, platinum, and iron ore. Only the ags failed to participate.
The bull market was back!
Portfolio managers were given a simple choice.
Should they chase developed market assets trading at all time highs with yields approaching zero. Or should they load up on emerging assets at decade lows with yields approaching 12%?
Yields that high can cover up a lot of mistakes and preserve principal.
If you voted for the latter, you deserve a brass ring.
Here we are some eight months later, and the emerging bull market is alive and well. In fact, it is about to take another substantial new leg upwards.
My money is on emerging market handily beating the major US stock indexes for the rest of 2016.
The reasons for this are many and complex.
For a start, the iShares MSCI Emerging Market ETF (EEM) is still cheap.
It has to rise by 21.6% just to get back up to its 2011 highs. As a laggard play, it is beyond reproach.
In emerging market debt, the positive carry is enormous.
The Wisdom Tree Emerging Market Local Debt Fund (ELD) is yielding 5.46%, some 390 basis points high than the ten year Treasury bond (TLT).
And if you want to go with individual rifle shots in single countries, you can earn as much as 11.90% in Brazil.
The ?lower for longer? philosophy of the Fed just shines a giant great spotlight on this paper.
And guess what happened while you weren?t looking?
Emerging market debt has ?emerged.?
Five years of balance sheet repair means their credit quality has improved.
Local credit markets have grown up too.
Once dominated by huge inflows and outflows from foreign investors, markets are now much more in balance, thanks to the rise of? local institutional investors and pension funds.
The fundamentals of these countries have been steadily improving.
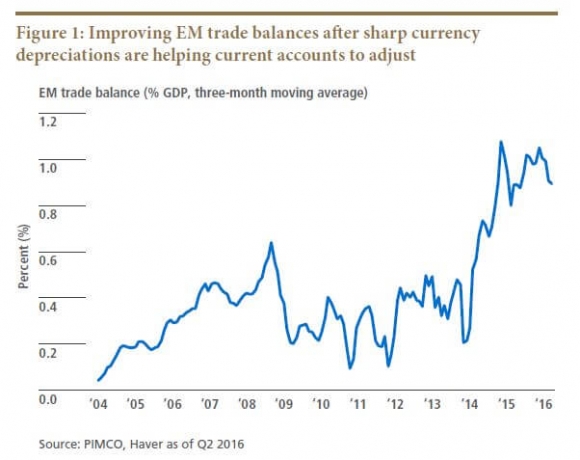
Falling currencies gave them a competitive advantage that allowed? trade surpluses to dramatically improve.
Political stability is improving. During my journalist days, you used to be able to count on one good coup d??tat or revolution in the area a year. No more.
Many business friendly, pro trade governments have come into power, such as in Argentina, India and Peru.
Emerging market GDP growth rates are still double those found in developed markets.
Markets themselves are improving. Spreads for stocks and bonds are now much tighter in emerging markets and liquidity has improved. They are ?roach motel? markets no more, where you can check in, but you can?t check out.
Get this one right, and the cross asset class hockey stick effect we saw on the downside will work just as well on the upside.
In short, there is a lot more to the emerging market dollar than there used to be. It is just a matter of time before financial markets figure this out.
Looking for the Next Bull Market
https://www.madhedgefundtrader.com/wp-content/uploads/2016/08/Women-Carrying-Baskets-on-Their-Heads-e1472173567249.jpg266400DougDhttps://madhedgefundtrader.com/wp-content/uploads/2019/05/cropped-mad-hedge-logo-transparent-192x192_f9578834168ba24df3eb53916a12c882.pngDougD2016-08-26 01:08:032016-08-26 01:08:03Emerging Markets Are Back!
While the Diary of a Mad Hedge Fund Trader focuses on investment over a one week to six-month time frame, Mad Day Trader, provided by Bill Davis, will exploit money-making opportunities over a brief ten minute to three day window. It is ideally suited for day traders, but can also be used by long-term investors to improve market timing for entry and exit points. Read more
https://madhedgefundtrader.com/wp-content/uploads/2019/05/cropped-mad-hedge-logo-transparent-192x192_f9578834168ba24df3eb53916a12c882.png00DougDhttps://madhedgefundtrader.com/wp-content/uploads/2019/05/cropped-mad-hedge-logo-transparent-192x192_f9578834168ba24df3eb53916a12c882.pngDougD2016-08-25 09:25:402016-08-25 09:25:40August 25, 2016 - MDT Pro Tips A.M.
Legal Disclaimer
There is a very high degree of risk involved in trading. Past results are not indicative of future returns. MadHedgeFundTrader.com and all individuals affiliated with this site assume no responsibilities for your trading and investment results. The indicators, strategies, columns, articles and all other features are for educational purposes only and should not be construed as investment advice. Information for futures trading observations are obtained from sources believed to be reliable, but we do not warrant its completeness or accuracy, or warrant any results from the use of the information. Your use of the trading observations is entirely at your own risk and it is your sole responsibility to evaluate the accuracy, completeness and usefulness of the information. You must assess the risk of any trade with your broker and make your own independent decisions regarding any securities mentioned herein. Affiliates of MadHedgeFundTrader.com may have a position or effect transactions in the securities described herein (or options thereon) and/or otherwise employ trading strategies that may be consistent or inconsistent with the provided strategies.