While the Diary of a Mad Hedge Fund Trader focuses on investment over a one week to six-month time frame, Mad Day Trader, provided by Bill Davis, will exploit money-making opportunities over a brief ten minute to three day window. It is ideally suited for day traders, but can also be used by long-term investors to improve market timing for entry and exit points. Read more
Global Market Comments
April 1, 2016
Fiat Lux
Featured Trade:
(CHICAGO APRIL 25 GLOBAL STRATEGY LUNCHEON),
(GOODBYE THE QUARTER FROM HELL),
(GLD), (GDX), (FXE), (XIV), (FXY), (SPY),
(THE PORTFOLIO THAT WILL DOUBLE IN THREE YEARS)
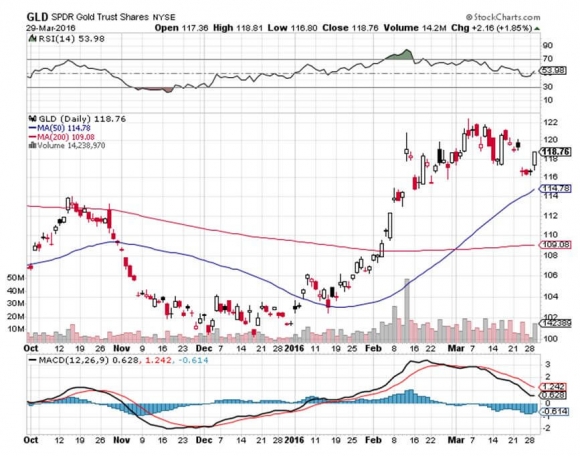
SPDR Gold Shares (GLD)
Market Vectors Gold Miners ETF (GDX)
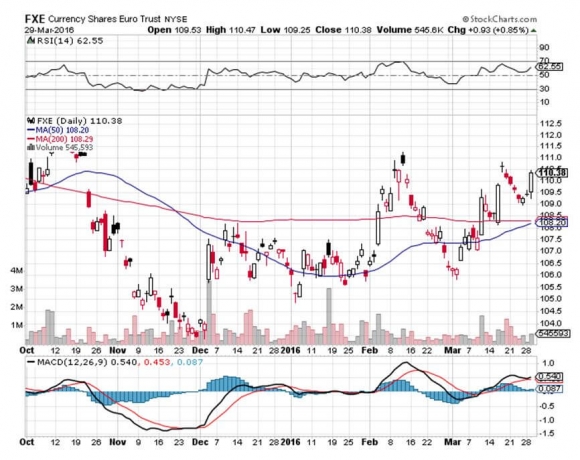
CurrencyShares Euro ETF (FXE)
VelocityShares Daily Inverse VIX ST ETN (XIV)
CurrencyShares Japanese Yen ETF (FXY)
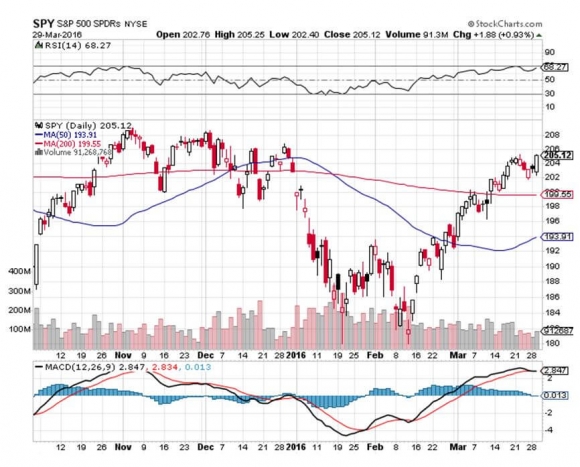
SPDR S&P 500 ETF (SPY)
Good riddance! I?m never eating at THAT restaurant again!
That?s all I can say about the completion of the first quarter of 2016. Talk about an e.coli of a quarter!
It was the worst quarter in hedge fund history. Bodies will be washing up on the beach for months.
Back-to-back we saw both the worst start to a year in stock market history, followed by the sharpest rally. Up to 70% of the net buying from the February 11 ?Jamie Diamond? bottom is thought to be corporate buybacks.
What?s more, it has done three of these nausea inducing round trips in the past 18 months, with barely any net over all change.
That is the most difficult market in the world to trade.
Activist funds especially took it in the shorts. Without exception, the best performing stocks of 2016 had the largest short positions.
Telecommunications stocks closed with the best performance at +15.3%, followed by utilities +13.9%, and consumer staples +5.2%, all defensive high dividend yielders. The reach for yield is alive and well.
Banks took the worst beating, down -5.4%, thanks the Fed?s abandonment of any near term interest rate hikes. Health care also got roughed up, down -5.7%, thanks to the double-barreled assault from both political parties.
I can see right now that there will be a great long bank, long health care trade setting up for the second half of the year, once the election gets out of the way.
I managed to keep my head above water. I closed the quarter up 3.31%, with March peeling off 2.42%. I played the entire month from the short side, which saw 15 of 22 trading days produce gains. Only a highly disciplined stop loss approach kept me from losing my shirt.
It really was the quarter of the STOP LOSS, with me taking hits on the (GDX), (FXE), (XIV), (FXY), and (SPY). The sad truth is that all of these losses expired at their maximum profit point except for the (SPY). If I had only held on, these would have been winners, at the expense of many sleepless nights for both you and me.
If you haven?t done this before, I DON?T recommend you try it some time.
Praise be to gold (GLD), which has saved my bacon three times in three months.
The good news is that I am still only 4% short of an all time performance high. Thus, I live to fight another day.
During the aforementioned 18 months from hades, the (SPY) gained a miserly 5.6%, while the Mad Hedge Fund Trader?s Trade Alert service rocketed by 47.58%.
It?s a classic case of the harder I work, the luckier I get. Being nimble, and having a half-century of trading experience under my belt helps a lot too.
When I ran my big hedge fund during the 1990?s, I learned that if you are flat when you?re wrong and up huge when you are right, the customers will take that all day long.
So will you.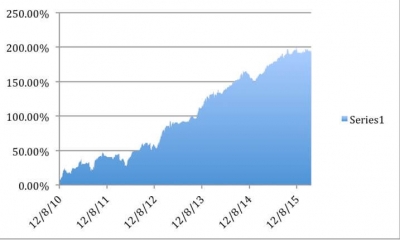
Mad Hedge Fund Trader 5 ? Year Audited Performance


Below, I have listed a portfolio of ten stocks that will almost certainly double in three years. If I am wrong, it will gain 100% in only two years.
But there is a catch. This basket of stocks may have to drop 20%-30% first. It is a cardinal rule of investment that if you want to earn higher returns, you must accept higher volatility as well.
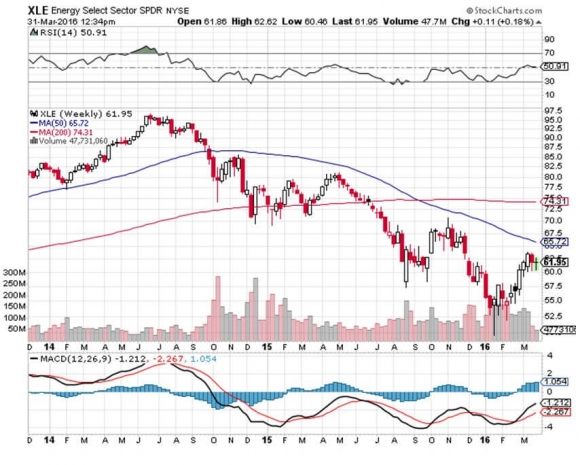
It doesn?t require a rocket scientist to figure out that this is an energy-based portfolio.
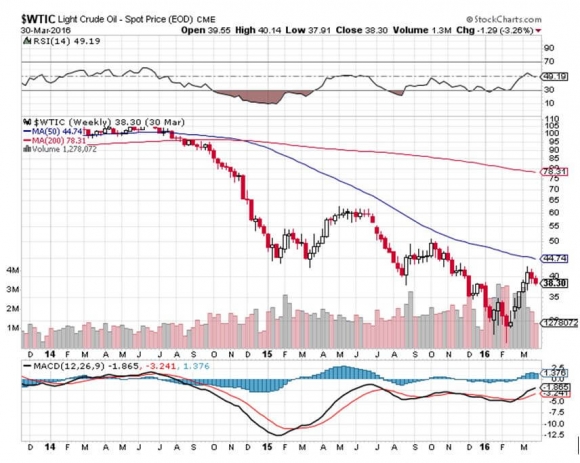
Crude almost certainly hit it's trough in the current quarter at $26 a barrel. But this python has a couple of pigs that it has to digest first.
As an old oilman, I can tell you that the oil majors have never been able to forecast the price of oil, and that is with all the resources in the world to accomplish this.
This is why they hedge out all their production in the futures market, or with long-term contracts with customers. The oil companies that thought they could predict the price of oil all went out of business a long time ago.
And as a mathematician, I can also tell you that this is an impossible task. There are just too many variables involved. So, don?t even try.
The bottom line is that absolutely no one can pinpoint when and where oil will hit bottom.
Let?s start with the supply side. Thanks to the avalanche of cash that poured into fracking plays at the top of the market last year, US oil production peaked at 9.6 million barrels a day in the spring of last year. It has since fallen to 9 million barrels a day.
This is occurring because once money enters the production pipeline, it stays there forever. Drillers would rather complete a half finished well and sell its output at a loss for a couple of years, rather than shut down construction and lose everything.
However, new projects have fallen precipitously. You see this in the collapse of the number of drilling rigs in use, from a peak of 2,000 five years ago to only 352 last week, according to the Baker-Hughes reports.
Then there is the storage issue. Much of this new oil is going straight into storage. As a result, the facilities at Cushing, Oklahoma, are full. Virtually every tanker in the world has already been chartered and is also loaded to the gunnels with Texas tea.
Once all the storage in the world was full to capacity, there was not alternative but to cap wells, or dump new production on the spot market. This led to the price Armageddon that so many investors worried about.
The peace deal with Iran won?t be a huge factor. The country?s oil infrastructure is in such a miserable state that it will be years before it impacts the market in a major way.
And, by the way, Iran is also thought to be storing oil it couldn?t sell in a fleet of tankers offshore.
Now, lets look at the demand side. We only need two letters for this one: QE.
We are a mere year into what is probably a 5-6 year program of quantitative easing in Europe. The Bank of Japan continues to dump massive amounts of cash into its own economy. Even China is easing.
In the meantime, the United States is still basking in the glow of its own just ended hyper aggressive $4 trillion QE strategy. It?s now looking like all of America?s 2016 economic growth will be concentrated in the final three quarters of the year.
This all adds of to a global synchronized economic recovery and much higher oil prices. Personally, I think oil could recover to $70 a barrel in 2017, and to $100 by 2018.
This is why large, long term institutional investors are happy to look across any potential $30 valley that may occur over the next few months and are loading the boat with energy stocks now.
Maybe you should do the same.
|
Mad Hedge Fund Trader Model Energy Portfolio |
? | |||
| ? | ? | ? | ? | ? |
|
Majors |
Symbol |
Price |
Yield |
Weighting |
| ? | ? | ? | ? | ? |
|
Exxon Mobil |
(XOM) |
$84 |
3.85% |
10% |
|
Chevron |
(CVX) |
$95 |
4.28% |
10% |
|
Occidental Petroleum |
(OXY) |
$69 |
4.41% |
10% |
|
Conoco Philips |
(COP) |
$40 |
2.52% |
10% |
| ? | ? | ? | ? | ? |
|
Exploration and Production |
? | ? | ? | ? |
| ? | ? | ? | ? | ? |
|
EOG Resources |
(EOG) |
$73 |
0.90% |
10% |
| ? | ? | ? | ? | ? |
|
Offshore Drilling |
? | ? | ? | ? |
| ? | ? | ? | ? | ? |
|
Transocean |
(RIG) |
$9 |
0.00% |
10% |
| ? | ? | ? | ? | ? |
|
Gas Liquifaction |
? | ? | ? | ? |
| ? | ? | ? | ? | ? |
|
Cheniere Energy |
(LNG) |
$34 |
0.00% |
10% |
| ? | ? | ? | ? | ? |
| ? | ? | ? | ? | ? |
|
Solar |
? | ? | ? | ? |
| ? | ? | ? | ? | ? |
|
First Solar |
(FSLR) |
$57 |
0.00% |
10% |
|
SunPower |
(SPWR) |
$22 |
0.00% |
10% |
| ? | ? | ? | ? | ? |
|
Master Limited Partnerships |
? | ? | ? | ? |
| ? | ? | ? | ? | ? |
|
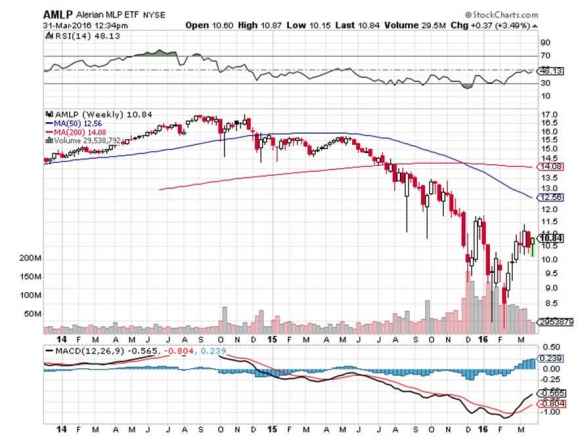
Alerian |
(AMLP) |
$11 |
11.8% |
10% |
| ? | ? | ? | ? | ? |
|
Total |
? | ? | ? |
100% |
![$wtic]()
![XLE]()
![AMLP]()
![FSLR]()
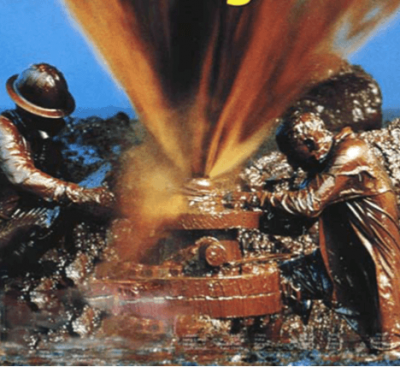
![OIL GUSHER]() Where is the ?OFF? Switch for this Thing?
Where is the ?OFF? Switch for this Thing?


?Economists say we?re having 2.5% growth. That?s a lie. The reality is that we have 5% growth for the top 20% of the economy, and 0% growth for the bottom 80% of the economy,? said Arthur Brooks, president of the American Enterprise Institute.

While the Diary of a Mad Hedge Fund Trader focuses on investment over a one week to six-month time frame, Mad Day Trader, provided by Bill Davis, will exploit money-making opportunities over a brief ten minute to three day window. It is ideally suited for day traders, but can also be used by long-term investors to improve market timing for entry and exit points. Read more
Global Market Comments
March 31, 2016
Fiat Lux
Featured Trade:
(APRIL 22 NEW YORK STRATEGY LUNCHEON)
(THE NEW COLD WAR)
(THE BEST FINANCIAL BOOK EVER)
While the Diary of a Mad Hedge Fund Trader focuses on investment over a one week to six-month time frame, Mad Day Trader, provided by Bill Davis, will exploit money-making opportunities over a brief ten minute to three day window. It is ideally suited for day traders, but can also be used by long-term investors to improve market timing for entry and exit points. Read more
Global Market Comments
March 30, 2016
Fiat Lux
Featured Trade:
(APRIL 21 BOSTON GLOBAL STRATEGY LUNCHEON),
(THE YELLEN PUT OPTION LIVES!),
(SPY), (TLT), (GLD), (FXY), (FXE),
(THE TAX RATE FALLACY),
(THE BEST TESTIMONIAL EVER!)
SPDR S&P 500 ETF (SPY)
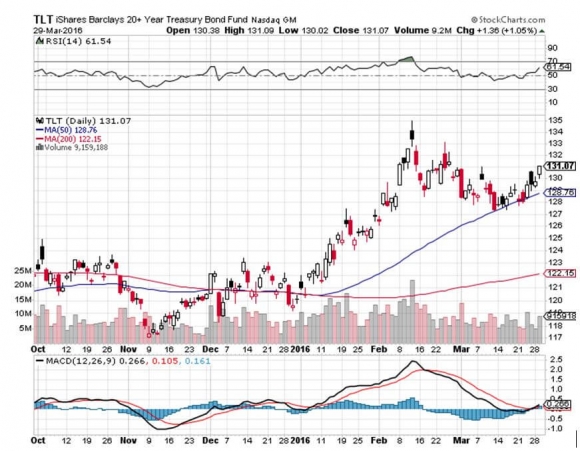
iShares 20+ Year Treasury Bond (TLT)
SPDR Gold Shares (GLD)
CurrencyShares Japanese Yen ETF (FXY)
CurrencyShares Euro ETF (FXE)
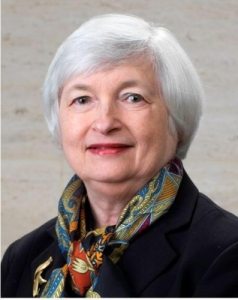
Any monetary hawks hoping for an acceleration of the Federal Reserve's interest rate policy had their hopes sorely dashed today.
Chairman Janet Yellen?s speech could not have been more dovish if it had been written by the most extreme deflationista.
Let me parse her words for you:
?greater gradualism?
??less favorable economic conditions?
?weaker foreign economies?
??downward drifting inflation expectations?
These sentiments all point towards a single possible conclusion. There won?t be another Fed interest rate hike until December, well after the presidential election.
Betting on Janet Yellen?s laser focus on employment at the expense of higher interest rates has been the surest bet you could made in the financial markets since her appointment in 2014.
Those betting on low rates triggering an upsurge in inflation were rightly spanked and had their money taken away from them.
The various asset classes made their predictable moves. Technology stocks (AAPL) and (FB), bonds (TLT), the Japanese yen (FXY), and the Euro (FXE) all rose. The dollar (UUP) and bank stocks tanked.
Gold (GLD) went up. But gold always seems to want to go up lately, no matter what the news is. It seems that the mere fact that an unknown is out of the way is cause for the barbarous relic to appreciate.
So you may be asking, ?Why on earth are you selling short the S&P 500 with this revelation.?
There is a method to my MADNESS.
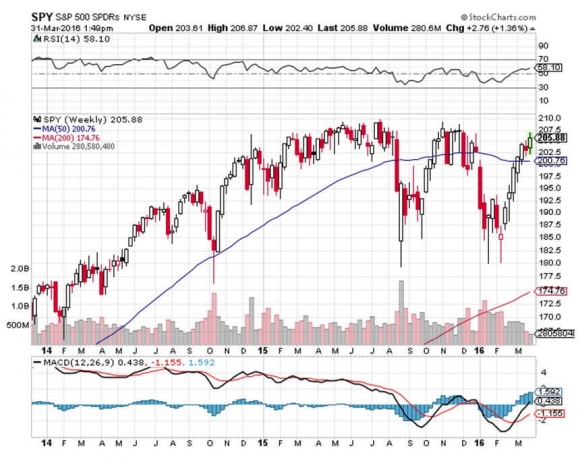
The stock market has ridden higher for six consecutive weeks. It is now more overbought than at any time in history, with a staggering 92.5% of stocks ABOVE their 50-day moving average.
My belief is that I was not alone in my own dovish expectations, and that much of the rest of the market was expecting the same. That?s why we got a monster February-March rally, despite essentially no change in the economic fundamentals.
In order words, the dovish news is already factored into the price. No surprise here!