As a potentially profitable opportunity presents itself, John will send you an alert with specific trade information as to what should be bought, when to buy it, and at what price. This is your chance to ?look over? John Thomas? shoulder as he gives you unparalleled insight on major world financial trends BEFORE they happen.Read more
https://www.madhedgefundtrader.com/wp-content/uploads/2011/10/slider-05-trader-alert.jpg316600Mad Hedge Fund Traderhttps://madhedgefundtrader.com/wp-content/uploads/2019/05/cropped-mad-hedge-logo-transparent-192x192_f9578834168ba24df3eb53916a12c882.pngMad Hedge Fund Trader2016-01-11 10:58:052016-01-11 10:58:05Trade Alert - (SPY) January 11, 2016
While the Diary of a Mad Hedge Fund Trader focuses on investment over a one week to six-month time frame, Mad Day Trader, provided by Bill Davis, will exploit money-making opportunities over a brief ten minute to three day window. It is ideally suited for day traders, but can also be used by long-term investors to improve market timing for entry and exit points. Read more
https://madhedgefundtrader.com/wp-content/uploads/2019/05/cropped-mad-hedge-logo-transparent-192x192_f9578834168ba24df3eb53916a12c882.png00DougDhttps://madhedgefundtrader.com/wp-content/uploads/2019/05/cropped-mad-hedge-logo-transparent-192x192_f9578834168ba24df3eb53916a12c882.pngDougD2016-01-11 09:47:472016-01-11 09:47:47January 11, 2016 - MDT Pro Tips A.M.
Featured Trade:
(WHY WE ARE ALL NOW OIL TRADERS),
(USO), (WTIC), (DIG),
(THE RECEPTION THAT THE STARS FELL UPON),
(NLR), (CCJ), (CORN), (WEAT), (SOYB), (DBA)
After the market closes every night, I usually don a 60 pound backpack and climb the 2,000 foot mountain in my back yard.
To pass the time, I listen to audio books on financial and historical topics, about 200 a year (I?ve really got President Grover Cleveland nailed!). That?s if the howling packs of coyotes don?t bother me too much.
I also engage in mental calisthenics, engaging in complex mathematical calculations. How many grains of sand would you have to pile up to reach from the earth to the moon? How many matchsticks to circle the earth?
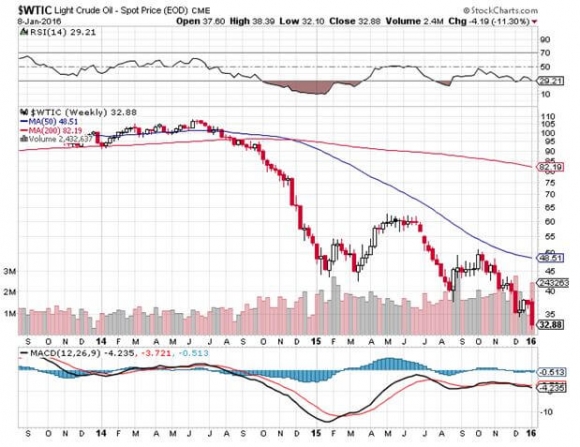
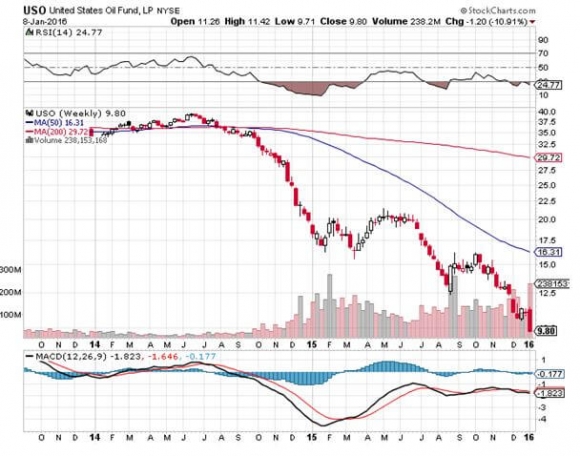
For last night?s exercise, I decided to quantify the impact of last year?s oil price crash on the global economy.
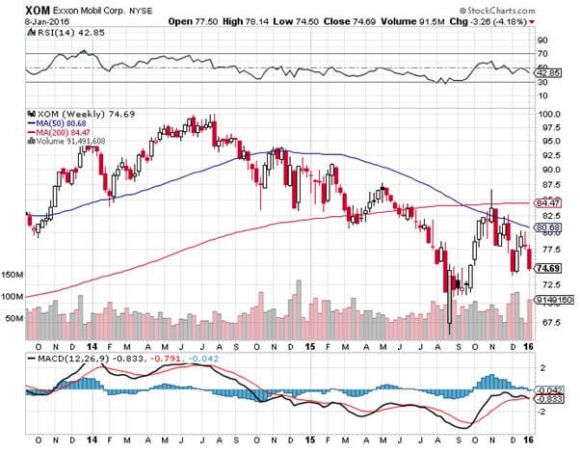
The world is currently consuming about 92 million barrels a day of Texas tea, or 33.6 billion barrels a year. In May, 2014 at the $107.50 high, that much oil cost $3.6 trillion. At today?s $32 intraday low you could buy that quantity of oil for a bargain $1 trillion.
Buy a barrel of crude, and you get three for free!
This means that $2.6 trillion has suddenly been taken out of the pockets of oil producers, and put into the pockets of oil consumers, i.e. you and me. Over the medium term, this is fantastic news for oil consumers. But for the short term, things could get very scary.
$2.6 trillion is a lot of money. If you had that amount of hundred dollar bills, it would rise to 250 million inches, 21 million feet, or 3,976 miles, or 1.2% of the way to the moon (another mental exercise). Tip this pile on its side, and you?d have a distance nearly equal to a round trip from San Francisco to New York.
The global financial system cannot move this amount of money around on short notice without causing some pretty severe disruptions. Expect a lot of bodies to float to the surface in 2016.
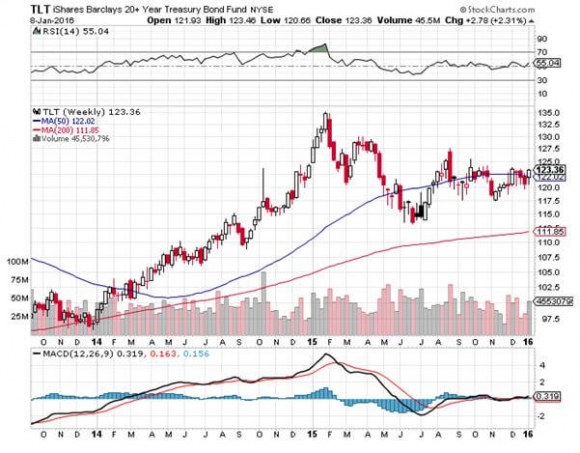
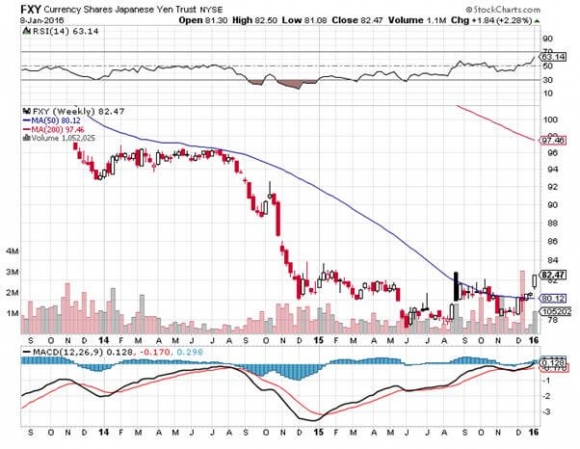
For a start, there is suddenly a lot less demand for dollars with which to buy oil. This has triggered short covering rallies in the long beleaguered Japanese Yen (FXY) and the Euro (FXE), which are just now backing off of long downtrends.
The fundamentals for these currencies are still dire. But the short-term trend now appears to be an upward one. The yen is tickling a one-year high against the buck as we speak.
The US Federal Reserve certainly sees the oil crash as an enormously deflationary event. The use of energy is so widespread that it feeds into the cost of everything. That firmly takes the chance of any interest rate rise off the table for the rest of 2016. The Treasury bond market (TLT) has figured this out and launched on a monster rally, as have muni bonds (MUB).
Traders are also afraid that the disinflationary disease will spread, so they have been taking down the price of virtually all other hard commodities as well, like coal (KOL), iron ore (BHP), and copper (CU). For more depth on this, see my piece on ?The End of the Commodity Super Cycle? by clicking here.
The precipitous fall in energy investments everywhere will be felt principally in the 15 US states involved in energy production (Texas, Oklahoma, Louisiana, North Dakota. Etc.). So, the consumers in the other 35 states should be thrilled.
However, the plunge in energy stocks is getting so severe, that it is dragging down everything else with it. ALL shares are effectively oil shares right now. In fact, all asset classes are now moving tic for tic with the price of oil. That effectively makes all of you oil traders.
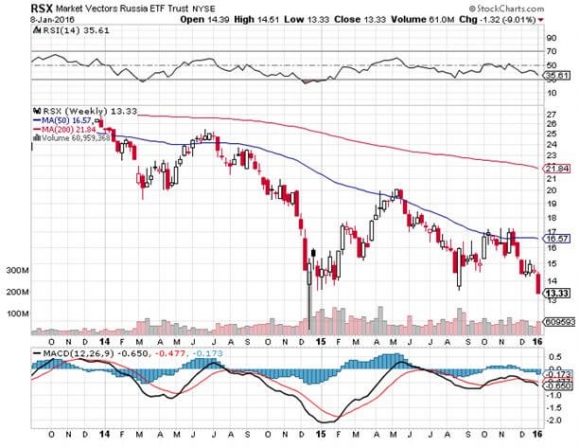
Throw on top of that the systemic risk presented by the ongoing collapse of the Russian economy. The Ruble has now fallen a staggering 70% in 18 months, and there is panic buying of everything going on in Moscow stores.
The means that the dollar denominated debt owed by local firms has just risen by 300%. Any foreign banks holding this debt are now probably regretting ever watching the film, Dr. Zhivago.
Russian interest rates there were just skyrocketed. The Russian stock market (RSX) is the world?s worst performing bourse. How do you spell ?depression? in the Cyrillic alphabet?
And guess what the new Russian currency is?
IPhone 6.0?s, of which Apple is now totally sold out in Alexander Putin?s domain!
Thankfully, this is more of a European, than an American problem. But nobody likes systemic risks, especially going into New Year trading. It?s a classic case of being careful what you wish for.
Of the $2.6 trillion today, about $650 billion is shifting between American pockets. That amounts to a hefty 3.3% of GDP. Tell me this won?t become a big political issue in the 2016 presidential election.
Money spent on oil is burned. However, money spent by newly enriched consumers has a multiplier effect. Spend a dollar at Walmart, and the company has to hire more workers, who then have more money to spend, and so on.
So a shifting of funds of this magnitude will probably add 1.5% to U.S. economic growth this year.
Ultimately, cheap energy as far as the eye can see is a key element of my ?Golden Age? scenario for the 2020?s (click herefor ?Get Ready for the Coming Golden Age?).
But you may have to get there by riding a roller coaster first.
Oil at $32?
https://www.madhedgefundtrader.com/wp-content/uploads/2012/03/roller_coaster2.jpg400392Mad Hedge Fund Traderhttps://madhedgefundtrader.com/wp-content/uploads/2019/05/cropped-mad-hedge-logo-transparent-192x192_f9578834168ba24df3eb53916a12c882.pngMad Hedge Fund Trader2016-01-11 01:07:482016-01-11 01:07:48Why We are All Now Oil Traders
As a potentially profitable opportunity presents itself, John will send you an alert with specific trade information as to what should be bought, when to buy it, and at what price.Read more
00Mad Hedge Fund Traderhttps://madhedgefundtrader.com/wp-content/uploads/2019/05/cropped-mad-hedge-logo-transparent-192x192_f9578834168ba24df3eb53916a12c882.pngMad Hedge Fund Trader2016-01-08 11:39:512016-01-08 11:39:51Trade Alert - (SPY) January 8, 2016
As a potentially profitable opportunity presents itself, John will send you an alert with specific trade information as to what should be bought, when to buy it, and at what price. This is your chance to ?look over? John Thomas? shoulder as he gives you unparalleled insight on major world financial trends BEFORE they happen.Read more
https://www.madhedgefundtrader.com/wp-content/uploads/2011/10/slider-05-trader-alert.jpg316600Mad Hedge Fund Traderhttps://madhedgefundtrader.com/wp-content/uploads/2019/05/cropped-mad-hedge-logo-transparent-192x192_f9578834168ba24df3eb53916a12c882.pngMad Hedge Fund Trader2016-01-08 11:03:462016-01-08 11:03:46Trade Alert - (GDX) January 8, 2016
While the Diary of a Mad Hedge Fund Trader focuses on investment over a one week to six-month time frame, Mad Day Trader, provided by Bill Davis, will exploit money-making opportunities over a brief ten minute to three day window. It is ideally suited for day traders, but can also be used by long-term investors to improve market timing for entry and exit points. Read more
https://madhedgefundtrader.com/wp-content/uploads/2019/05/cropped-mad-hedge-logo-transparent-192x192_f9578834168ba24df3eb53916a12c882.png00Mad Hedge Fund Traderhttps://madhedgefundtrader.com/wp-content/uploads/2019/05/cropped-mad-hedge-logo-transparent-192x192_f9578834168ba24df3eb53916a12c882.pngMad Hedge Fund Trader2016-01-08 09:39:582016-01-08 09:39:58January 8, 2016 - MDT Pro Tips A.M.
Featured Trade:
(WHY THIS IS NOT A BEAR MARKET),
(SPY), (QQQ), (IWM), (VIX), (XIV),
(A DAY WITH TOM FRIEDMAN OF THE NEW YORK TIMES)
(THE BEST FINANCIAL BOOK EVER)
Going into the New Year with 100% cash was the best decision I made in 2015. It is allowing me to use the current melt down to cherry pick the best trades out there.
Shorting the Volatility Index (VIX) at $25 through the (XIV)? Thank you very much.
Nothing marks the bottom in a move better than bringing my old buddy, Marc Faber, on TV, when the Dow Average is down $400. Marc hasn?t had a bullish day in his life. His newsletter is entitled ?Gloom, Boom, and Doom? for a reason.
Who is next? Mr. Dow $3,000, Harry S. Dent, Jr?
These gurus are predicting that we are in a new bear market, that the average stock will be down 20%-40%, and that the worst is yet to come. Don your hardhat, man the lifeboats, and run up the white flag!
Let me tell you why my friends are wrong.
To get a bear market, you need a recession. There ain?t no recession anywhere on the horizon. US GDP is set to grow at a modest 2% plus this year, not the negative numbers you need to signal the end of this bull market.
In fact, things are about to get a whole lot better.
You know that $1 trillion de factor global tax cut in the form of cheaper energy? It just became a $2 trillion tax cut, thanks the collapse in prices that we saw in December.
That other great subsidy, free money delivered by the Federal reserve in the form of ultra low interest rates, looks to continue far longer than any imagined, except for me and Janet Yellen.
This means that the causes of every recession since 1945, energy and interest rate spikes, are absolutely nowhere to be seen.
And while the dollar was a big drag on US multinational earnings in 2015, this year I expect little movement. That's because currencies need interest rate changes to move. No, change, no movement.
If we are, in fact, in a ?one and done? world, there will be very little action in the foreign exchange market this year.
All of these positives will conspire to drive American corporate profits to new all time highs this year, probably to $130 a share for the S&P 500, or up about 10%.
Granted, we are certainly in no rose garden, and the global economy is facing some challenges.
In my book, the biggest concern is the $4 trillion in new debt piled up by companies in emerging nations over the past decade. The strong dollar has effectively doubled their interest and principal payments. But save for a few banks, that is their problem, not ours.
While the market is not cheap at a 17 times price earnings multiple, it is not expensive either. This historic range for this measure of share value is 9-22. I warned you that rising interest rates, however modest, could only translate into falling multiples, a point by my calculation.
Who knew this discount would entirely kick in during the first three days of January?
So what?s the big deal here? Why are traders and investors using the New Year?s tiding to throw up on their shoes? Did they drink the wrong Champagne?
Don?t tell me it?s all about China. The bourses there never really were stock markets in the conventional sense. They are really places where the government attempts to exercise its control of their economy. As a 45 year China veteran, I have always known this. They rest of you have known it since the summer.
And these are tiny markets, accounting for no more than a couple of percent of global market capitalization. What is the foreign ownership there ? A scant 2%, held by a handful of exchange traded funds and errant hedge funds.
Remember, the Chinese didn?t want to let us join their club while prices were rising. Now that they are falling, we don?t want to join.
So was it North Korea that caused the big dump? Fat chance. It is likely that what was actually detonated was a primitive nuclear weapon, more the product of a high school chemistry class, and not the H-bomb that was advertised. It really had more to do with the Great Leader?s birthday.
The Hermit Kingdom is so poor that it will take them another five years to build another one. Take this from someone who used to build nuclear weapons for a living.
I worked at the Nuclear test Site in Nevada before my math skills took me to Wall Street, where ?yield? had an entirely different meaning.
So is ISIS and the turmoil in the Middle East causing the sell off? Nope. The threat to the US posed by this criminal organization has been wildly exaggerated because this is a presidential election year.
I tend not to worry too much about military problems that can disappear with the push of a button, or the jiggle of a joystick in Nevada.
In any case, US bear markets are prompted only by domestic developments, not foreign ones, and there is definitely none of this currently at play at home.
So why are people selling? It is really all about psychology.
After nearly seven years, the fourth longest bull market in history is getting tired. Aged bull markets act differently than new ones. As conviction fades, they become choppier, with lower returns and higher volatility.
But they still go up.
I spoke with nearly a dozen managers of $1 billion plus hedge funds today, and nearly everyone has the same attitude. Go in light on risk during the first half of the year, and then pile it on in the second half.
That gives time for foreign quantitative easing to work, the global economy to recover, even for China, energy and commodities to bounce, and for the outcome of the US presidential election to become a forgone conclusion (as it already is for me).
That means this is no more than the 15% correction I predicted last week, of which we are already two thirds of the way through. That puts the final bottom for the S&P 500 at 1,800, but it may take months to get there.
In other words, don?t get too short here, lest a ferocious short covering rally rip your face off.
So as much as traders are distressed, I am very relaxed.
I think I?ll go watch the new film The Big Short, based my friend, Michael Lewis?s book.
https://www.madhedgefundtrader.com/wp-content/uploads/2016/01/Money-on-a-Hook-e1452263319854.jpg202400Mad Hedge Fund Traderhttps://madhedgefundtrader.com/wp-content/uploads/2019/05/cropped-mad-hedge-logo-transparent-192x192_f9578834168ba24df3eb53916a12c882.pngMad Hedge Fund Trader2016-01-08 01:08:452016-01-08 01:08:45Why This is NOT a Bear Market
As a potentially profitable opportunity presents itself, John will send you an alert with specific trade information as to what should be bought, when to buy it, and at what price.Read more
00Mad Hedge Fund Traderhttps://madhedgefundtrader.com/wp-content/uploads/2019/05/cropped-mad-hedge-logo-transparent-192x192_f9578834168ba24df3eb53916a12c882.pngMad Hedge Fund Trader2016-01-07 13:41:292016-01-07 13:41:29Trade Alert - (XIV) January 7, 2016
Legal Disclaimer
There is a very high degree of risk involved in trading. Past results are not indicative of future returns. MadHedgeFundTrader.com and all individuals affiliated with this site assume no responsibilities for your trading and investment results. The indicators, strategies, columns, articles and all other features are for educational purposes only and should not be construed as investment advice. Information for futures trading observations are obtained from sources believed to be reliable, but we do not warrant its completeness or accuracy, or warrant any results from the use of the information. Your use of the trading observations is entirely at your own risk and it is your sole responsibility to evaluate the accuracy, completeness and usefulness of the information. You must assess the risk of any trade with your broker and make your own independent decisions regarding any securities mentioned herein. Affiliates of MadHedgeFundTrader.com may have a position or effect transactions in the securities described herein (or options thereon) and/or otherwise employ trading strategies that may be consistent or inconsistent with the provided strategies.