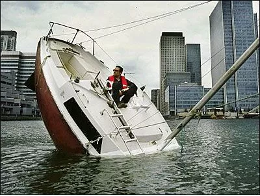
Remember the endless flood of the money supply that went on for a decade, floating all boats?
It's back!
One need look no further than the Fed balance sheet, which ratcheted up a breathtaking $297 billion last week. That offsets three months worth of quantitative tightening if it even still exists.
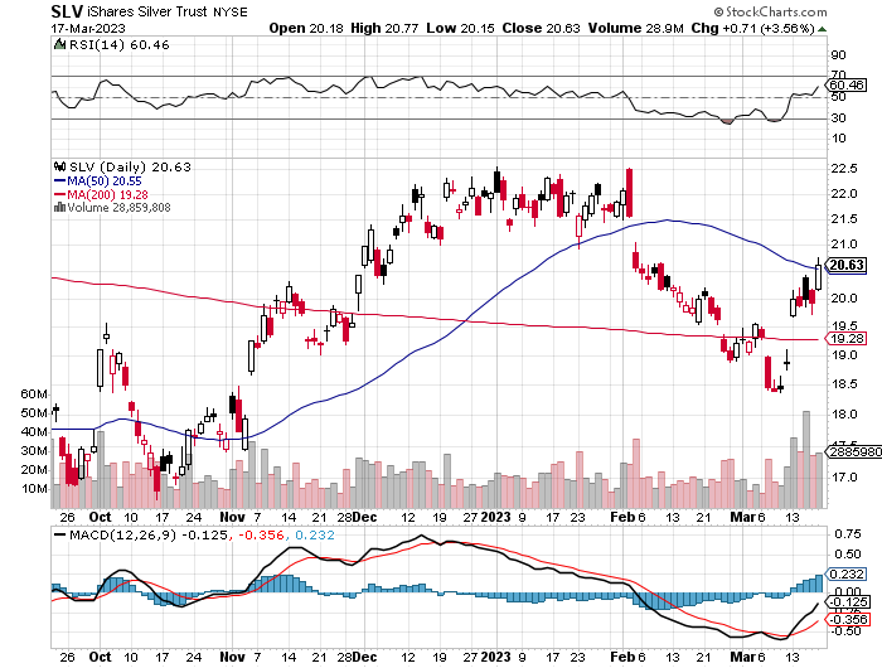
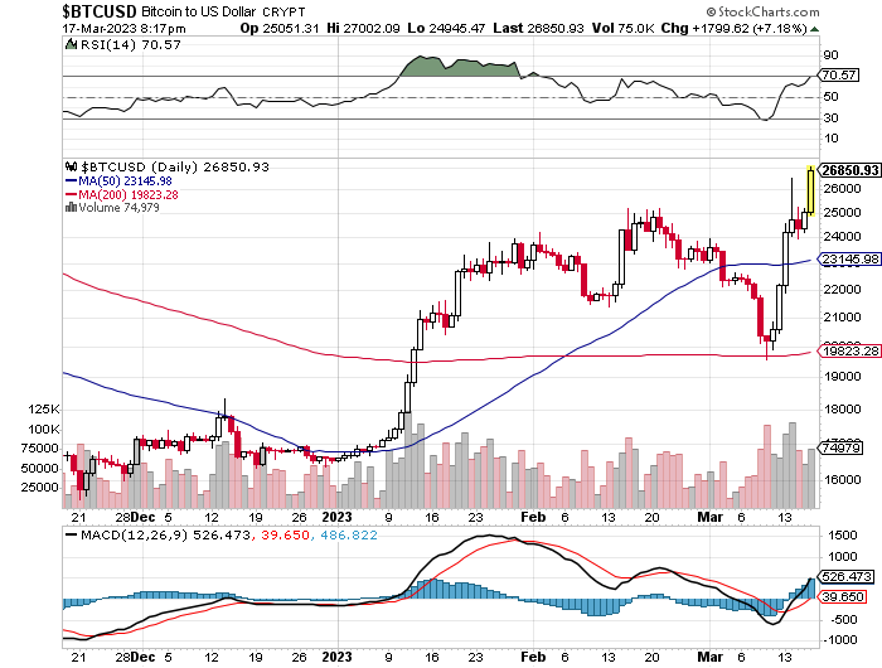
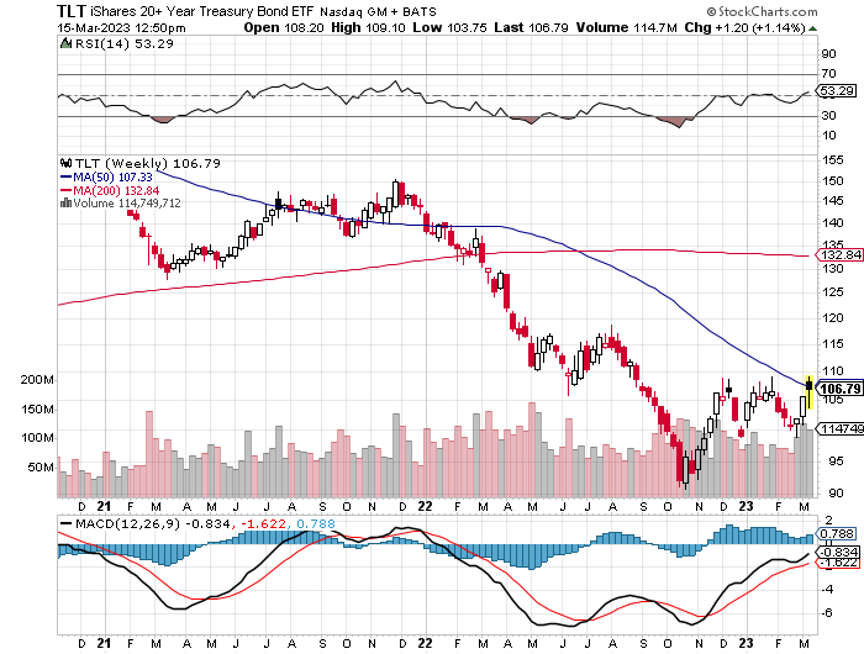
This is further confirmed by the classic QE asset classes, which saw their best week in a year. Bitcoin jumped by 30%, gold (GLD) gained 8%, silver (SLV) popped 12%, and technology stocks went on a tear. Even bonds did well, with the (TLT) up $8.00 from the previous week’s low.
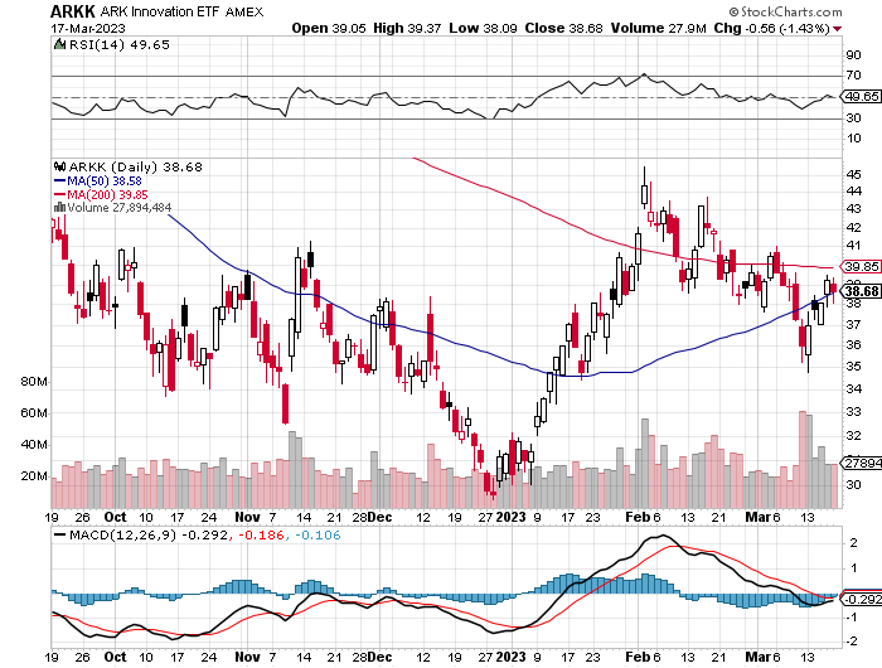
Big tech stocks like (NVDA), (AAPL), (GOOGL), and (META) are now seen as the new “safe “stocks, thanks to their gigantic balance sheets and immense cash flows. Tech funds have seen net inflows for the past four consecutive weeks, delivering the largest new investment in three years. The ARK Innovation Fund (ARKK) saw its biggest inflows since the 2021 peak.
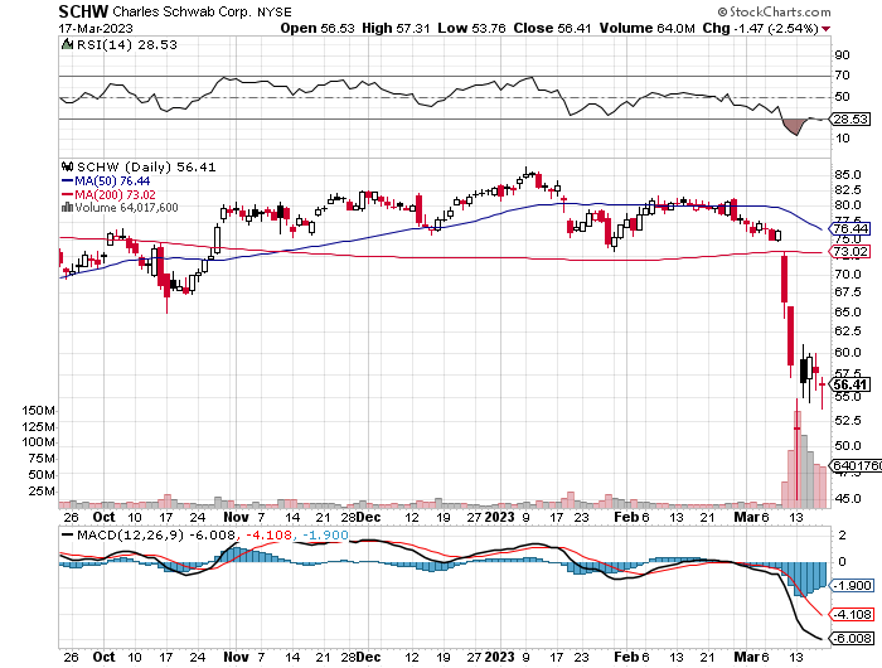
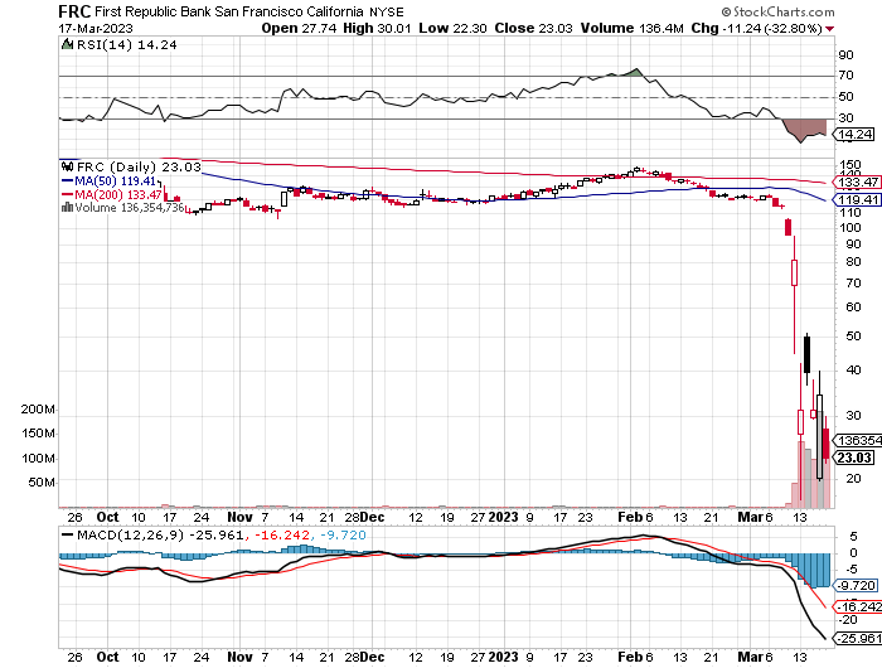
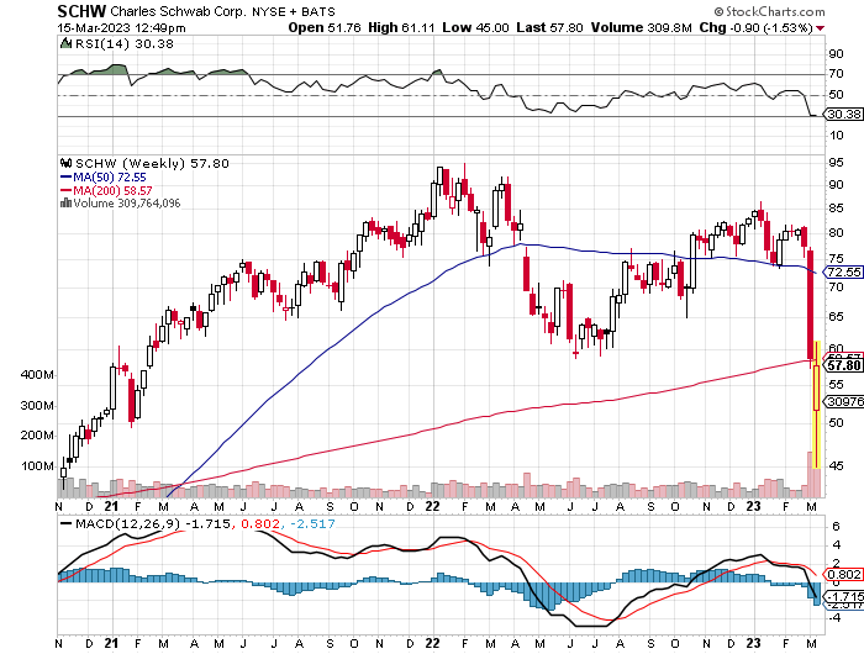
It's the regional banking crisis that is reverting the Fed to its old habits, all prompted by the mindless management of Silicon Valley Bank. All California assets were dumped as California was about to fall into the ocean, like Charles Schwab (SCHW), Bank of America (BAC), and First Republic Bank (FRC).
That puts the Fed in a quandary, which renders its interest rate decision on Wednesday, March 22 at 2:00 PM EST, because the last thing you do in a financial crisis is raise interest rates. That’s what the Fed did in 1929, extending the Great Depression from 10 days to 10 years.
My bet is that they raise by 25 basis point one more time because it’s already in the mail. The regional banking crisis has pulled forward any recession and therefore the recovery.
After that, there will be no interest rate rises for a decade, which the Fed may hint at in its statement and the following press conference. The cuts will start in June and continue rapidly after that. That’s when the economic data catch up with the reality that is happening right now, which is hugely deflationary.
(NVDA) and (TSLA) already know this, which are rising sharply on Friday.
The action certainly caught the attention of the US Treasury, which seemed willing to jump in with guarantees at the drop of a hat. There has been a massive flight of capital from the heartland to the coasts where the top 20 “too big to fail” banks live.
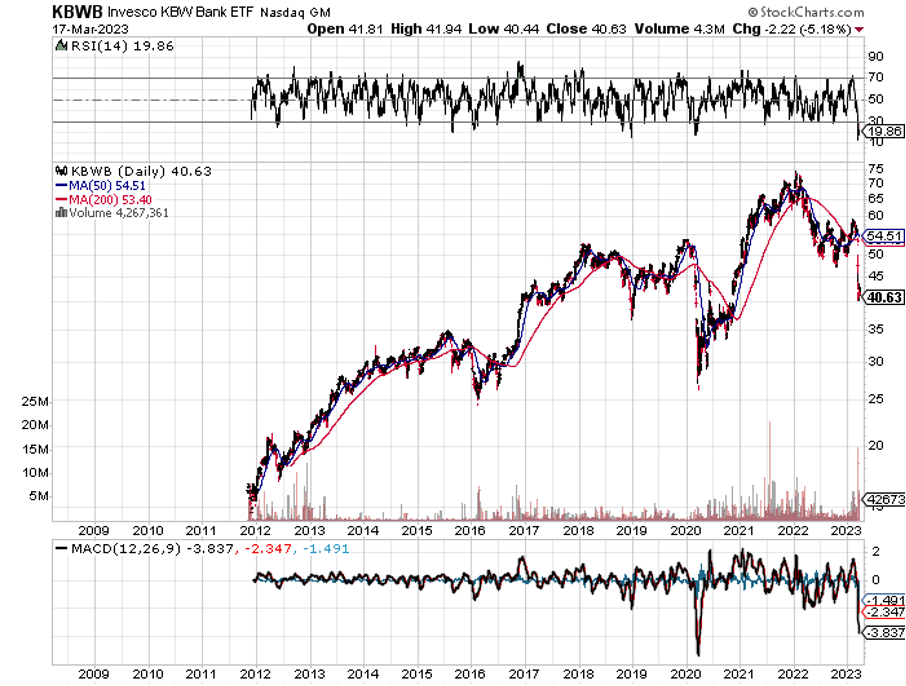
It’s another example of an industry deregulating itself out of existence, which obtained looser capital requirements after heavy lobbying in 2018. At one point, JP Morgan bank, the safest of the safe, was turning down new account applications. This means that the trade of the decade is setting up for the banks. In the wake of the 2008 financial crisis, the Invesco Bank ETF (KBWB) rose 75% in a year. I expect the same to happen this time around. It has already plunged by 30% in 2023, so it has to rise by 50% just to get back to where it was in January, but with bank deposits now guaranteed and more safeguards in place.
And if you are worried about hidden unrealized losses on bank balance sheets, I list below the safest banks ranked by capital ratios NET of losses when marked to market.
14.5% Goldman Sachs (GS)
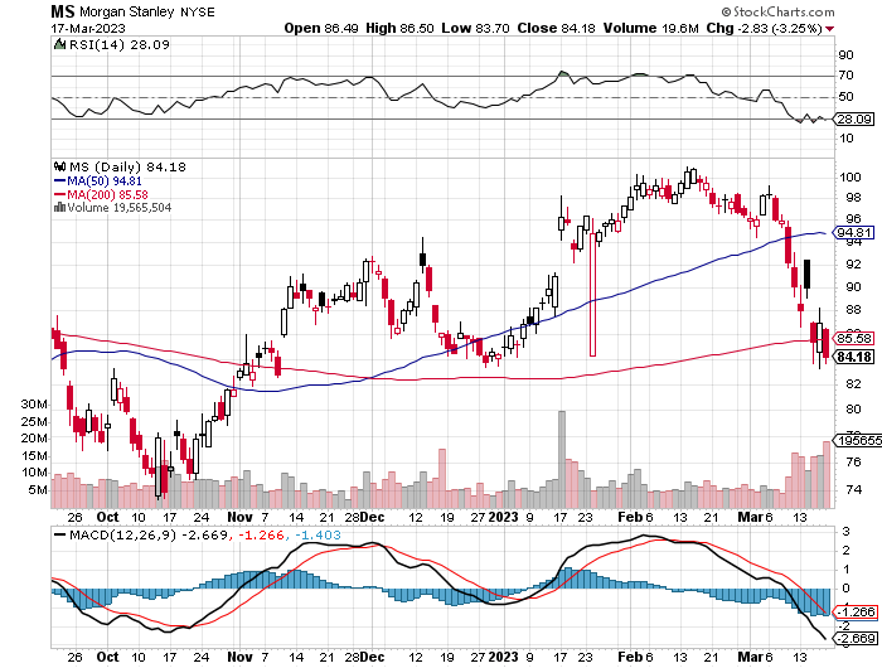
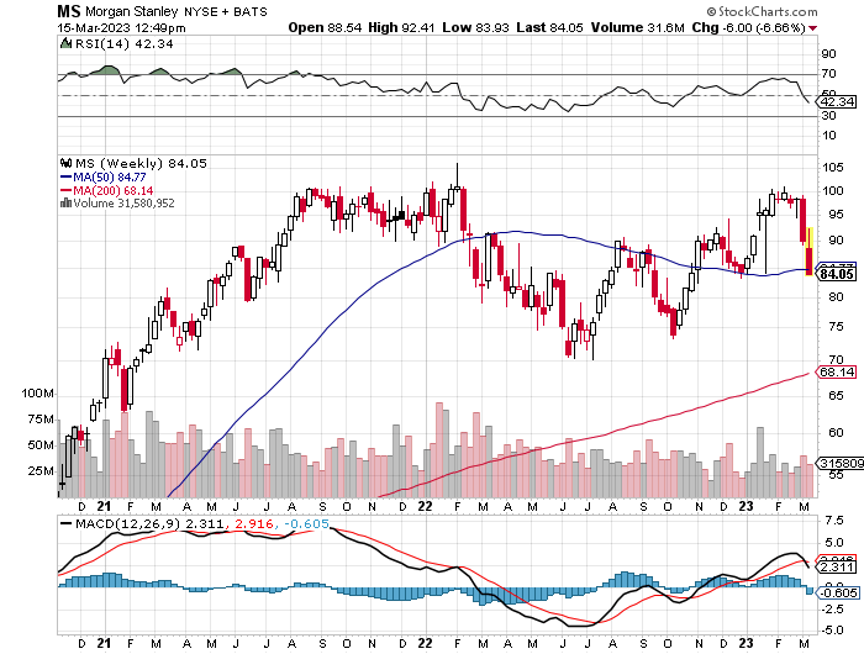
13.4% Morgan Stanley (MS)
11.5% JP Morgan Bank (JPM)
11.3% Citigroup (C)
8.7% State Street
5.9% Bank of America (BAC)
No surprise that (GS) and (MS) is at the top where the mark-to-market culture is strong. A strong dose of regulation from the SEC helps too. (BAC) takes a big hit because of the largest holdings of low-yielding mortgages which can’t be marked to market unless they are sold or defaulted.
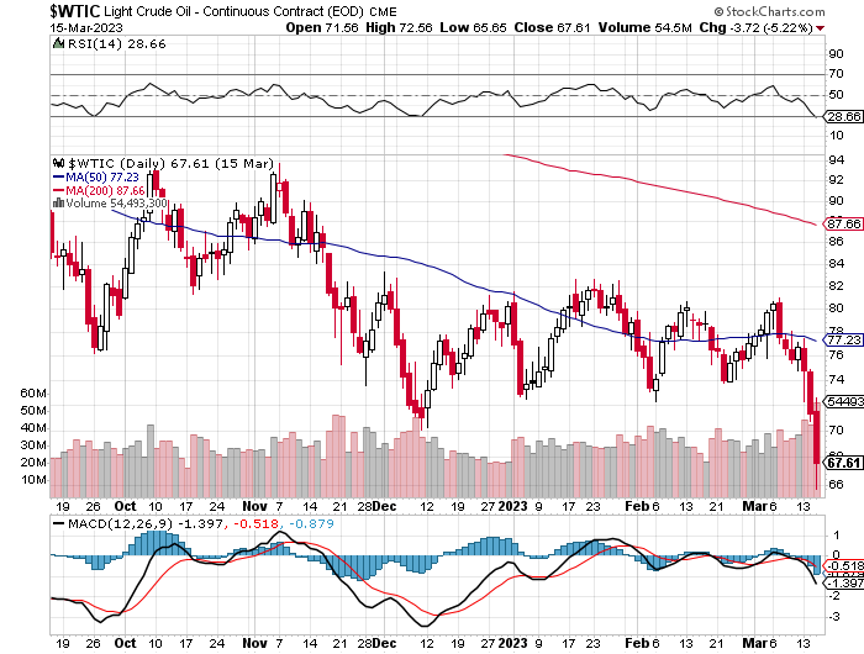
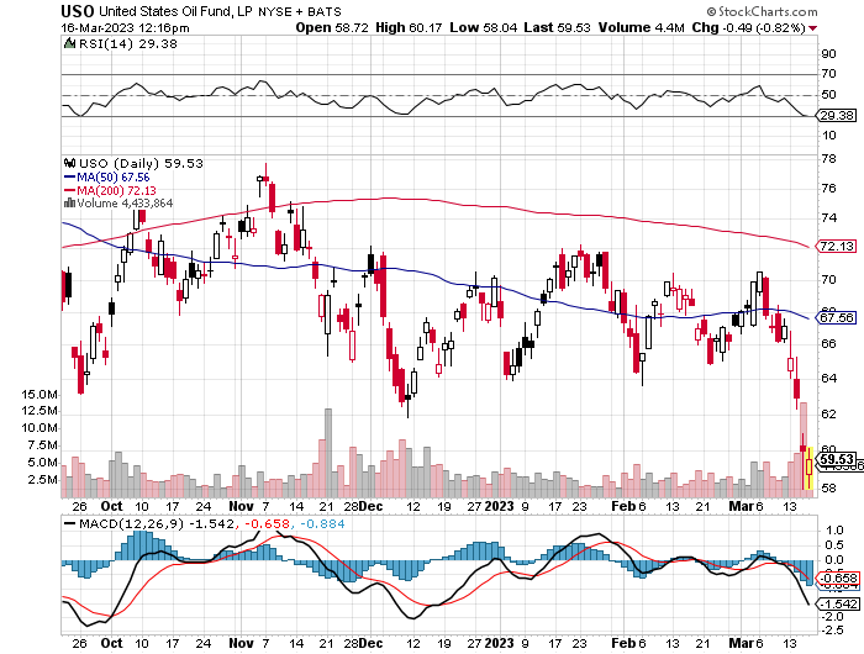
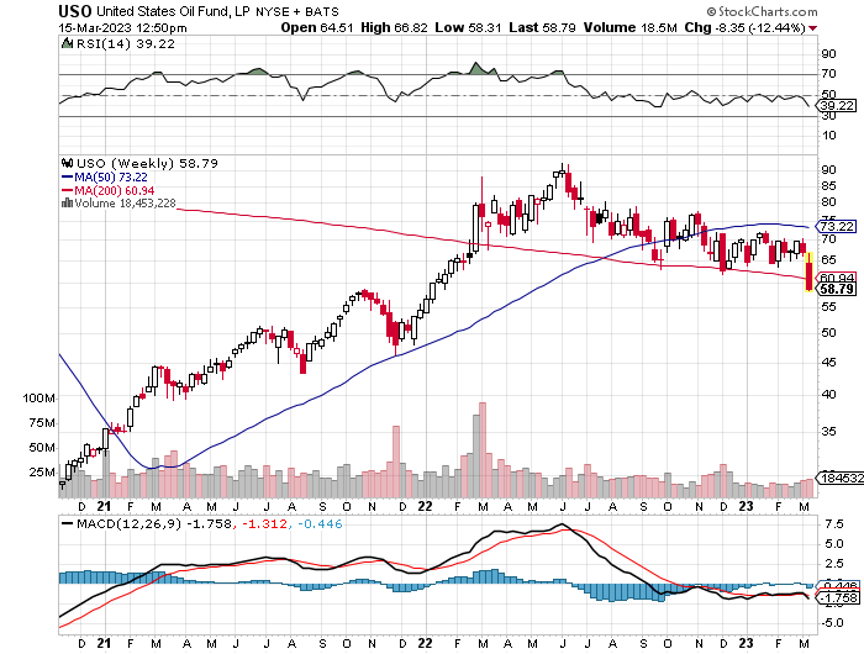
The crisis brought the traditional recession indicators out of the closet last week. A big one is crude oil prices, which hit a 2 ½ year low at $65 a barrel. It turns out that not only banks but oil producers are hurt by high interest rates as well. Some 120 million barrels have gone into storage in the beast nine months and the market is oversupplied by 300,000 barrels a day.
Only OPEC Plus can put in a floor by cutting production, which they are loathed to do as it brings immediate spending cuts. Or the greatest oil trader in history, Joe Biden of Delaware, can cover his short in the Strategic Petroleum which he sold at $90 last year. You may have to wait for a future Republican administration for that to happen.
While markets crashed, investors have been jumping out of windows, the world appeared to be ending, and the rain continuing incessantly, Mad Hedge continued on up tear with March up +5.61%.
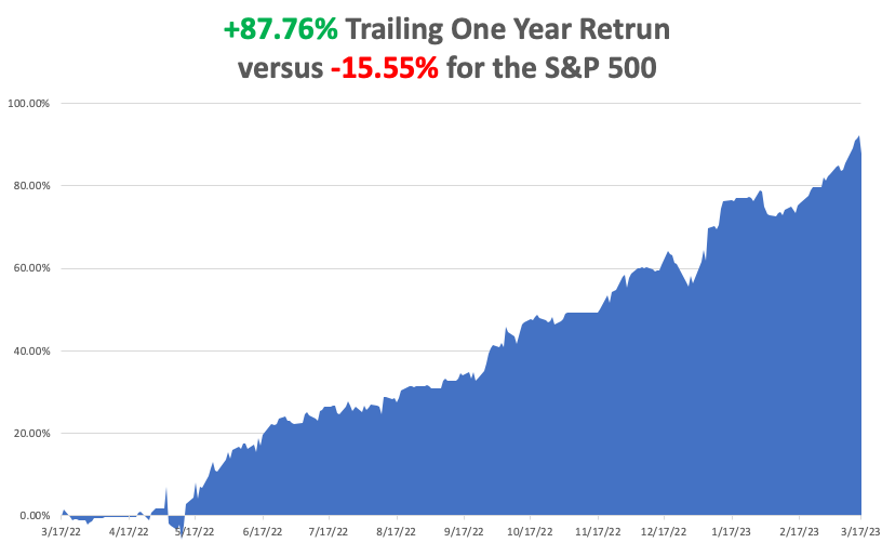
My 2023 year-to-date performance is now at an eye-popping +31.37%. The S&P 500 (SPY) is up +2.63% so far in 2023. My trailing one-year return maintains a sky-high +87.76% versus -15.55% for the S&P 500.
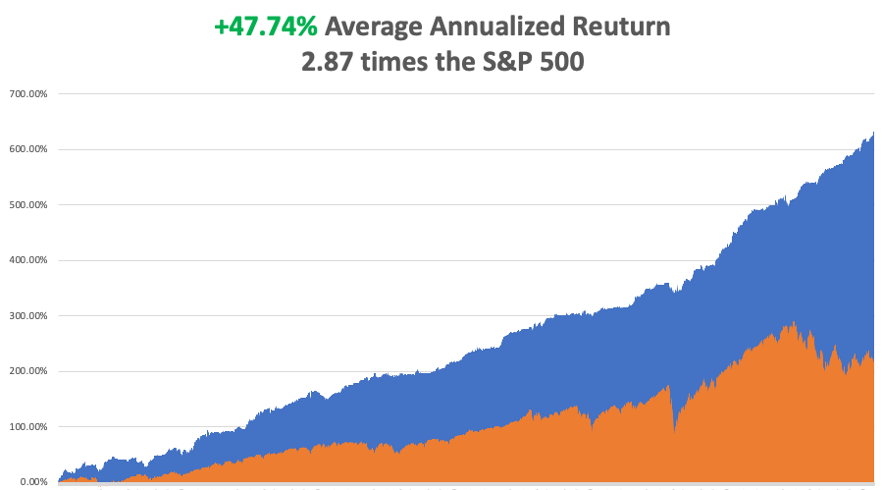
That brings my 15-year total return to +628.56%, some 2.87 times the S&P 500 (SPX) over the same period. My average annualized return has recovered to +47.76%, another new high.
At the market lows, I covered shorts in my Tesla and March NVIDIA positions. I religiously adhered to my stop loss discipline, stopping out of my April short in NVIDIA (NVDA) when the melt-up ensued, my only remaining equity short. I also established a new short in (TLT) at the market high, my first since August.
Silicon Valley Bank fails to sell, but the FDIC stepped in to guarantee all deposits. The FDIC took over Signature Bank in New York as well. If they hadn’t, there would be lines snaking out the doors of every small bank in America Monday morning. The cost is being born by steeper deposit insurance premiums for the banking industry, which will no doubt cause some grumbling. There are 100 banks that would leap to buy Silicon Valley Bank to gain a franchise in the world’s fastest growing technology center. They just need a few hours to get a handle on the bank’s loan portfolio, which only the former management really understand. Buy banks and brokers on dips (SCHW).
Is Platinum the Precious Metals Play of 2023? I am told by the insiders who know that platinum (PPLT) could be the big precious metals play of 2023. The white metal has become the principal metal used in the manufacture of catalytic converters for conventional internal combustion cars of which 15 million a year is still made in the US. There is rising demand for hydrogen fuel cells and the green hydrogen movement. The world’s second largest producer of platinum is Russia, whose supplies have been cut off. As a result, there is expected to be a 556,000-ounce shortage this year after two years of surpluses.
Say Goodbye to the 50 Basis Point Rate Hike, at the Fed meeting on March 22 in the wake of a regional banking Crisis. It’s now a quarter point….or nothing at all. In 48 hours, we have gone from “higher rates for longer” to “maybe the next rate rise is the last one.” Tech stocks are buying it after holding up incredibly well. Buy tech and big banks on dips (JPM), (BAC), (C), (SCHW).
Core Inflation Comes in Moderate, up 0.4% and 0.5% without food and energy. That is a 6.0% YOY rate, down from the 2023 high of 8.7%. Stocks extended a 300-point rally on the news. Inflation has been running at a 3.5% annual rate for the past four months, my yearend target.
Mortgage Rates Dive, off the back of a three-day, $8.00 rally in the bond market. Mortgage rates plunged by 50 basis points to 6.50% and may have more to go. Will this kick off the spring residential real estate market?
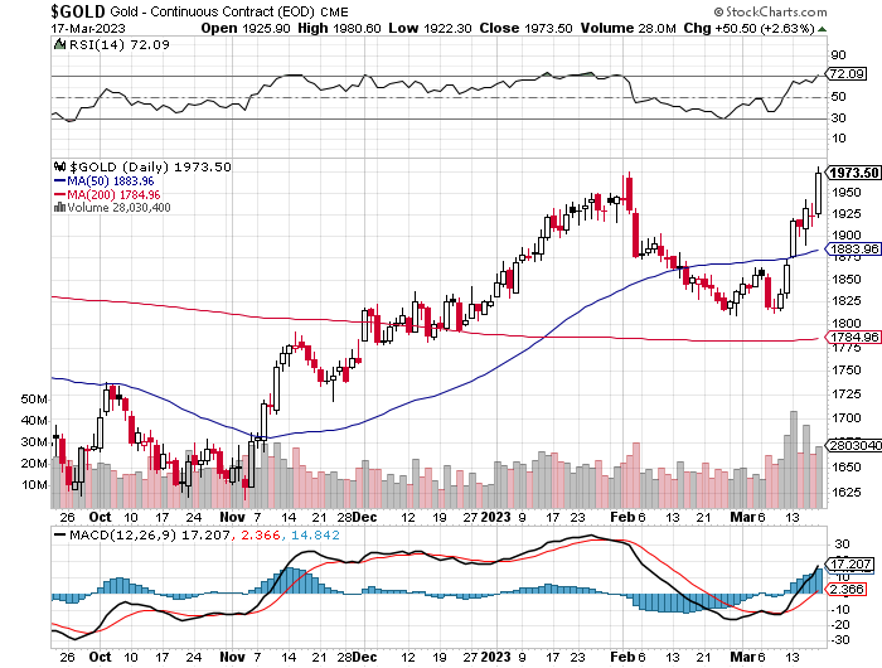
Gold (GLD) Breaks Out, crossing a key technical level and setting the options market on fire. Some gold minders saw options volume up 400%. Did the regional banking crisis put the top in interest rates, which have been weighing heavily on gold? Or maybe it’s just an old fashioned flight to safety triggered by the financial crisis. It could be presaging a global economic recovery and a coming commodity boom. (GOLD) LEAPS on the way.
Ron Baron Loaded the Boat with Charles Schwab (SCHW) Shares on Friday, as all the smart money did, including Mad Hedge. My old friend was also an early investor in Tesla (TSLA) and is now one of the largest outside shareholders. When someone offers you a dollar for 40 cents, you take it!
Swiss National Bank Steps in to Bail Out Credit Suisse, taking pressure off US market. I knew they would come in as I was a director of UBS for a year, The Swiss take care of their own. More importantly, the rolling global bank crisis has put the fear of God into the Fed, meaning that the 25 basis point hike next week may be the last for a decade. Buy “RISK ON”, especially banks.
Europe Raises Interest Rates by 50 Basis Points, catching up with the US. It’s an overreaction given the fragility of the banking system. The markets didn’t like the move. Europe has inflation at 2% higher than the US so they really had no choice
Weekly Jobless Claims Drop to 192,000, a surprising fall. The worker shortage continues unabated. It’s the biggest decline since July. If the Fed were looking for a reason to continue quantitative tightening this is it.
First Republic Bank is for Sale, the next bailout target. The mere fact that it is based in California is the problem, which many investors now apparently believe is about to break off of the North American Continent and fall into the Pacific Ocean. You never see a bank with $70 billion in cash and equivalents get in trouble. Morgan Stanley (MS) and JP Morgan are thought to be in the bidding. A group of banks deposited $30 billion into (FRC) to firewall the rest of the banking system.
My Ten-Year View
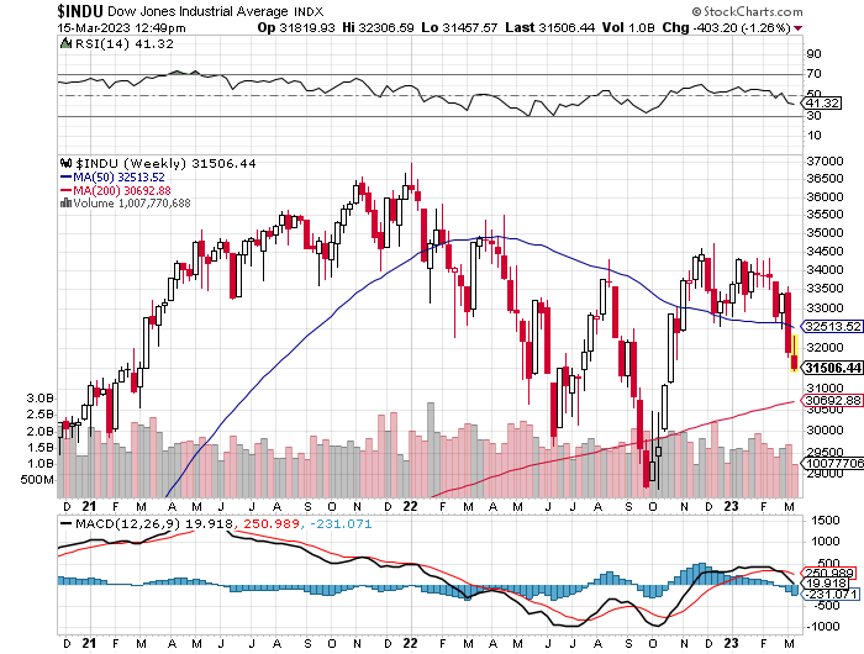
When we come out the other side of the recession, we will be perfectly poised to launch into my new American Golden Age, or the next Roaring Twenties. The economy decarbonizing and technology hyper accelerating, creating enormous investment opportunities. The Dow Average will rise by 800% to 240,000 or more in the coming decade. The new America will be far more efficient and profitable than the old.
Dow 240,000 here we come!
On Monday, March 20, there are no data points of note.
On Tuesday, March 21 at 7:00 AM, the Existing Home Sales are announced.
On Wednesday, March 22 at 7:00 AM, the Federal Reserve Open Market Committee announces its interest rate decision. A hike of 25 basis points is in the market. The published statement and following press conference will be the most important of the year, indicating whether they recognize the seriousness of the regional banking crisis and are now leaning hawkish or dovish.
On Thursday, March 23 at 8:30 AM, the Weekly Jobless Claims are announced.
On Friday, March 17 at 8:30 AM, the Durable Goods are released.
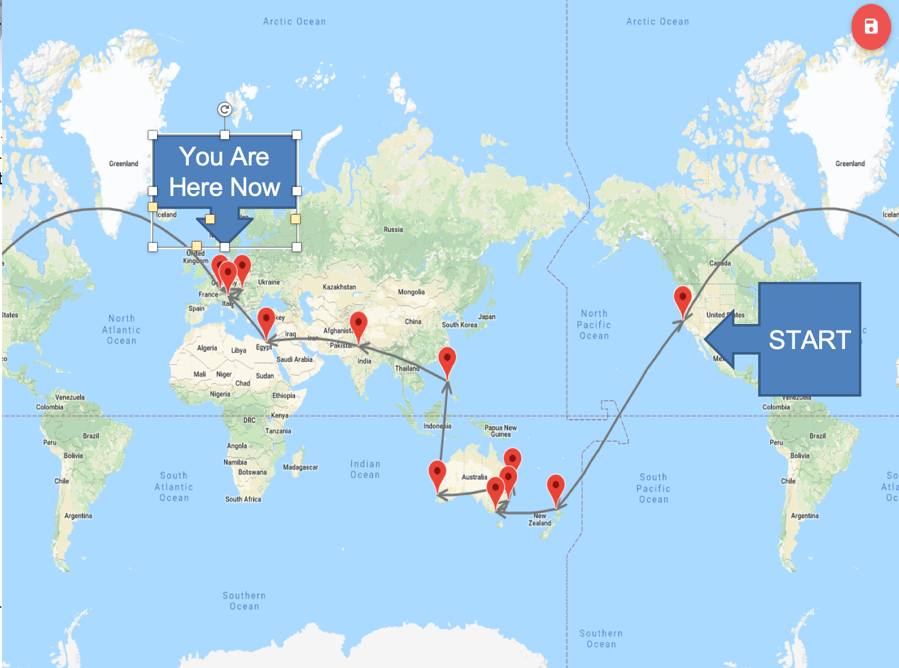
As for me, I recall my last trip around the world in 2018. I took the trip because I feared climate change would soon make visits to the equator impossible because of intolerable temperatures and the breakdown of civilization. As it turned out, the global pandemic came six months later, making such travel out of the question for two years.
I beat Phileas Fogg by 55 days, who needed 88 days to complete his trip around the world to settle a gentleman’s bet. But then, he had to rely on elephants, sailing ships, and steam engines to complete his epic voyage, or at least, the one imagined by Jules Verne.
I actually took a much longer route, using a mix of Boeings and Airbuses to fly 80 hours over 40,000 miles on 18 flights through 12 countries in only 33 days. Incredibly, our baggage made it all the way, rather than see its contents sold on the black markets of Manila, New Delhi, or Cairo.
It was a trip around the world for the ages, made even more challenging by dragging my 13 and 15-year-old girls along with me. I have always considered my most valuable asset to be the trips I took to Europe, Africa, and Asia in 1968. The comparisons I can make today some 55 years later are nothing less than awe-inspiring. I wanted to give the same gift to them.
It began with a 12 ½ hour flight from San Francisco to Auckland, New Zealand. Straight out of the airport, I rented a left-hand drive Land Rover and drove three hours to high in the steam-covered mountains of Rarotonga where we were dinner guests of a Māori tribe. To earn my dinner of pork and vegetables cooked underground, I had to dance the haka, a Māori war dance.
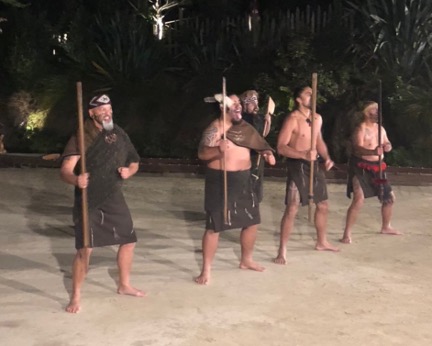
The Haka
Of course, with kids in tow, a natural stop was the Hobbit Village of Hobbiton 1½ hours outside of Auckland. I figured the owners of the idyllic sheep farm were earning at least $25 million a year showing tourists the movie set.
In all, I put 1,000 miles on the car in four days, even crossing New Zealand’s highest mountain range on a dirt road. The thick forests were so primeval my daughter expected to see a dinosaur around every curve. We reached our southernmost point at Mt. Ruapehu, a volcano used as the inspiration for Mt. Doom in Peter Jackson’s Lord of the Rings.
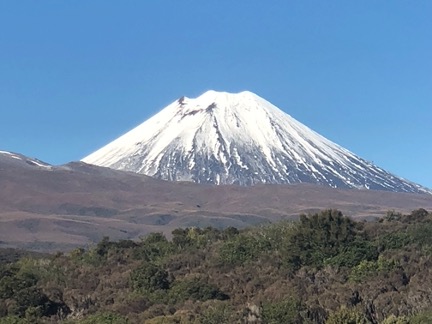
The Real Mount Doom
The focus of the Australia leg were ten strategy lectures which I presented around the country. I was mobbed at every stop, with turnouts double what I expected. The Mad Hedge Fund Trader and the Mad Hedge Technology Letter picked up 100 new subscribers in the Land Down Under in five days.
Maybe it was something I said?
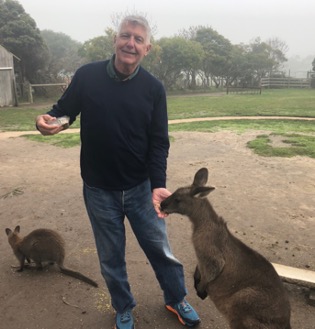
My kids’ only requirements were to feed real kangaroos and koala bears, which we duly accomplished on a freezing cold morning outside Melbourne. We also managed to squeeze in a tour of the incredible Sydney Opera House in between lectures, dashing here and there in Uber cabs.
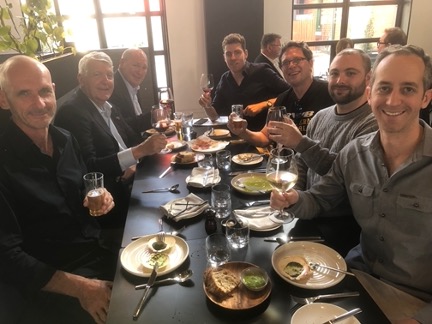
I hosted five Mad Hedge Global Strategy Luncheons for existing customers in five days. The highlight was in Perth, where eight professional traders and I enjoyed a raucous, drunken meal. They had all done well off my advice, so I was popular, to say the least. Someone picked up the tab without me even noticing.
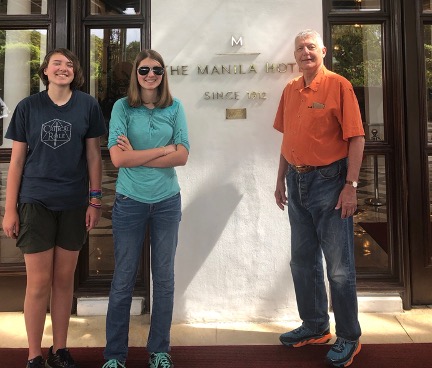
After that, it was a brief ten-hour flight to Manila in the Philippines, with a brief changeover in Hong Kong, where massive protest demonstrations were underway. Ever the history buff, I booked myself into General Douglas MacArthur’s suite at the historic Manila Hotel. The last time I was here, I interviewed President Ferdinand Marcos and his lovely wife Imelda. After a lunch with my enthusiastic Philippine staff and I was on my way to the airport.
I took Malaysian Airlines to New Delhi, India, which has lost two planes over the last five years and where the crew was definitely on edge. I asked why a second plane was lost somewhere over the South Indian Ocean and the universal response was that the pilot had gone insane. Security was so tight that they confiscated a bottle of Jamieson Irish Whiskey that I had just bought in duty free.
India turned out to be a dystopian nightmare. If climate change continues, this is your preview. With temperatures up to 120 degrees in 100% humidity, people were dying of heat stroke by the hundreds. Elephants had to be hosed down to keep them alive. It was so hot you couldn’t stray from the air conditioning for more than an hour. The national radio warned us to stay indoors.
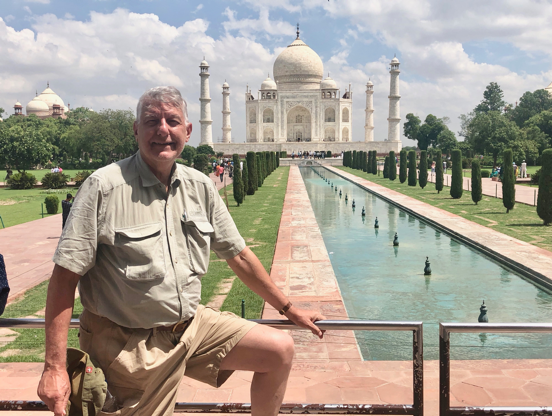
In Old Delhi, the kids were besieged by child beggars pawing them for food and there were mountains of trash everywhere. In the Taj Mahal, my older daughter passed out and we had to dump our remaining drinking water on her to cool her down and bring her back to life. We spent the rest of the day sightseeing indoors at the most heavily air-conditioned shops.
If global temperatures rise by just a few more degrees, you’re going to lose a billion people in India very soon.
On the way to Abu Dhabi, we flew directly over the tanker war at the Straits of Hormuz, one of my old flight paths during my Morgan Stanley days. It was too dusty to see any action there. We got a much better view of Sinai and the Red Sea, which, I told the kids, Moses parted 5,000 years ago (they’ve seen Charlton Heston in The Ten Commandments many times).
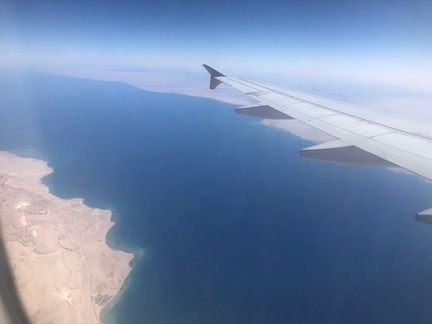
The Red Sea
Upon landing at Cairo, Egypt’s ever-vigilant military intelligence service immediately picked me up. Apparently, I was still in their system dating back to my coverage of Henry Kissinger’s shuttle diplomacy for The Economist in 1976. That was all a long time ago. Having two kids with me meant I was not there to cause trouble, so they were very friendly. They even gave us a free ride to the downtown Nile Hilton.
After India, Cairo, and the Sahara Desert were downright pleasant, a dry and comfortable 100 degrees. We did the standard circuit, the pyramids, and the Sphynx followed by a camel ride into the desert.
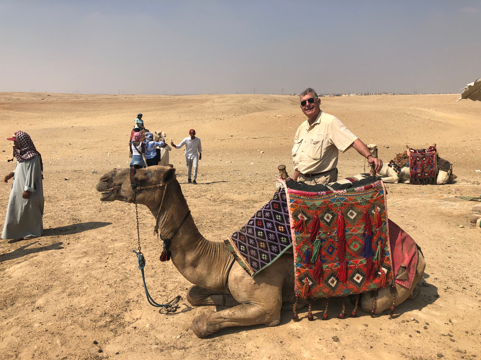
If you are the least bit claustrophobic, don’t even think about crawling into the center of the Great Pyramid on your hands and knees as we did. I was sore for two days. We spent the evening on a Nile dinner cruise, looking for alligators, entertained by an unusually talented belly dancer.
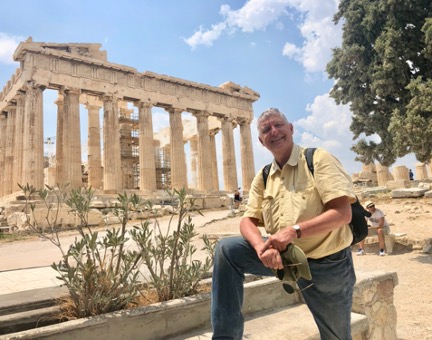
The next stage involved a one-day race to Greece, where we circled the Acropolis in all its glory, and then argued with a Greek taxi driver on how to get back to the airport. We ended up taking an efficient airport train, a remnant of the 2000 Athens Olympics. If impoverished and bankrupt Athens has such great airport train, why doesn’t New York or San Francisco?
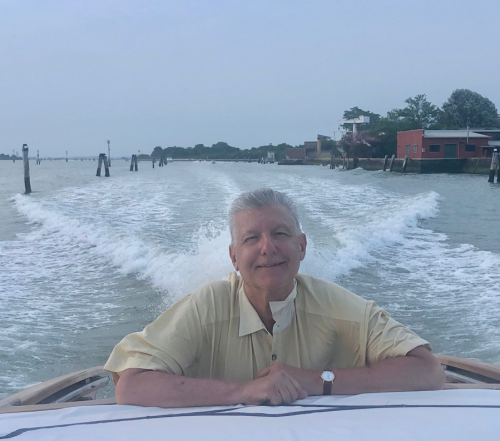
It was a quick hop across the Adriatic to Venice Italy, where we caught an always exciting speed boat from the Marco Polo to our Airbnb near St. Mark’s Square. We ran through the ancient cathedral and the Palace of the Doges, admiring the massive canvases, the medieval weaponry, and of course, the dungeon.
One of the high points of the trip was a performance of Vivaldi’s Four Seasons in the very church it was composed for. A ferocious thunderstorm hit, flooding the plaza outside and causing the lead violinist’s string to break, halting the concert (rapid humidity change I guess).
When we got home with soggy feet, the Carabinieri had cordoned off our block with police tape because a big chunk of our 400-year-old roof had fallen into the street. It taxed my Italian to the max to get into our apartment that night. The Airbnb host asked me not to mention this in my review (I didn’t).
The next day brought a circuitous trip to Budapest via Brussels. Budapest was a charm, a former capital of the Austria-Hungarian Empire and the architecture to prove it. The last time I was here 55 years ago, the Russian Army was running the place and it was grim, oppressive, and dirty.
Today, it is a thriving hot spot for Europe’s young, with bars and night clubs everywhere. Dinners dropped from $150 in Venice to $30. We topped the night with a Danube dinner cruise with a folk dancing troupe. I’m telling you, you can live there like a king for $1,000 a month.
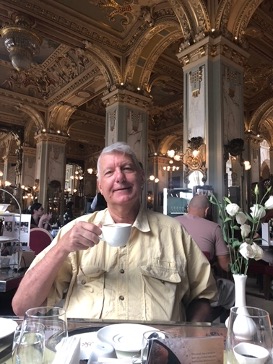
Visiting the Golden Age in Budapest
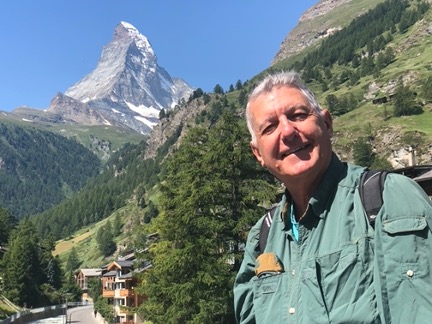
The next morning, we drew closer to our final destination of Switzerland. A four-hour train ride brought us to my summer chalet in Zermatt and some much-needed rest. At the end of a long valley and lacking any cars, Zermatt is one of those places where you can just give the kids 50 Swiss francs and tell them to get lost. I spent mornings hiking up from the valley floor and afternoons getting caught up on the markets and my writing.
There’s nothing like recharging my batteries in the clean mountain air of the Alps. The forecast was rain every day for two weeks, but it never showed. As a result, I ended up hiking ten miles a day to the point where my legs were made of lead by the end.
The only downer was watching helicopters pick up the bodies of two climbers who fell near the top of the Matterhorn. As temperatures rise rapidly, the ice holding the mountain together is melting, leading to a rising tide of fatal accidents.
I caught my last flight home from Milan. Anything for one more great dinner in Italy, which I enjoyed in the Galleria. At the train station, I chatted with a troop of Italian Boy Scouts in blue uniforms headed for the Italian Alps. The city was packed with Chinese tour groups, and there was a one-month wait to buy tickets for Leonardo DaVinci’s The Last Supper. Another Airbnb made sure I stayed up all night listening to the city’s yellow trolleys trundle by.
Finally, an 11-hour flight brought me back to the City by the Bay. Thanks to two sleeping pills of indeterminate origin I went to sleep over England and woke up over Oregon, preparing for a landing. It seems that somewhere along the way I proposed marriage to the Arab woman sitting next to me, but I have no memory of that whatsoever. At least that’s what the head flight attendant thought.
I am now planning this summer trip. After the Queen Mary and the Orient Express should I climb the Matterhorn again? Or should I summit Mount Kilimanjaro in Africa first? No transatlantic trip should ever be wasted. And I have to get home in time to join a 50-mile hike with the Boy Scouts in New Mexico and then cart two kids off to college.
What a great problem to have.
Good Luck and Good Trading,
John Thomas
CEO & Publisher
The Diary of a Mad Hedge Fund Trader