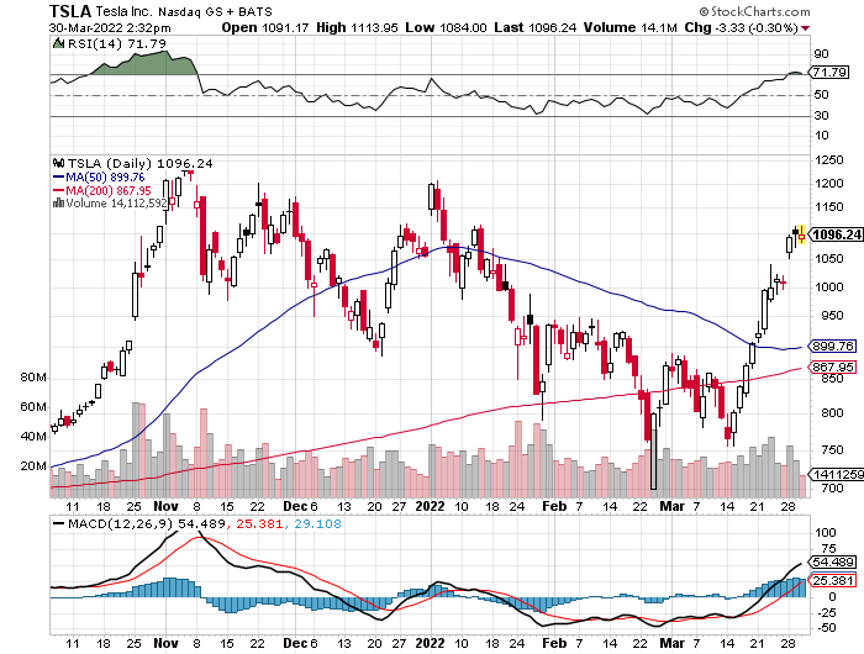
Tesla shares have recently gotten their mojo back, exploding by an incredible 60% in the past month, and that can only mean one thing: mass production of solid-state batteries is fast approaching.
For the last 30 years, the cutting edge of battery design has been trapped in lithium-ion liquid or gel states. This originally Japanese technology took us from the first generation of smartphones in the early 1990s to the 1,200-pound, 405-mile range behemoths of today.
Now it’s time for the next big thing.
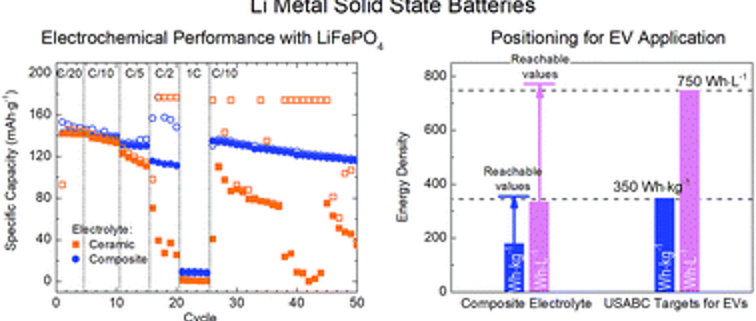
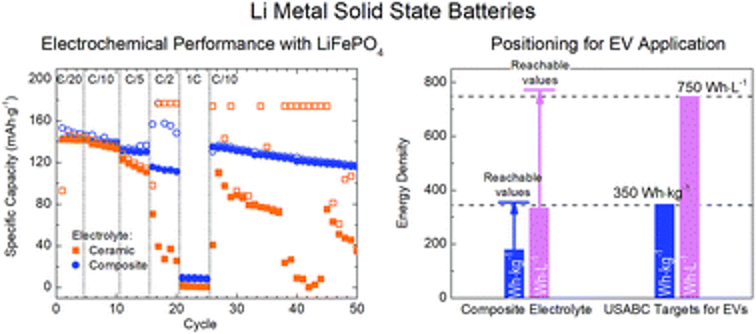
Solid-state batteries, made of oxide, sulfide, and phosphate ceramics, have existed in labs for decades and are currently used in pacemakers and other small devices. But economic mass production has remained elusive.
That may be about to change.
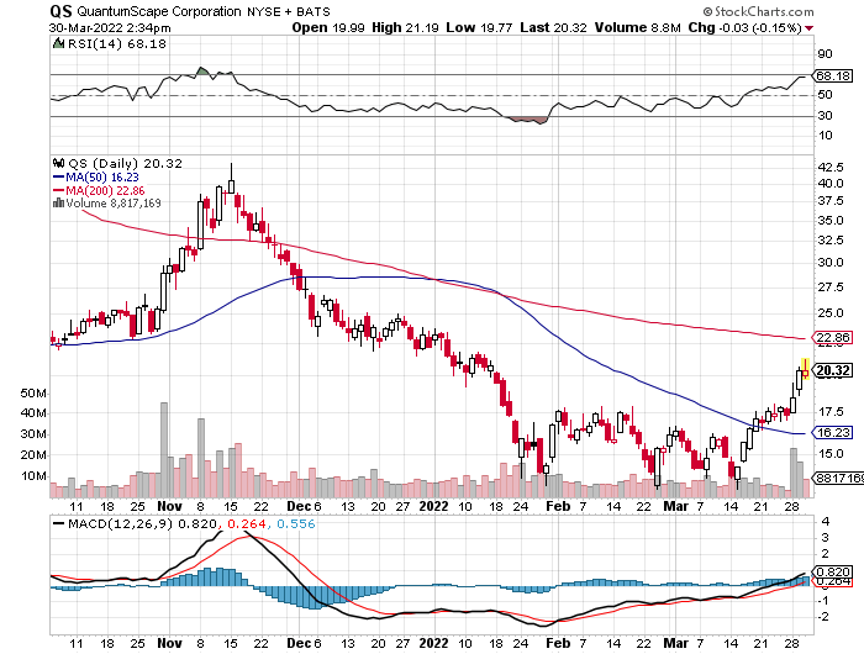
Bill Gates-backed QuantumScape gained a listing on the New York Stock Exchange via a SPAC (special purpose acquisition corporation) with Kensington Capital Acquisition Corp. (click herefor the link). The deal valued the company at $3.3 billion, a high figure for a firm with no salable product.
QuantumScape is a decade-old San Jose, CA-based startup which has been pioneering solid-state battery technology. It obtained a $100 million investment from Volkswagen in 2018. QuantumScape’s goal is to supply the batteries for an all-electric VW Golf by 2025.
And here is the big deal about solid state. It offers energy densities 2.5 greater than existing lithium-ion batteries. It also presents far less risk of catching fire when punctured, as we have seen dramatically on TV a few times over the last couple of years with unfortunate Teslas.
With such technology, Tesla can cut battery sizes from 1,200 pounds to 500 pounds, chop $6,000 off the cost of production of each car, and further extend ranges because of less weight.
That would enable Tesla to enter the mass market with a $36,000 entry-level Tesla 3 or small SUV Model Y with minimal fuel cost and maintenance for the life of the car. This is how Tesla boosts production from last year’s 500,000 units to 5 million units annually by 2025. This is what the recent $700 Tesla share price is all about.
There are even more advanced battery technologies on the horizon. Samsung is working on graphene technology for its smartphones. The University of Chicago has developed a lithium dioxide battery seven times more powerful than those currently available. Silicon nanowire technology will become viable in three years that offer a further multiplication of ranges.
In the end, Elon Musk may surprise us all. In 2019, Tesla bought Maywell Technologies and their dry battery technology which can produce batteries at 16 times greater energy density at 20% less cost, giving a 20-fold improvement in battery performance.
That is a greater leap in energy densities than we have seen over the past decade when costs dropped by 80%.
As a long-time Tesla owner (chassis no. 125 of the assembly line), I can tell you that it has been a battle to keep up with Tesla’s rapidly emerging technology. As soon as I bought a Model X three years ago with a 275-mile range, a new 351-mile range was announced. I did get a great deal on the car though and I’ll never drive another vehicle.
As an old venture capitalist once told me, “When you’re in tech, you’re in the bakery business. You have to sell whatever you have in three days before it goes stale.”
For a YouTube video of Bill Gates explaining his involvement in QuantumScape, please click here.
https://www.madhedgefundtrader.com/wp-content/uploads/2021/07/Li-metal-solid-state-batteries.png334756Mad Hedge Fund Traderhttps://madhedgefundtrader.com/wp-content/uploads/2019/05/cropped-mad-hedge-logo-transparent-192x192_f9578834168ba24df3eb53916a12c882.pngMad Hedge Fund Trader2022-03-31 09:02:302022-03-31 13:54:24Why Solid-State Batteries are the “Next Big Thing”
There is always a way to make money in the stock market. Get the direction right and the rest is a piece of cake.
But what if the market is going nowhere, trapped in a range, with falling volatility? Yes, there is even a low risk, high return way to make money in this kind of market, a lot like the one we have now.
2022 may be a more subdued affair than recent years, with the Dow gaining a modest 10%. The average annualized return for the last ten years is 13.9%, including dividends.
And that’s the way markets work. It’s like watching a bouncing ball, with each successive bounce shorter than the previous one. Thank Leonardo Fibonacci for this discovery (click here for details.)
Which means a change in trading strategy is on order. The free lunch is over. It’s finally time to start working for your money.
When you’re trading off a decade low, it's pedal to the metal, full firewall forward, full speed ahead, damn the torpedoes. Your positions are so aggressive and leveraged that you can’t sleep at night.
Some 16 months into the bull market, not so much. It’s time to adjust your trades for a new type of market that continues to appreciate, but at a slower rate and not as much.
Enter the Buy-Write.
A buy-write is a combination of positions where you buy a stock and also sell short options on the same stock against the shares at a higher price, usually on a one-to-one basis.
“Writing” is another term for selling short in the options world because you are in effect entering into a binding contract. When you sell short an option, you are paid the premium the buyer pays and the cash sits in your brokerage account accruing interest.
If the stock rallies, remains the same price, or rises just short of the strike price you sold short, you get to keep the entire premium.
Most buy-writes take place in front month options and the strike prices are 5% or 10% above the current share price. I’ll give you an example.
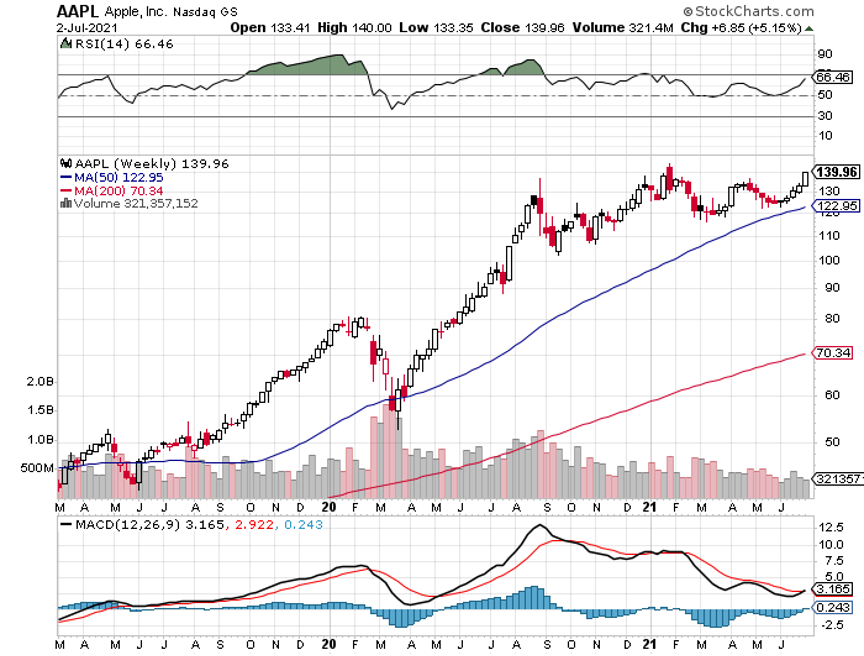
Let’s say you own 100 shares of Apple (AAPL) at $140. You can sell short one August 2021 $150 call for $1.47. You will receive the premium of $147.00 ($1.47 X 100 shares per option). Remember, one option contract is exercisable into 100 shares.
As long as Apple shares close under $150 at the August 20 option expiration, you get to keep the entire premium. If Apple closes over $150, you automatically become short 100 Apple shares. Then you simply instruct your broker to cover your short in the shares with the 100 Apple shares you already have in your account.
Buy-writes accomplish several things. They reduce your risk, pare back the volatility of your portfolio, and bring in extra income. Do these right and it will enhance the overall performance of your portfolio.
Knowing when to strap these babies on is key. If the market is going straight up, you don’t want to touch buy-writes with a ten-foot pole as your stock will be called away and you will miss substantial upside.
It’s preferable to skip dividend-paying months, usually March, June, September, and December to avoid your short option getting called away mid-month by a hedge fund trying to get the dividend on the cheap.
You don’t want to engage in buy-writes in bear markets. Whatever you take in with option premium, it will be more than offset by losses on your long stock position. You’re better off just dumping the stock instead.
Now comes the fun part. As usual, the are many ways to skin a cat.
Let’s say that you are a cautious sort. Instead of selling short the $150 strike, you can sell the $155 strike for less money. That would bring in $79 per option. But your risk of a call-away drops too.
You can also go much further out in your expiration date to bring in more money. If you go out to the January 18, 2022 expiration, you will take in a hefty $6.67 in option premium, or $667 per option. However, the likelihood of Apple rising above $150 and triggering a call-away by then is far greater.
Let’s say you are a particularly aggressive trader. You can double your buy-write income by doubling your option short sales at the ratio of 2:1. However, if Apple closes above $150 by expiration day, you will be naked short 100 shares of Apple.
It is likely you won’t have enough cash in your account to meet the margin call for selling short 100 shares of Apple so you will have to buy the shares in the market immediately. It's something better left to professionals.
How about if you are a hedge fund trader, have a 24-hour trading desk, a good in-house research department, and serious risk control? Then you can entertain “at-the-money buy writes.”
In the case of Apple, you could buy shares and sell short the August 20 $140 calls against them for $4.45 and potentially take in $4.45 for each 100 Apple shares you own. Then you make a decent profit if Apple remains unchanged or goes up less than $4.45.
That amounts to a $3.18% return in 34 trading days and annualizes out at 26%. In bull markets, hedge funds execute these all day long, but they have the infrastructure to manage the position. It’s better than a poke in the eye with a sharp stick.
There are other ways to set up buy-writes.
Instead of buying stock, you can establish your long position with another call option. These are called “vertical bull call debit spreads” and are a regular feature of the Mad Hedge Trade Alert Service. “The “vertical” refers to strike prices lined up above each other. The “debit” means you have to pay cash for the position instead of getting paid for it.
How about if you are a cheapskate and want to get into a position for free? Buy one call option and sell short two call options against it for no cost. The downside is that you go naked short if the strike rises above the short strike price, again triggering a margin call.
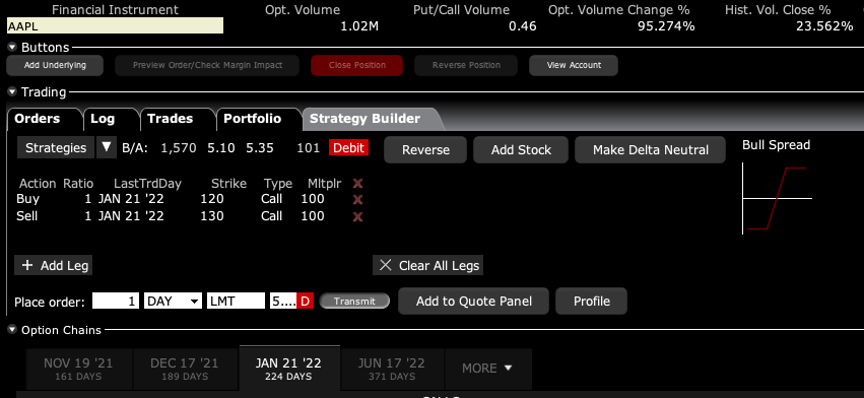
Here is my favorite, which I regularly execute in my own personal trading account. Buy long-term LEAPS (Long Term Equity Anticipation Securities) spreads like I recommended some time ago with the (AAPL) January 21 $120-$130 vertical bull call spread for $5.20.
On expiration day, it closed at $7.21, up 38.65%.
This is a bet that one of the world’s fastest-growing companies will see its share unchanged or higher in seven months. In Q1, Apple’s earnings grew by an astonishing 35% to $23.6 billion. Sounds like a total no-brainer, right?
If I run this position all the way to expiration, the total return would be ($10.00 - $5.20 = $4.80), or ($4.80/$5.20 = 92.31%) by the January 21, 2022 options expiration. This particular expiration benefits from the year-end window dressing surge, and the New Year asset allocation into equities.
Whenever we have a big up month in the market, I sell short front-month options against it. In this case, that is the August 20 $150 calls. This takes advantages of the accelerated time decay you get in the final month of the life of an option, while the time decay on your long-dated long position is minimal.
Keep in mind that the deltas on LEAPS are very low, usually around 10% because they are so long-dated. That means your front month short should only be 10% of the number of shares owned through your LEAPS in order to set delta neutral. Otherwise, you might get hit with a margin call you can’t meet.
After doing this for 53 years, it is my experience that this is the best risk/reward options position available in the market.
To make more than 92.31% in seven months, you have to take insane amounts of risk, or engage in another profession, like becoming a rock star, drug dealer, or Bitcoin miner.
I’m sure you’d rather stick to options trading, so good luck with LEAPS.
https://www.madhedgefundtrader.com/wp-content/uploads/2020/01/john-california-eagles.png297377Mad Hedge Fund Traderhttps://madhedgefundtrader.com/wp-content/uploads/2019/05/cropped-mad-hedge-logo-transparent-192x192_f9578834168ba24df3eb53916a12c882.pngMad Hedge Fund Trader2022-03-29 09:02:172022-03-29 14:40:19A Buy-Write Primer
My goal this year is to make $1,000,000 with your guidance.
AND …. if my goal is achieved…. I will be inviting you and any companion of your choice to a weekend of stargazing and psychedelic musings in Joshua Tree in my fully reconditioned 1970 Airstream Land Yacht.
Sadly, you will not receive the same level of service as the Orient Express or the QE II, and no black ties are required for the picnic table.
Best regards,
David
https://www.madhedgefundtrader.com/wp-content/uploads/2021/10/joshua-tree-camping.png644864Mad Hedge Fund Traderhttps://madhedgefundtrader.com/wp-content/uploads/2019/05/cropped-mad-hedge-logo-transparent-192x192_f9578834168ba24df3eb53916a12c882.pngMad Hedge Fund Trader2022-03-28 09:04:362022-03-28 13:39:03Testimonial
Listening to the market commentary this week, the word “unbelievable” kept popping up.
It was “unbelievable” that the market crashed by 15% when Russia invaded Ukraine. It was equally “unbelievable” that it then melted up 7% over five trading days.
So has the market gone from discounting the outbreak of WWIII and complete Armageddon to a total victory by Ukraine, the resurgence of NATO, and the end of Russia….in a week?
Well, maybe they have done just that.
The only thing we can count on for sure is that volatility will continue for the indefinite future. The only certainty we have is that change will continue, and it is accelerating at a phenomenal rate.
Of course, it’s all amazing to me. I am a creature of the American 1950s who is now living 70 years in the future. Yes, even the Jetson-type flying cars have happened.
Let me update you on the war, since I know you’re all dying to know.
The Ukraine is winning. What once appeared to be a small, defenseless nation had in fact been preparing for a prolonged guerilla war for seven years, ever since Crimea was invaded.
Javelin and stinger missiles were stockpiled at every key intersection in the country. And the California National Guard has been training the army on how to use them for the last seven years. It was all a gigantic ambush in the making.
The Russian Army, which has seen no real combat experience for 30 years, believed their own propaganda and literally expected to be showered with roses on day one. As a result, they ran out of gasoline, food, and ammunition, and now precision weapons. Some 10% of the army has been killed and maybe 20% of their Air Force shot down. The war is essentially over, so Putin is desperately seeking a way to call it a victory and get out.
Putin himself is toast. At this point, he is the richest man in the world who can’t spend a single ruble of his money. What wealth he had overseas has been seized and will be used to finance the reconstruction of Ukraine. Putin can never leave Russia again without being arrested as a war criminal. But if he stays, he runs the constant risk of assassination. The guy has made a lot of enemies.
What about Putin’s nukes you may ask? Of the headline 7,000 such weapons mentioned in the SALT treaties, only 200 actually work. The rest are corroding empty shells. The math is very simple. Russia’s $1 trillion GDP can’t support any more of these wildly expensive weapons. By the way, China has the same number.
The logic of MAD (Mutually Assured Destruction) still applies, making nuclear weapons useless. If Putin fires off one nuke, his entire country vaporizes in 30 minutes. His generals know this. If ordered to use nukes, they would either ignore the order or depose him immediately.
As someone who has spent the last half-century contemplating the future of the universe, the consequences of this are absolutely mind-boggling.
Economic warfare has finally come into its own as a weapon more destructive than nuclear weapons. In a year, per capita income in Russia will have plunged from last year’s $10,000 to the Soviet-era $1,000. In weeks, Putin has written off 30 years of economic growth. A second Russian Revolution is a sure thing, but what form it will take should be interesting.
How did such a clever man as Putin end up in such a predicament? He surrounded himself with advisors who told him only what he wanted to hear. Such is the way of dictators who have been in power too long. A recent US president had the same problem, with similar results.
The US is the huge winner in all this. Biden announced on Friday that America will replace the missing Russian oil and gas, some 10% of the total world supply. This has already started a renaissance of the US energy industry, which only two years ago was on its heels and destinated to become the next buggy whip industry.
As I have been pointing out to the Joint Chiefs since all this started, strong support for Ukraine not only eliminates Russia as a threat, it puts the shackles on China with its own expansionist desires. You haven’t heard much about Taiwan lately. For America, it’s a twofer.
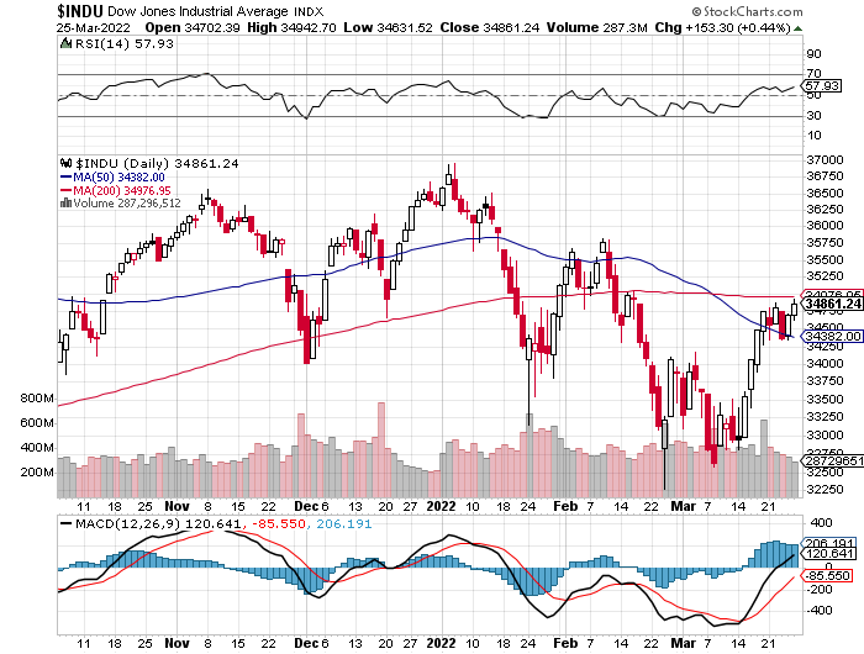
To say all of this is wildly positive for American stock markets is an understatement. It certainly keeps my $240,000 forecast for the Dow by 2030 on the table. How long it will take investors to figure all this out is anyone’s guess. But I think we are setting up for one hell of a second half.
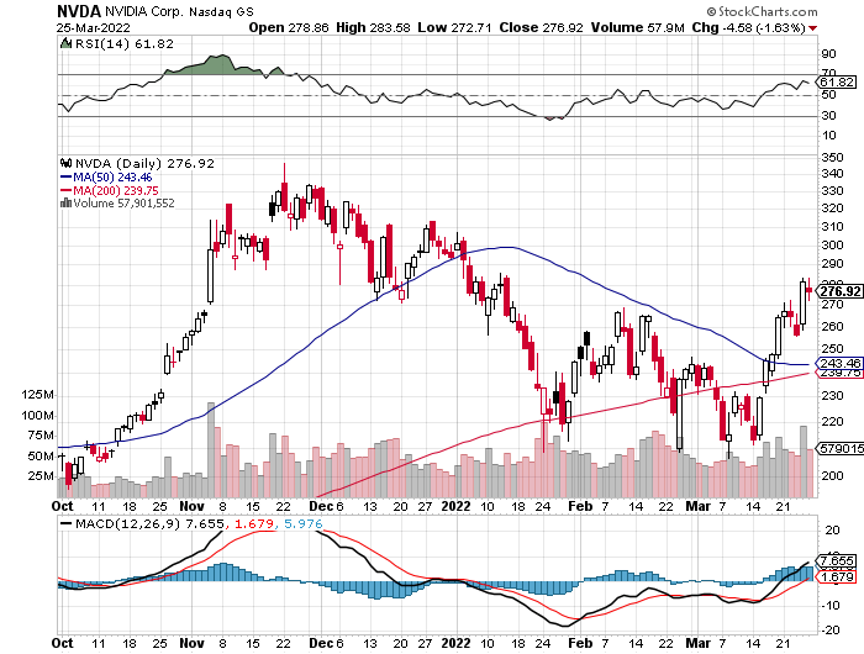
You see all this in the behavior of a single stock. After NVIDIA (NVDA), the best stock in the world, plunged 40% on fears of deglobalization, it rocketed by 47% in the past week, suggesting that deglobalization is coming back stronger than ever. It reiterates my argument that you use this correction to pick up the Cadillacs at a discount, not Volkswagens.
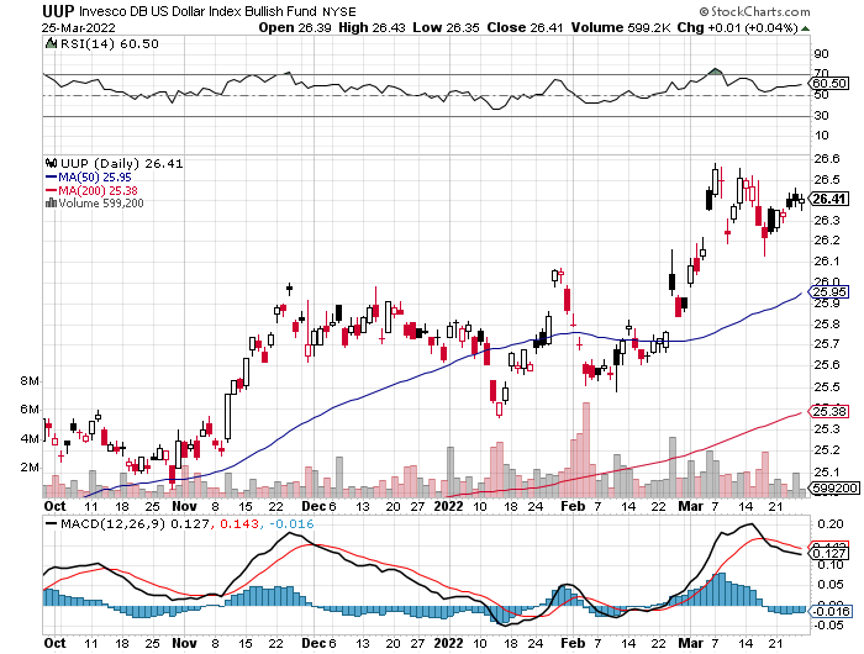
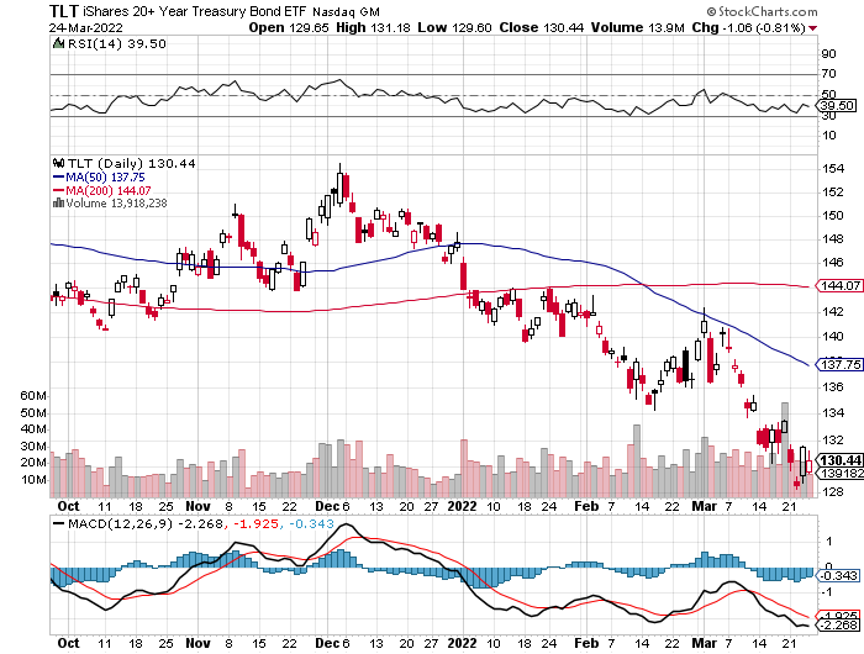
Bonds Crashed, on comments from Fed governor Jay Powell that if he has to raise interest rates by 50 basis points next month, he will. It’s nothing new but it certainly set the cat among the pigeons with bond longs. The (TLT) broke $130, triggering a round of stop losses before it bounced back. The double short (TBT) popped to $21.33. The good news is that this is more than covered by the seven other bond trades we have closed in 2022 that made money. Those who have bond put LEAPS, which is almost all of you, are making a fortune. It looks like my yearend target of a $2.50% ten-year yield may be hit imminently. Keep selling rallies in the (TLT).
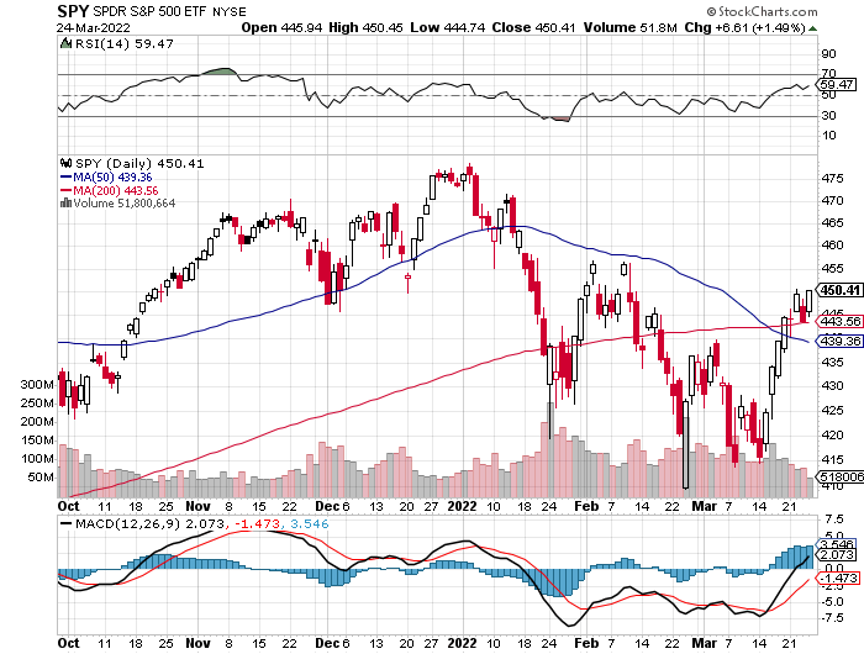
Will the Fed Raise Interest Rates by a Full 1% in April? Our central banks could make such a move at their April 28 confab as they are so far behind the curve, especially if inflation data continues hot. Such a move, or the fear of us, might give us a second shot at a double bottom in stocks at the (SPY) $410 level. Such a move would make your sizeable bond shorts look pretty good.
Recession is Unavoidable Without Russian Oil, says the Dallas Fed. There isn’t enough time to bring alternatives on to the market. The scenario is similar to the invasion of Kuwait in 1991 when we lost 1.5 million barrels a day overnight. This time, it’s 9 million b/d. It all augers for higher oil prices and slower economic growth….unless you drive a Tesla!
Weekly Jobless Claims Lowest Since 1969 at 187,000, down an eye-popping 28,000 on the week. No problems with the economy here. The drop in claims is consistent with a labor market in which employers are desperately trying to hang onto workers and attract new ones.
Berkshire Hathaway Buys Alleghany Insurance for $11.6 billion, taking (BRKB) to yet another new all-time high. Warren Buffet definitely loves the insurance industry, which he uses as a cash cow to fund all his other investments. Alleghany Insurance is in effect a mini-Berkshire, starting out in railroads and evolving into a general investment holding company. Keep buying (BRKB) on dips, a long time Mad Hedge favorite
Tesla Delivers First German Made Model Y, which will enable the company to reach its 1.5 million vehicle target for 2022, up 50%. With an energy crisis in Europe, Tesla will sell these as fast as they can make them. There is currently a one-year wait to get a Model X in the US, and I can sell mine for more than I paid for it three years ago.
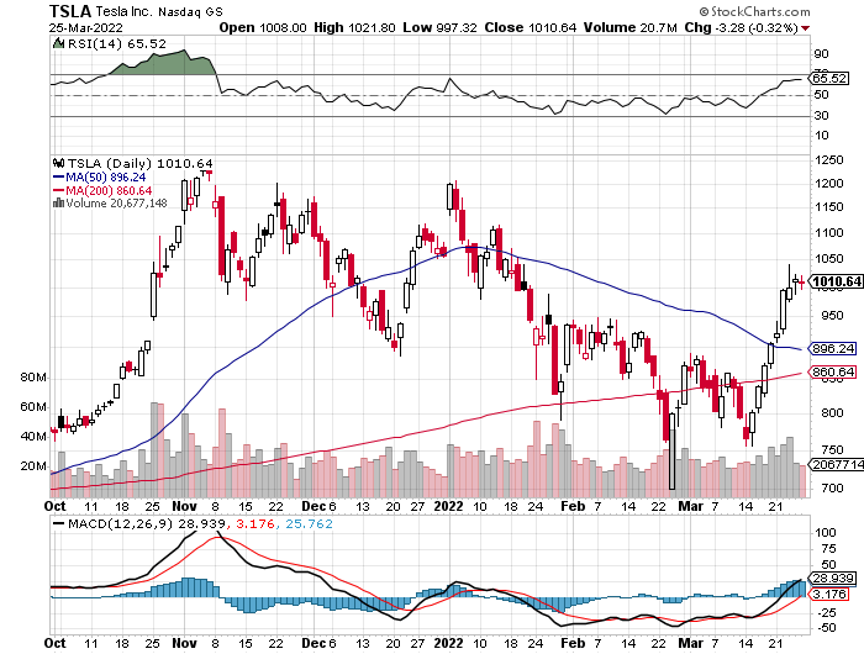
Jeffries Raises Tesla Target from $1,250 to $1,400. It cites a dramatically changed geopolitical environment which sent oil prices through the roof, greatly benefiting all makers of electric vehicles, of which Tesla is far and away the largest. The company is firing on all cylinders, which it actually doesn’t make. Maybe in five years, they will get to my own $10,000 target for Tesla. Buy (TSLA) on dips.
Alibaba Announces Monster Share $25 billion Buy Back, taking the shares up 11%. Could this spell the end of the Chinese stock market crash, with many companies down 80%-90%?
New Home Sales Dive, down 2% to 772,000 in February. Inventories are still very light at 6 months compared to a scant 2-month supply for existing homes. Interest rates are starting to bite, and prices are still soaring, taking the median national price to a new high of $406,600, up 10.6% YOY.
The US to Replace Russian Gas for Germany, some two-thirds by year-end and completely by 2027. It is already on track to supply a record 22 billion cubic feet last year and 50 billion cubic feet by 2030. But the US is at maximum capacity and only major investments will increase supply. More specialized LNG carriers will need to be built and Golar LNG (GLNG) and Flex LTD (FLEX) are the plays there. Buy Chenier Energy (LNG), Tellurian Inc. (TELL), and Sempra (SRE) on dips.
Pending Homes Sales Sink, down 4.1% in February, the fourth straight month of declines. The share of disposable income taken by monthly mortgage payments rose by an incredible 8.3% last month, shutting out buyers. It explains why homebuilder stocks like Lennar (LEN) and KB (KBH) are getting slaughtered.
My Ten-Year View
When we come out the other side of pandemic, we will be perfectly poised to launch into my new American Golden Age, or the next Roaring Twenties. With interest rates still at zero, oil cheap, there will be no reason not to. The Dow Average will rise by 800% to 240,000 or more in the coming decade. The American coming out the other side of the pandemic will be far more efficient and profitable than the old. Dow 240,000 here we come!
With near-record volatility, my March month-to-date performance retreated to a still blistering 12.60%. My 2022 year-to-date performance ended at a chest-beating 27.19%. The Dow Average is down -4.00% so far in 2022. It is the greatest outperformance on an index since Mad Hedge Fund Trader started 14 years ago.
On the next capitulation selloff day, which might come with the April Q1 earnings reports, I’ll be adding more long positions in technology.
That brings my 13-year total return to 539.75%, some 2.10 times the S&P 500 (SPX) over the same period. My average annualized return has ratcheted up to 44.36%, easily the highest in the industry.
We need to keep an eye on the number of US Coronavirus cases at 80 million and rising quickly and deaths topping 976,000 and have only increased by 7,000 in the past week. You can find the data here. Growth of the pandemic has virtually stopped, with new cases down 96% in a month.
On Monday, March 28 at 7:30 AM EST, the Dallas Fed Manufacturing Index is out.
On Tuesday, March 29 at 9:00 AM, The S&P Case Shiller National Home Price Index is published. On Wednesday, March 30 at 8:15 AM, the ADP Private Employment Data is out.
On Thursday, March 31 at 7:30 AM, the Weekly Jobless Claims are printed.
On Friday, April 1 at 8:30 AM, the March Nonfarm Payroll Report is announced. At 2:00 PM, the Baker Hughes Oil Rig Count is out.
As for me, I received calls from six readers last week saying I remind them of Ernest Hemingway. This, no doubt, was the result of Ken Burns’ excellent documentary about the Nobel prize-winning writer on PBS last week.
It is no accident.
My grandfather drove for the Italian Red Cross on the Alpine front during WWI, where Hemingway got his start, so we had a connection right there.
Since I read Hemingway’s books in my mid-teens, I decided I wanted to be him and became a war correspondent. In those days, you traveled by ship a lot, leaving ample time to finish off his complete works.
I visited his homes in Key West and Ketchum, Idaho. His Cuban residence is high on my list now that Castro is gone.
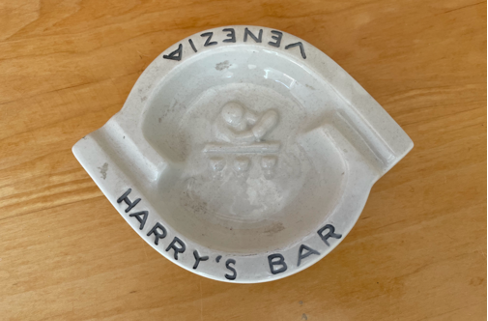
I used to stay in the Hemingway Suite at the Ritz Hotel on Place Vendome in Paris where he lived during WWII. I had drinks at the Hemingway Bar downstairs where war correspondent Ernest shot a German colonel in the face at point blank range. I still have the ashtrays.
Harry’s Bar in Venice, a Hemingway favorite, was a regular stopping off point for me. I have those ashtrays too.
I even dated his granddaughter from his first wife, Hadley, the movie star Mariel Hemingway, before she got married, and when she was still being pursued by Robert de Niro and Woody Allen. Some genes skip generations and she was a dead ringer for her grandfather. She was the only Playboy centerfold I ever went out with. We still keep in touch.
So, I’ll spend the weekend watching Farewell to Arms….again, after I finish my writing.
Oh, and if you visit the Ritz Hotel today, you’ll find the ashtrays are now glued to the tables.
Stay Healthy,
John Thomas
CEO & Publisher
The Diary of a Mad Hedge Fund Trader
https://www.madhedgefundtrader.com/wp-content/uploads/2022/03/harrys-bar.png366488Mad Hedge Fund Traderhttps://madhedgefundtrader.com/wp-content/uploads/2019/05/cropped-mad-hedge-logo-transparent-192x192_f9578834168ba24df3eb53916a12c882.pngMad Hedge Fund Trader2022-03-28 09:02:072022-03-28 13:39:30The Market Outlook for the Week Ahead, or The Unbelievable Market
The Mad Hedge Summit videos are up from the March 14-16 confab. Listen to 24 speakers opine on the best strategies, tactics, and instruments to use in these volatile markets. It is a true smorgasbord of investment strategies. Find the best one to suit your own goals.
The product discounts offered last week are still valid. Start, stop, and pause the videos at your leisure. Best of all, access to the videos is FREE. Access them all by clicking here.
https://madhedgefundtrader.com/wp-content/uploads/2019/05/cropped-mad-hedge-logo-transparent-192x192_f9578834168ba24df3eb53916a12c882.png00Mad Hedge Fund Traderhttps://madhedgefundtrader.com/wp-content/uploads/2019/05/cropped-mad-hedge-logo-transparent-192x192_f9578834168ba24df3eb53916a12c882.pngMad Hedge Fund Trader2022-03-25 09:04:172022-03-25 01:20:46The Mad Hedge Summit Videos are Up
Below please find subscribers’ Q&A for the March 23 Mad Hedge Fund Trader Global Strategy Webinar broadcast from Silicon Valley.
Q: What is the best way to keep your money in cash?
A: That’s quite a complicated answer. If you leave cash in your brokerage account, they will give you nothing. If you move it to your bank account they will, again, give you nothing. But, if you keep the money in your brokerage account and then buy 2-year US Treasury bills, those are yielding 2.2% right now, and will probably be yielding over 3% in two years, so we’re actually being paid for cash for the first time in over ten years. And, as long as it’s in your brokerage account, you can then sell those Treasury bonds when you’re ready to go back into the market and buy your stock, same day, without having to perform any complicated wire transfers, which take a week to clear. Also, if your broker goes bankrupt and you hold Treasury bills, they are required by law to give you the Treasury bills. If you have your cash in a brokerage cash account, you lose all of it or at least the part above the SIPC-insured $250,000 per account. And believe me, I learned that the hard way when Bearings went bankrupt in the 1990s. People who had the Bearings securities lost everything, people who owned Treasury bills got their cashback in weeks.
Q: Is the pain over for growth stocks?
A: Probably yes, for the smaller ones; but they may flatline for a long time until a real earnings story returns for them. As for the banks, I think the pain is over and now it’s a question of just when we can get back in.
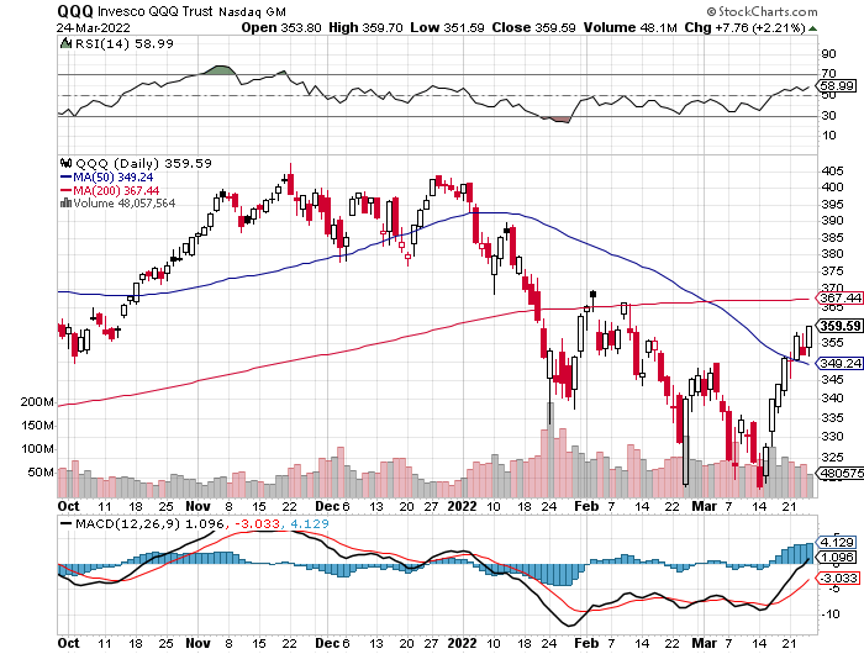
Q: Why did you initiate shorts on the Invesco QQQ Trust Series (QQQ) and SPDR S&P 500 ETF Trust (SPY) this week, instead of continuing with the iShares 20 Plus Year Treasury Bond ETF (TLT) shorts?
A: We are down 27 points in 10 weeks on the (TLT); that is the most in history. And every other country in the world is seeing the same thing. That is not shorting territory—you should have been shorting above $150 in the (TLT) when I was falling down on my knees and begging you to do so. Now it’s too late. If we get a 5-point rally, which we could get any time, that’s another story. It is so oversold that a bounce of some sort is inevitable. I’d rather be in cash going into that.
Q: Do you think Tesla (TSLA) has put in a bottom, or do you still see more downside? Is it time to buy?
A: The time to buy is not when it is up 50% in 3 weeks, which it has just done. The time to buy is when I sent out the last trade alert to buy it at $700. This was a complete layup as a long three weeks ago because I knew the German production was coming onstream very shortly; and that opens up a whole new continent, right when energy prices are going through the roof—the best-case scenario for Tesla. And the same is happening in the US—it’s a one-year wait now to get a new Model X in the US. In fact, I can sell my existing model X for the same price I paid for it 3 years ago, if I were happy to wait another year to get a replacement car.
Q: Will the Boeing (BA) crash in China damage the short-term prospects? And as a pilot, what do you think actually happened?
A: Boeing has been beat-up for so long that a mere crash in one of its safest planes isn’t going to do much. It could have been a maintenance issue in China, but the fact that there was no “mayday” call means only two or three possibilities. One is a bomb, which would explain there being no mayday call—the pilots were already dead when it went into freefall. Number two would be a complete structural failure, which is hard to believe because I’ve been flying Boeings my entire life, and these things are made out of steel girders—you can’t break them. And number three is a pilot suicide—there have been a couple of those over the years. The Malaysia flight that disappeared over the south Indian Ocean was almost certainly a pilot suicide, and there was another one in Germany and another in Japan about 20 years ago. So, if they come up with no answer, that's the answer. It’s not a Boeing issue, whatever it is.
Q: Is John Deer (DEER) or Caterpillar (CAT) a better trade right now?
A: It’s kind of six of one, half a dozen of the other. Caterpillar I’ve been following for 50 years, so I’m kind of partial to CAT, and Caterpillar has a much bigger international presence, but that could be a negative these days in a deglobalizing world.
Q: Apple (AAPL) has really caught fire past $170. Should I chase it here or wait until it’s too overbought?
A: I never liked chasing. Even a small dip, like we’re having today, is worth getting into. So always buy on the dips.
Q: Is Silver (SLV) still a good long-term play?
A: Yes, because we do expect EV production to ramp up as fast as they can possibly do it. Too bad the American companies don’t know how to make electric cars—they just haven’t been able to get their volumes up because of production problems that Tesla solved 12 years ago. So, long term, I think it will do better, but right now the risk-on move is definitely negative for the precious metals.
Q: How low will the iShares 20 Plus Year Treasury Bond ETF (TLT) go in April before the next Fed meeting?
A: I think we’re bottoming for the short term right around here. That’s why I had on that $127-$130 call spread in the (TLT) that I got stopped out of. And I may well end up being right, but with these call spreads, once you break your upper strike, the math goes against you dramatically. You go from like a 1-1 risk profile to like a 10-1 against you. So, you have to get out of those things when you break your upper strike, otherwise, you risk writing off the entire position with 100% loss. As long as Jay Powell keeps talking about successive half-point rate cuts, we will get lower lows, and my 2023 target for the TLT is $105, or about $20.00 points below here.
Q: Do you think we retest the bottoms?
A: Absolutely, yes; it just depends on where the test is successful—with a double bottom or with a retrace of half the recent moves. Keep in mind that stocks go up 80% of the time over the last 120 years, and that includes the Great Depression when they hardly went up at all for 10 years, so selling short is a professional’s game, and I wouldn’t attempt it unless you had somebody like me helping you. You're betting against the long-term trend with every short position. That said, if you’re quick you can make decent money. Most of the money we’ve made this year has been in short positions, both in stocks and in bonds.
Q: Where can we find this webinar?
A: The recording for this webinar will be posted on the website in about two hours. Just log into your account and you’ll find them all listed.
Q: When should I sell my tradable ProShares UltraShort 20+ Year Treasury ETF (TBT)?
A: You don’t have an options expiration to worry about, so I would just keep in until we hit $105 in the (TLT). If you do want to trade, I’d take a little bit off here and then try to re-buy it a couple of points lower, maybe 10% lower.
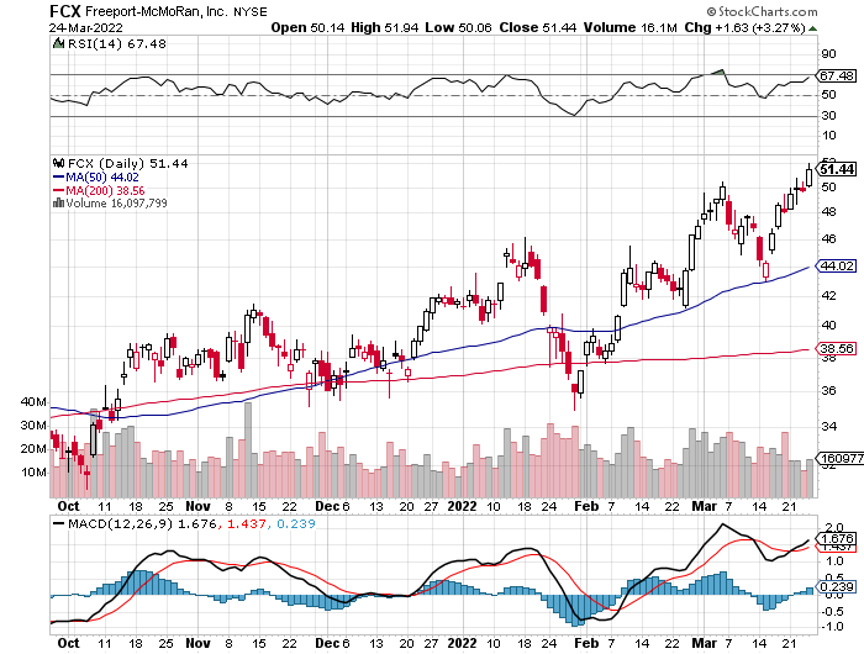
Q: What do you think of a Freeport McMoRan (FCX) $55-$60 vertical bull call spread?
A: The market has had such a massive move, that I’m reluctant to do out of the money call spreads from here unless we get a major dip. So, don’t reach for the marginal trade—that’s where you get your head handed to you.
Q: Will yield curve inversions matter this time and foretell a recession?
A: I think no, because corporate earnings are still growing, and by the summer, we probably will have a yield curve inversion.
Q: There seems to be some huge breakthrough in battery technology where batteries could be recharged within four minutes. I believe it’s the Chinese who have the tech, if so how will that impact on Tesla?
A: Every day of the year someone presents Tesla with a revolutionary new battery technology. It either doesn’t work, can’t be mass-produced, or is wildly uneconomical. So, I’ll confine my bet that Tesla will be able to eventually mass produce solid state batteries and get their 95% cost reduction that way.
To watch a replay of this webinar with all the charts, bells, whistles, and classic rock music, just log in to www.madhedgefundtrader.com, go to MY ACCOUNT, click on GLOBAL TRADING DISPATCH, then WEBINARS, and all the webinars from the last ten years are there in all their glory.
Good Luck and Stay Healthy.
John Thomas
CEO & Publisher
The Diary of a Mad Hedge Fund Trader
https://www.madhedgefundtrader.com/wp-content/uploads/2022/03/john-thomas-in-red-shirt-e1648184714884.png578400Mad Hedge Fund Traderhttps://madhedgefundtrader.com/wp-content/uploads/2019/05/cropped-mad-hedge-logo-transparent-192x192_f9578834168ba24df3eb53916a12c882.pngMad Hedge Fund Trader2022-03-25 09:02:362022-03-25 01:15:57March 23 Biweekly Strategy Webinar Q&A
Legal Disclaimer
There is a very high degree of risk involved in trading. Past results are not indicative of future returns. MadHedgeFundTrader.com and all individuals affiliated with this site assume no responsibilities for your trading and investment results. The indicators, strategies, columns, articles and all other features are for educational purposes only and should not be construed as investment advice. Information for futures trading observations are obtained from sources believed to be reliable, but we do not warrant its completeness or accuracy, or warrant any results from the use of the information. Your use of the trading observations is entirely at your own risk and it is your sole responsibility to evaluate the accuracy, completeness and usefulness of the information. You must assess the risk of any trade with your broker and make your own independent decisions regarding any securities mentioned herein. Affiliates of MadHedgeFundTrader.com may have a position or effect transactions in the securities described herein (or options thereon) and/or otherwise employ trading strategies that may be consistent or inconsistent with the provided strategies.