Passed on by a friend with my apologies in advance:
Well, it's?shit... That's right, shit!
Shit may just be the most functional word in the English language.
You can smoke shit, buy shit, sell shit, lose shit, find shit, forget shit, and tell others to eat shit.
Some people know their shit, while others can't tell the difference between shit and Shinola.
There are lucky shits, dumb shits, and crazy shits.
There is bullshit, horse shit, and chicken shit.
You can throw shit, sling shit, catch shit, shoot the shit, or duck when the shit hits the fan.
You can give a shit or serve shit on a shingle.
You can find yourself in deep shit or be happier than a pig in shit.
Some days are colder than shit, some days are hotter than shit, and some days are just plain shitty.
Some music sounds like shit, things can look like shit, and there are times when you feel like shit.
You can have too much shit, not enough shit, the right shit, the wrong shit or a lot of weird shit.
You can carry shit, have a mountain of shit, or find yourself up shits creek without a paddle.
Sometimes your breath smells like shit.
Sometimes everything you touch turns to shit and other times you fall in a bucket of shit and come out smelling like a rose.
When you stop to consider all the facts, it's the basic building block of the English language.
And remember, once you know your shit, you don't need to know anything else!!
You could pass this along, if you give a shit; or not do so if you don't give a shit!
Well, shit, it's time for me to go.
Just wanted you to know that I do give a shit and hope you had a nice day without a bunch of shit.
But, if you happened to catch a load of shit from some shit-head........... Well, Shit Happens!!!
HOPE YOUR SHITTY DAYS ARE FEW AND FAR BETWEEN
https://www.madhedgefundtrader.com/wp-content/uploads/2013/05/Girl-I-dont-know.jpg189223Mad Hedge Fund Traderhttps://madhedgefundtrader.com/wp-content/uploads/2019/05/cropped-mad-hedge-logo-transparent-192x192_f9578834168ba24df3eb53916a12c882.pngMad Hedge Fund Trader2014-12-02 09:19:342014-12-02 09:19:34The Most Functional Word in the English Language
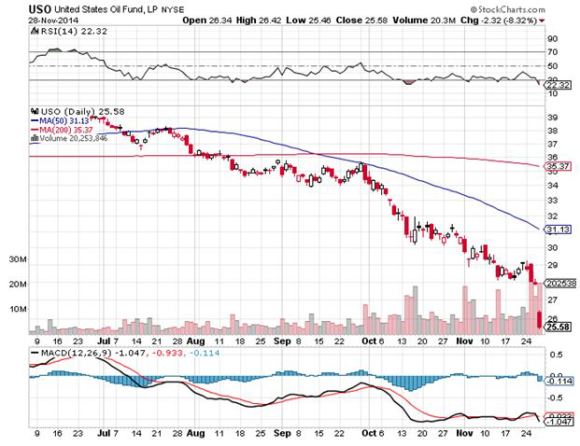
Featured Trade: (CHICAGO TUESDAY, DECEMBER 23 GLOBAL STRATEGY LUNCHEON), (AN IRAN PEACE DEAL AND YOUR PORTFOLIO), (USO), (UNG) United States Oil ETF (USO)
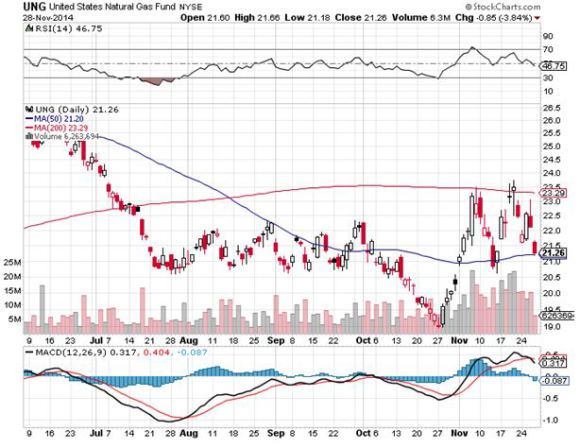
United States Natural Gas ETF (UNG)
https://madhedgefundtrader.com/wp-content/uploads/2019/05/cropped-mad-hedge-logo-transparent-192x192_f9578834168ba24df3eb53916a12c882.png00Mad Hedge Fund Traderhttps://madhedgefundtrader.com/wp-content/uploads/2019/05/cropped-mad-hedge-logo-transparent-192x192_f9578834168ba24df3eb53916a12c882.pngMad Hedge Fund Trader2014-12-01 09:20:202014-12-01 09:20:20December 1, 2014
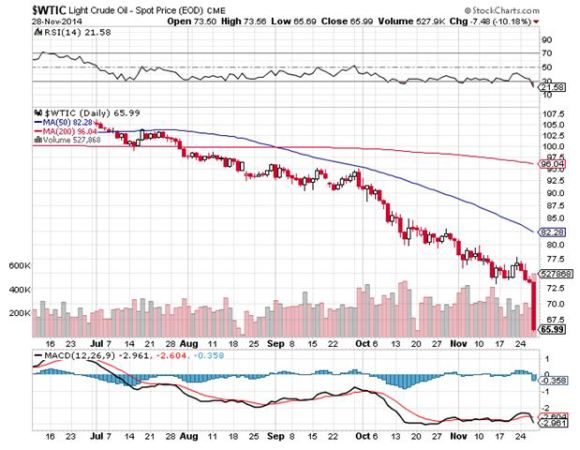
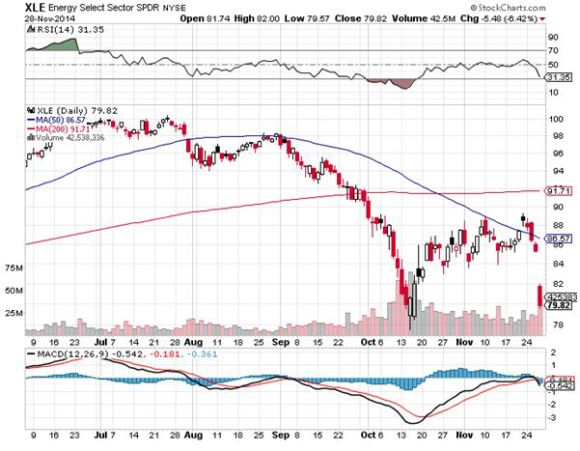
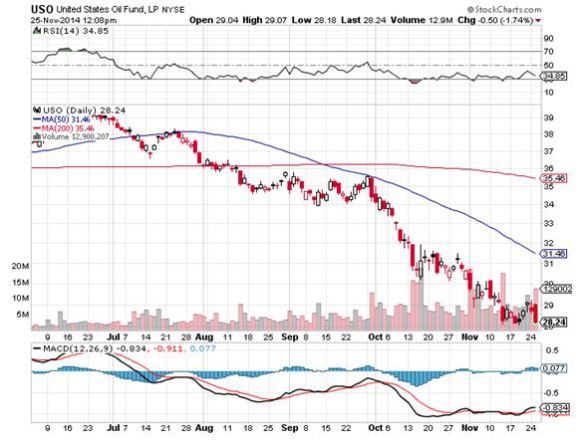
With the price of oil (USO), (XLE) hitting an eye popping $64 this morning, in the wake of the failed OPEC summit in Vienna, it is clear that something long term, structural, and epochal is going on.
But what is it?
We mere mortals are blind to it, but the financial markets haven?t the slightest doubt. Blame the wisdom of crowds. There is something big going on somewhere.
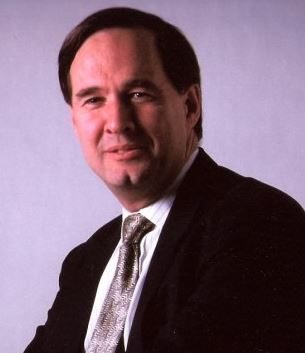
So I thought it would be a good time to check in with my friend and expert on all things international, David Hale, of David Hale Global Economics.
I have been relying on David as my global macro economist for decades, and I never miss an opportunity to get his updated views.
The challenge is in writing down David?s eye popping, out of consensus ideas fast enough, because he spits them out in such a rapid-fire succession.
Since David is an independent economic advisor to many of the world?s governments, largest banks, and investment firms, I thought his views would be of riveting interest. For my last interview with David, please click here.
On November 21, David was on Capitol Hill testifying in front of congress about the implications of a peace deal with Iran. He was kind enough to pass on to me a transcript of his talk.
The Iran nuclear negotiations broke up last week, extending the deadline for the current round by another seven months, to June 2015.
What David had to say was eye opening. If successful, a deal would have momentous implications for not just the US, but the global economy as well.
All trade with Iran ceased in the wake of the overthrow of the Shah of Iran by fundamentalist religious fanatics led by the Ayatollah Khomeini in 1979. The tortuous yearlong Iran Hostage Crisis followed, and relations with the US went into a deep freeze.
US Secretary of State John Kerry certainly has his work cut out for him today. Iran and America deeply distrust each other and philosophically couldn?t be further apart. They have been fighting proxy wars against each other for three decades, both in the analogue and digital worlds.
Remember Stuxnet?
It also doesn?t engender Iranian trust that the US has decimated a half dozen Arab countries in 30 years, and has more than the means to continue on that path, if it so desires.
Now 35 years later, America and Iran oddly find themselves on the same side of the latest Middle Eastern conflict. Sunni extremist forces lead by ISIL has launched a full-scale invasion of Iraq, capturing about one third of the country, and butchering Shiite opponents along the way in true, barbaric, 14th century fashion.
It has not gone unnoticed in Tehran that steady US air attacks against ISIL have meshed nicely with Iranian ground support to accomplish the same, although ?officially? there has been no cooperation whatsoever.
Not surprisingly, nuclear talks between the two countries, long considered a pipedream and simmering on a distant back burner have suddenly come to life.
If successful, a nuclear deal with Iran would have momentous implications, for not just the US, but the global economy as well.
First and foremost, Iran would be able to increase its oil exports by 1 million barrels a day, and then 1.5 million barrels a day over 2-3 years. The deluge could take the price of Texas tea down to $50-$60 a barrel and keep it there for a while.
Such a collapse, down 56% from the June peak, would amount to a $400 billion annual tax cut for the global economy. It would add 0.2% a year of GDP growth for every $10 price drop.
So the boost that we have seen so far amounts to an impressive 1% growth pop. That is an enormous number, increasing the world?s projected economic activity by a full third.
Major energy importers, like Europe, Japan, China, and India would benefit mightily. The US would prosper as well, as one third of its oil still comes from abroad.
It would be a disaster for high cost energy exporters, including Russia, Venezuela, Nigeria, and Canadian tar sands.
Russia, in particular, would get it right between the eyes. Oil and gas account for a whopping 68% of Russian exports and 45% of government revenues. To defend a crashing Ruble, the central bank has embarked on a series of gut wrenching interest rate hikes.
Russia is now looking into the jaws of its own Great Recession. After seeing its economy shrink this year by -0.2%, it could nosedive by at least 5% in 2015.
When they talk about self-sufficiency, they really mean starvation. This is why I have been saying all along that the Ukrainian crisis is going nowhere, except to create buying powers for equity investors.
Venezuela is a basket case, depending on oil for 90% of its exports. Expect hyperinflation, leading to a headline grabbing default on its national debt. Political instability is to follow.
Another big plus for the world economy is the reemergence of Iran as a significant consumer. This is not a small country. It has a population of 78 million and a $369 billion GDP. Sanctions have successfully crippled the economy, shrinking its GDP by -5.8% in 2012 and another -1.9% last year.
The sanctions have not been a one-way street. They have cost the US a not inconsequential $175 billion in sales over the past 17 years. A rebound would lead to a surge of exports of consumer goods (iPhones), and oil drilling equipment to facilitate a long delayed modernization of the industry there.
A major roadblock to peace has been the Revolutionary Guard. Originally an elite group of fighters during the revolution, it has evolved into a modern day Mafia.
It controls the black market, smuggling and a host of other illegal activities, earning billions in illicit profits along the way. It has a vested interest in maintaining the status quo. War with America is good business for them.
Iran is now a classic case of where the government hates us, and the people love us.
To learn more about David Hale and the extensive list of services he offers; please visit the website of David Hale Global Economics, http://www.davidhaleweb.com.
https://www.madhedgefundtrader.com/wp-content/uploads/2013/09/David-Hale.jpg353305Mad Hedge Fund Traderhttps://madhedgefundtrader.com/wp-content/uploads/2019/05/cropped-mad-hedge-logo-transparent-192x192_f9578834168ba24df3eb53916a12c882.pngMad Hedge Fund Trader2014-12-01 09:16:002014-12-01 09:16:00An Iran Peace Deal and Your Portfolio
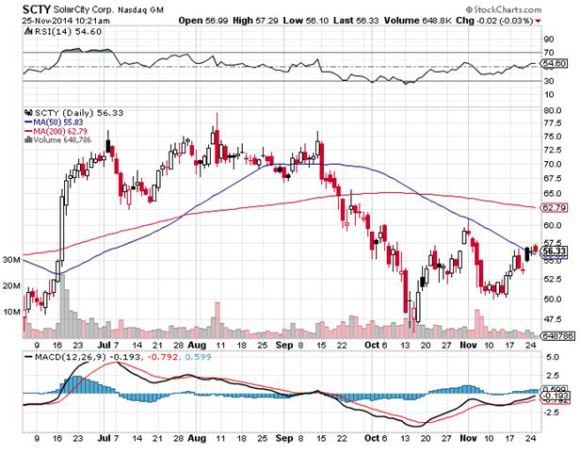
In recent weeks, I couldn?t help but notice the green and white vans of Solar City (SCTY) visiting my neighbors. My trader?s radar went up, so I thought there might be an opportunity here.
What I found made an intriguing investment opportunity. As a preeminent supplier of solar energy, Solar City is a de facto indirect call option on the price of oil, not a bad bet here at $74 and change.
As a huge consumer of capital, the company is a major beneficiary of the prolonged low interest rate scenario which I envision.
A 30% tax credit on any alternative energy investment is set to expire at the end of 2016. I think this will trigger the mother of all stampedes by consumers to buy solar systems while they can still get the government to pick up one third of the tab.
Solar City has also recently completed several high tech acquisitions which will enable it to lower costs while enhancing output efficiencies.
Did I mention that anything Elon Musk Touches turns to gold?
The stock here also looks attractive. Collapsing oil prices had a leveraged effect on (SCTY) shares, dropping a heart stopping 42% in only three months. Heaven knows investors are starved for cheap stocks these days.
This week, (SCTY) poked its nose above the 50 day moving average. If it hold?s then it is off to the races. My only concern here is the volatility that the Thursday OPEC meeting in Vienna is certain to bring to energy markets.
With my second Tesla (TSLA) about to be delivered, the Model X SUV, it was time for me to review my electricity bill.
My first Tesla, a very early Model S-1 (chassis number 125), boosted my monthly power consumption from 600 kWh to 1,800 kWh per month, about what a small industrial facility might use.
Yet, my bill from PG&E increased from only $350 to $450 a month. This is because they effectively give away power for free from 12:00 AM to 7:00 AM to qualified EV users, charging me only a scant 4.7 cents per kWh.
On my suggestion, Tesla then upgraded their software so vehicles could be programmed to recharge only at these hours. That means it is costing me $4.00 for a full 80 kWh charge that can take me 255 miles, or 1.6 cents a mile. That doesn?t include the enormous savings on maintenance (there is none).
Well then! The IRS currently allows a mileage deduction of 56 cents per mile for business purposes, so that?s an opportunity to exploit right there.
Given that the average US car now gets 25 miles per gallon of gasoline (and that is being generous), that means my equivalent cost for running my S-1 works out to paying a scant 40 cents a gallon.
This compares to the $2.79 at the local service station ($2.57 at Costco), which is at a four year low, or a savings of 86%. That is a little more than I paid for gas when I first started driving a beat up VW Bug at the Santa Anita Race Track parking lot back in 1967.
That sounds like a deal to me.
However, the second Tesla is likely to boost my monthly power consumption from 1,800 kWh to 3,000. When PG&E sees bills that big, they assume someone is operating an illegal marijuana grow house and send the DEA to kick your door down at 5:00 AM on a Monday morning.
So I was on the phone to Solar City the next morning. What I heard was nothing less than amazing.
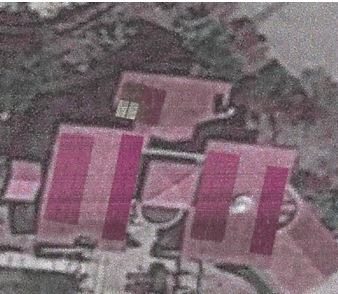
For a start, they called up a Google Earth mapping program that focused on a picture of my roof from a low earth orbit satellite (Google has invested $280 million in Solar City). Then a second program autofits their existing solar panels to my roof and spit out a mass of numbers.
This complete stranger told me things about my roof that I never knew, like it was 4,000 square feet of flat concrete tiles on 14 planes. Welcome to the 21st century.
I nervously looked down and made sure my fly was fully zipped up.
He went on to tell me that he could fit a 15 kW DC system on my roof that would generate 106% of my power needs, generating 19,365 kWh a year. That would make me completely self sufficient in electricity, even though I will be charging two hulking Tesla 1,000 pound lithium ion batteries every day.
They will install a ?net? two-way electric meter on my house. When the sun shines, it will run backwards as I can sell power to PG&E at high prices. So many people are doing this now that the traditional afternoon price spike in electricity had virtually disappeared.
At night, when I recharge my cars, I would then buy cheap power from Solar City. No storage devices are required. The PG&E grid is effectively the storage system. That would turn me into a day trader of electricity, selling high by day and buying low by night. I love it!
How did their satellite know I was a hedge fund trader? What else does it know?
Now comes the best part. The cost of the installation and panels was $66,000. Solar City would do it for free. Yes, free, as in gratis, with no money down.
They would lease me the panels for 20 years, with an annual price increase of 6.2%. That would cut my monthly electricity bill from $450 to $200. It does this by eliminating the tier 3, 4, and 5 prices I am currently paying PG&E.
If I sell my house, I can either buy out my contract at the discounted, fully depreciated value, or pass it on to the new owners. It is well known that solar panels significantly increase the value of existing homes.
Installation can be done in a day. But it can only take place on unbreakable concrete tile roofs. Those made of clay tiles, metal, tar and gravel, wood shakes, or slate don?t work for various reasons. You need a FICO score of 680 or better to qualify. There is a 60-day waiting list to get this done.
It didn?t take me long to figure out the game here. By purchasing the panels and leasing them to me, they keep the 30% government subsidy for capital investments in alternative energy, which works out to $19,890 for my house alone. Solar City also gets to depreciate these panels on an accelerated schedule, mostly in the first five years.
This explains why Solar City has grown larger than the next 15 competitors combined. Solar City?s largest customer is the US Army, which has already installed panels on 1 million structures.
There is one cautionary note to add here. The government subsidies that help float the company expire in 2018, making the entire proposition financially less attractive. That is, unless they get renewed. Think President Hillary.
The only things that would save them are dramatically higher conventional energy costs. However, right now energy costs are heading the opposite direction, thanks to fracking and a well-publicized war for market share at OPEC.
As with everything else Elon Musk touches, an investment in Solar City has been wildly successful. Since the company went public at the end of 2012, the shares have risen by an awesome 670%. Needless to say, with no earnings, and no dividend, the $5.5 billion market cap company may appear hopelessly expensive.
Like with Elon?s other company, Tesla, you aren?t betting on the value of the business today, but where it will be in five years, when it has a far larger share of the market.
Given Musk?s track record so far, that is a bet that I am willing to take.
It?s Been a Long and Winding Road Driving From this?
To This
There?s a Profit in Here Somewhere
https://www.madhedgefundtrader.com/wp-content/uploads/2014/11/Solar-Shields-e1416930698610.jpg274400Mad Hedge Fund Traderhttps://madhedgefundtrader.com/wp-content/uploads/2019/05/cropped-mad-hedge-logo-transparent-192x192_f9578834168ba24df3eb53916a12c882.pngMad Hedge Fund Trader2014-11-26 01:03:252014-11-26 01:03:25Loading the Boat with Solar City
?I don?t know who spends more, Democrats or Republicans, but Democrats seem to enjoy it more,? said former Federal Reserve governor, Bob McTeer.
https://www.madhedgefundtrader.com/wp-content/uploads/2013/05/Money-100-Bills.jpg262261Mad Hedge Fund Traderhttps://madhedgefundtrader.com/wp-content/uploads/2019/05/cropped-mad-hedge-logo-transparent-192x192_f9578834168ba24df3eb53916a12c882.pngMad Hedge Fund Trader2014-11-26 01:02:022014-11-26 01:02:02November 26, 2014 - Quote of the Day
Featured Trade: (THE YEAREND MELT UP HAS STARTED!), (SPY), (TLT), (BAC), (FXE), (FXY), (EUROPEAN STYLE HOMELAND SECURITY), (TESTIMONIAL)
SPDR S&P 500 ETF (SPY) iShares 20+ Year Treasury Bond (TLT) Bank of America Corporation (BAC) CurrencyShares Euro ETF (FXE) CurrencyShares Japanese Yen ETF (FXY)
https://madhedgefundtrader.com/wp-content/uploads/2019/05/cropped-mad-hedge-logo-transparent-192x192_f9578834168ba24df3eb53916a12c882.png00Mad Hedge Fund Traderhttps://madhedgefundtrader.com/wp-content/uploads/2019/05/cropped-mad-hedge-logo-transparent-192x192_f9578834168ba24df3eb53916a12c882.pngMad Hedge Fund Trader2014-11-25 01:06:232014-11-25 01:06:23November 25, 2014
Any doubts that my bullish call on global risk markets would play out as promised were blown away on Friday.
That was when the central banks of China and Europe delivered a surprise, one two punch of monetary stimulus for their own troubled economies. The quantitative easing baton has successful been passed from America?s Federal Reserve to central bankers abroad.
The net net for you and I is that stocks and the dollar will continue to appreciate.
Specifically, China came out of the blue with a 0.4% interest rate cut, thus stimulating the world?s largest emerging market.
Then the European Central Bank?s president, Mario Draghi, said he would take whatever steps necessary to return the continent to a 2% inflation rate, up from today?s 0.40%. Unbelievably, Spanish ten-year bond yield fell below 2% in a heartbeat and German ten year funds pierced 0.80%.
For good measure, the Japanese central bank then chimed in, boosting the country?s money supply growth by 33% as promised earlier. Saying is one thing, but doing it is much better, especially when it carries a radical tinge.
The measures make my 2,100 target for the S&P 500 by the end of December a pretty safe bet. Look for a tedious, prolonged sideways grind, followed by rapid headline driven pop. Easy entry points will be few.
It really is one of those ?Close your eyes and buy? type of markets. I doubt we get pullback of less than 3% in the major indexes this year. Volatility will remain muted. All the black swans of landed.
It gets better.
This kind of market action could continue for another three years. After the ?Great Recession?, we are now witnessing the ?Great Recovery?. That means returning to a 3% or better GDP growth rate and 10% annual corporate earnings increases.
Add in 2% a year in dividend yields, and you get a (SPY) that rises by 10% a year. Look at the 100-year average gain for stocks and it comes in remarkably close to this number. Factor in an earnings multiple increase from the current 16, and they will rise faster.
This is all Goldilocks on steroids. Interest rates, the cost of labor, energy, and commodity price inputs stay low, earnings rise, and everybody else in the world sends their money here because it is the best bet going.
I all works for me, and I hope, you too!
It All Works for Me!
https://www.madhedgefundtrader.com/wp-content/uploads/2014/08/John-Thomas-Beach-e1416856744606.png400276Mad Hedge Fund Traderhttps://madhedgefundtrader.com/wp-content/uploads/2019/05/cropped-mad-hedge-logo-transparent-192x192_f9578834168ba24df3eb53916a12c882.pngMad Hedge Fund Trader2014-11-25 01:05:412014-11-25 01:05:41The Yearend Melt Up Has Started!
Featured Trade: (TRADING THE KENNEDY ASSASSINATION)
https://madhedgefundtrader.com/wp-content/uploads/2019/05/cropped-mad-hedge-logo-transparent-192x192_f9578834168ba24df3eb53916a12c882.png00Mad Hedge Fund Traderhttps://madhedgefundtrader.com/wp-content/uploads/2019/05/cropped-mad-hedge-logo-transparent-192x192_f9578834168ba24df3eb53916a12c882.pngMad Hedge Fund Trader2014-11-24 01:04:382014-11-24 01:04:38November 24, 2014
Legal Disclaimer
There is a very high degree of risk involved in trading. Past results are not indicative of future returns. MadHedgeFundTrader.com and all individuals affiliated with this site assume no responsibilities for your trading and investment results. The indicators, strategies, columns, articles and all other features are for educational purposes only and should not be construed as investment advice. Information for futures trading observations are obtained from sources believed to be reliable, but we do not warrant its completeness or accuracy, or warrant any results from the use of the information. Your use of the trading observations is entirely at your own risk and it is your sole responsibility to evaluate the accuracy, completeness and usefulness of the information. You must assess the risk of any trade with your broker and make your own independent decisions regarding any securities mentioned herein. Affiliates of MadHedgeFundTrader.com may have a position or effect transactions in the securities described herein (or options thereon) and/or otherwise employ trading strategies that may be consistent or inconsistent with the provided strategies.