Featured Trades: (THE BEAR CASE FOR OIL), (USO), (DUG)
3) The Bear Case for Oil. Let's do some out of the box thinking here. Let's say that the global economy is really slowing down. The demand for oil will fall. Let's say that China continues to raise interest rates, slowing its economy further. Then Chinese oil demand starts to wane.
Then we bring on stream new US onshore supplies opened up by advanced technologies in places like the Bakken field in North Dakota. Then current high prices at the pump deliver a summer driving season that is a shadow of its former self. Next, the exchanges get religion and decide to damp down speculation in earnest by raising margin requirements on oil.
Now, let's thrown in an outlier. Muammar Khadafi chokes to death on a bad falafel, bringing the Libyan civil war to an immediate end, and unleashing 1.2 million barrels a day of light crude on the European market.
What I have just outlined here is a perfect storm for oil prices. It's not that these are low probability events. They are in fact the most likely scenario that will unfold over the next three months. And they are all likely to hit at the same time, taking crude down to the bottom of the last year's range of $84/barrel.
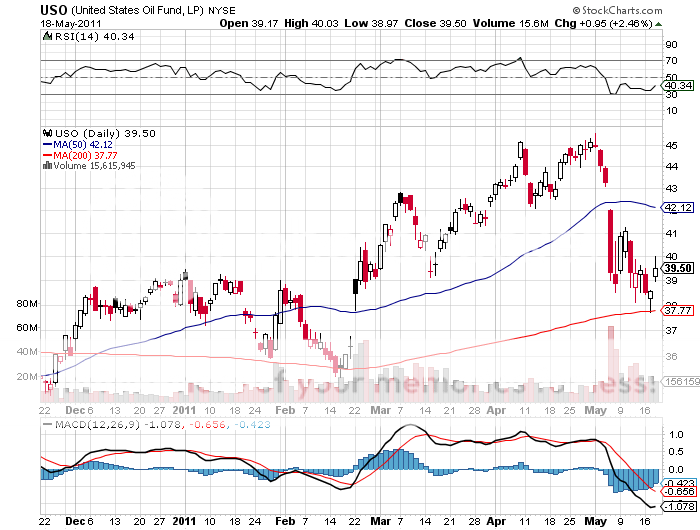
So I think that it is prudent here to start adding some short exposure for oil. Selling short the US Oil Fund (USO) might be a good idea, which has one of the worst tracking errors in the ETF world, and never fails to rob investors blind. Play this from the short side, and these gross inefficiencies work in your favor. When I employed this strategy through the put options in March, I scored a near double in just five days.
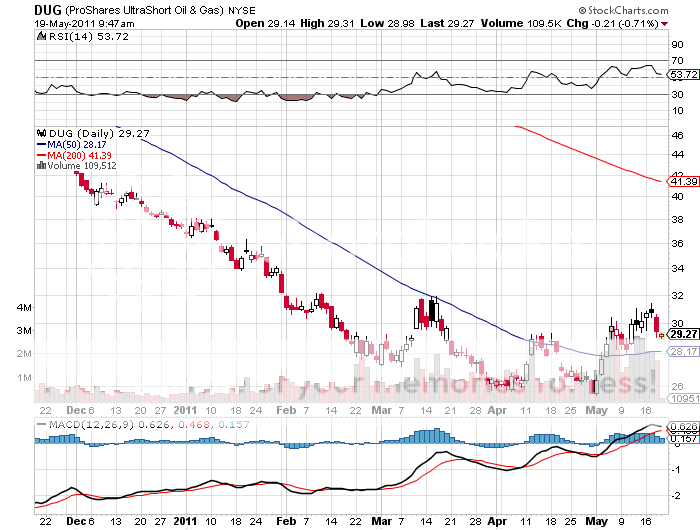
Just to add a little kicker to your short oil play, you might buy the (DUG), a -2X inverse short ETF on the oil majors now trading at $29.25. Falling oil prices will lead to plunging oil company profitability, shrinking PE multiples, and sharply declining stock prices, all of which work in favor of (DUG). Throw in a broader global risk off trade, and this thing works with a turbocharger.
-
-