?It is not my job to guarantee financial stability,? said outgoing European Central Bank President, Jean Claude Trichet.
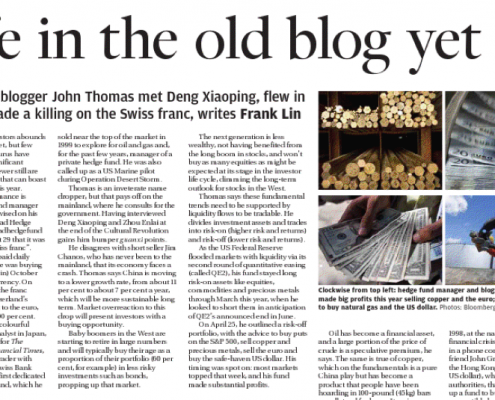
I certainly made a splash during my recent visit to China, where the local press covered me like a visiting rock star. I guess personally knowing the founders of the modern People?s Republic and being one of the few westerners to survive the Cultural Revolution 40 years ago, didn?t hurt.
To read the full page coverage in the South China Morning Post detailing my current market views across all asset classes, Hong Kong?s leading daily, please click here. Of course you, as regular paid up and card carrying subscribers, were emailed these views weeks and months ago and have already made a ton of money from them. And Bono, eat your heart out!

?How to dress for a riot?? was the question I found myself facing as I prepared to depart for an ?Occupy San Francisco? demonstration and march in San Francisco on Saturday morning. I settled for Levis, Nike?s, a black T-shirt, a black and orange San Francisco Giants baseball cap, and a great big handkerchief in my back pocket for the tear gas. In other words, I looked like an undercover cop. Maybe at least the riot police would think twice before beating my brains out, like they were doing across the bay in Oakland.
The march marshaled at Justin Herman Plaza in front of the Ferry Building, and it was d?j? vu for me all over again. This was exactly where I joined a 100,000 strong anti-Vietnam War demonstration 40 years ago. At 2,000, today?s group was more modest in size, but just as devoted to the cause, and just as angry.

Of course, whenever you organize a march of any kind in San Francisco, at least 20 other groups from every political description will automatically join the party. These include gay rights, Lincoln Log Republicans, transvestites, traditional unions, 1930?s Bolsheviks and Trotkyites, died in the wool socialists, animal rights activists, Greenpeace, the Sierra Club, and Save the Whales.
Some defied descriptions as members of the human race. To make the day even more bizarre, many demonstrators were dressed as zombies and vampires because Deadmaus was hosting a Halloween party at the Bill Graham Auditorium afterwards. Maybe they were emulating our zombie banks? The City by the Bay is nothing, if not diverse.

So it took some work to separate out the broad strands of the real movement. I walked with and spoke to about 30 of the participants. I was expecting to hear a lot of ludicrous leftist conspiracy theories and crackpot economic theories one often finds on the Internet. I was completely wrong.
I gave everyone an impromptu quiz, attempting to ascertain their level of understanding of financial issues. For the suspicious few who thought I might be an undercover policeman, I flashed my membership card from The Foreign Correspondents Club of Hong Kong, telling them I was a journalist, and they opened right up.
I found the group amazingly well informed, with a majority holding undergraduate and graduate degrees. Almost everyone could accurately describe the Glass-Steagall Act of 1933, which separates investment and commercial banking functions, and was repealed in 1999 after a billion dollar lobbying effort by the industry. This was the reregulation that handed the banks a pistol to commit suicide while holding your money.
I heard a lot about too-big-to-fail, bail outs for the banks, huge pay packages for the executives of failing firms, and a bull market on Wall Street that never made it to Main Street. Many talked about privatizing profits and socializing losses.
The rich were a natural target, soaking up most of the new wealth that has accrued in the United States over the last 30 years with minimal tax rates, either through stock options or inheritances, while the fortunes of the middle class have declined. And now, congress wants to raise the tax burden for working people. You can argue all day about whether it is right or wrong, but you can?t deny the absolute numbers. Many described this as our own Arab Spring. Indeed, I found that quite a few of their data and arguments could have been lifted out of my own newsletter.

Surprisingly, many were angry with President Obama for selling out to Wall Street and special interests. In fact, about 80% of their complaints mirror those that I have heard at Tea Party rallies. Their only real difference is on the moral issues of gay marriage and the right to life.
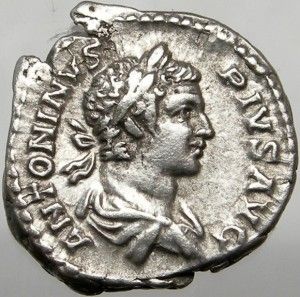
Students of history will tell you that every time too much wealth has accumulated at the top of a society, a revolution has resulted. This led to the fall of the Roman Empire, the French Revolution, the Russian Revolution, and even as recently as the Arab Spring and the Libyan Civil War. At the rate that local budgets and benefits were being chopped, which I have been writing extensively about for the last three years, I knew that large scale civil unrest was just a matter of time. The surprise is that it took this long to explode. Who knew it would go global, thanks to Facebook.
The political implications of all this are interesting. If it survives the winter and snowballs into the spring, it could become a major factor in the 2012 presidential election, like the Tea Party was in 2010. And let?s face it, this is definitely not a pro-Republican Party movement. It all reminds me of another revolution that faced the test of a long winter ordeal in order to survive, the one that started in Boston in 1776.

There were about 100 of San Francisco?s finest escorting the parade, blocking off the streets from traffic as we made our way across town. I spotted one obvious former jarhead and spoke to him in the familiar jargon unique to the Marine Corps, asking what his orders were. He opened up like a cheap bag of coffee beans from Costco.
Keep the peace, and only get involved if there was a destruction of private property. No one was in riot gear. We were in the middle of a mayoral election in San Francisco, and if the incumbent wins, the current chief of police, a local guy admired by the officers on the beat, will get reappointed. It is so true that all politics is local. My handkerchief would stay in its pocket.
On my way back to City Hall, where I parked to get a free electric charge for my new Nissan Leaf, I dropped in at Neiman Marcus to see if they had any Brioni suits in a size 48 long, a copy of The Socialist Workers Party prominently sticking out of my back pocket. I was sadly informed that there was only one of that elephantine size in the country, in Virginia.
What a long and winding road it has been.

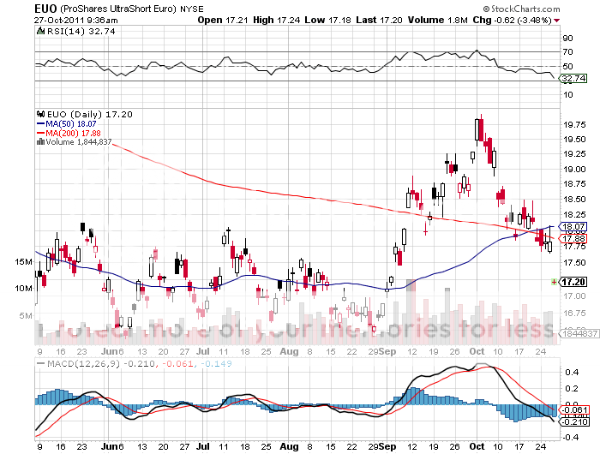
Macro Millionaires made an instant killing on the collapse of the Euro today, scoring a one day gain of 58% from the Friday close. Those who bought the double leveraged short Euro ETF, the (EUO), scored an immediate 6.5% profit. Thanks to these red hot trades, Macro Millionaires are now up nearly 44% in their virtual hedge funds year to date. The Month of October came in at a healthy 4%, following a blistering 17.19% in September.
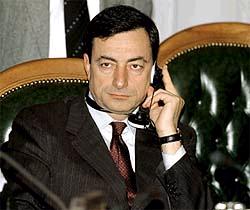
Traders are betting that the new European Central Bank President, Mario Draghi, will make the institution?s first intelligent move of the year on Wednesday by slashing interest rates. If Draghi has the cajones to make such a bold move, it will lead to an immediate tidal wave of selling of the European currency.
We also got an assist from my old friends at the Bank of Japan, which finally, decisively intervened with a massive sale of $130 billion in the foreign exchange market, knocking their own ridiculously overvalued currency down an impressive ?4 to ?79 and change. Suddenly, central bank action to weaken your own currency has become respectable.
I will swear on a stack of Bibles that I had the trade alert written to short the yen on Friday, but didn?t have the time to send it out. Regular listeners to my biweekly webinars are well aware of my antipathy towards the yen, it was only a matter of time before it took its dive. You can?t catch them all.
This marks the 20th consecutive profitable trade for Macro Millionaires. For those who wish to participate in Macro Millionaire, my highly innovative and successful trade mentoring program, please email John Thomas directly at madhedgefundtrader@yahoo.com . Please put ?Macro Millionaire? in the subject line, as we are getting buried in emails. Hurry up, because our software limits the number of subscribers, and we are running out of places.


I?m sitting here with a mountain of technical analysis reports that are causing my desk to buckle this morning, all shouting ?breakout?, ?buy?, and ?uptrend?. So I?m wondering, ?is there a scenario out there where these might actually come to pass??
At this point I thought it might be useful to engage in what Albert Einstein called ?thought experiments? and come up with a New Theory of Everything. In any case, you have probably all figured out that I am a frustrated novelist. As my old friend and former mentor, Sherlock Holmes, used to say, ?Eliminate the obvious, and consider all other possibilities.?
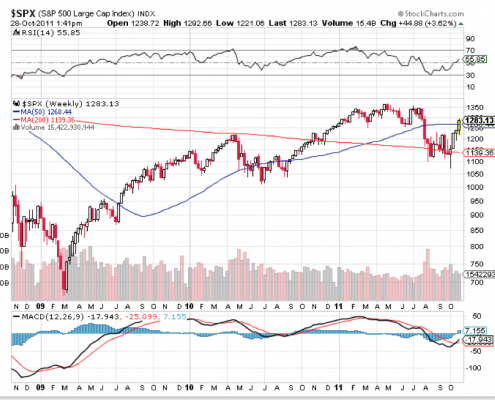
First, let?s see how we got here. It was obvious to me that the market was overdue for a huge short covering rally that would take the index up 20%-27% off the lows (see my early September piece ?My Equity Scenario for the Rest of 2011?). That?s why I entitled my October 8 webinar ?The Short Game is Over.?

That is exactly what we got. Corporate earnings came in much better than traders expected, triggering a huge rush by underperforming managers to bring in some decent numbers by year end. We hit my target of the 200 day moving average at 1,275, a gain of 19.7%, and saw the second best month in stock market history.
Enter black swan number one. Last week, the hedge fund community established heavy short positions expecting a complete breakdown of the European sovereign debt crisis talks. But the bar was set so low they could only succeed. Ten minutes before midnight, we received an unexpected news flash about a comprehensive three part deal that was clearly a major leap forward. The Dow futures immediately gapped up 200 points in the overnight market.
That delivered the massive short covering rally on huge volume that generated all the technical green lights now on my desk. Conventional active managers panicked and stampeded to address substantially underweight positions which they achieved only recently at the market bottom.
So what happens next? In a few weeks, the Supercommittee reaches its deadline for achieving comprehensive budget balancing targets. Guess what? The hedge fund community is setting up large short positions in the run up to that day, betting that intransigent Republicans will refuse to agree to any tax hikes whatsoever, automatically triggering huge, deflationary spending cuts. The bet is that a market crash is a guaranteed outcome, similar to the one that followed the debt ceiling debacle in July.

Enter black swan number two. A smiling and deeply tanned John Boehner appears in front of the cameras at ten minutes to midnight, announcing that ?he went the extra mile? and ?reached across the aisle? and resurrected the $4 trillion deal he almost reached with Obama last summer before the Tea Party stabbed him in the back. The Dow futures immediately gap up 200 points in the overnight market, and a monster rally ensues, taking the S&P 500 up to its 2011 high of 1,367 by year end.
We then go into January with a market that looks very toppy and expensive. Active managers and talking heads complain bitterly that this is all short covering not justified by the fundamentals. But hey, a dollar made a short covering market buys just as much Jack Daniels at the bar as one made from long only buying. Hedge fund managers bet the ranch that a new market crash is coming, taking it back down to the bottom of the range 300 points lower. Traders are salivating at the prospect of making a killing, and active managers hurriedly move to underweight positions again.
Enter black swan number three. The People?s Bank of China announces in a carefully worded statement that its campaign to end rampant real estate speculation has finally succeeded. Developers have been seen cutting prices on new apartments coming on the market as much as 25%. As a result, the risks to the Chinese economy are now to the downside, and the central bank immediately cuts interest rates by 0.5%.
The Dow futures immediately gap up 200 points in the overnight market as the mother of all short covering rallies explodes. Commodities, like copper, coal, platinum, and palladium go through the roof. BHP Billiton (BHP), Joy Global (JOYG), Freeport McMoRan (FCX), Union Pacific (UNP), and Caterpillar (CAT) go bid only. Oil soars. The S&P 500 touches a new all-time high at 1,565. A major hedge fund manager jumps off the top of the Empire State building and crashes into a taxi on 5th avenue driven by an immigrant Nigerian taxi driver. His pockets are fill with trade confirms showing gigantic short covering losses. There is a twisted grin on his face.
OK, the Nigerian taxi driver was a bit much. But I will tell you one thing for sure. This flock of black swans absolutely has not been discounted by the market, and has a much higher probability than the market?s many armchair strategists, pundits, and seers realize.
Personally, I put the odds of all this unfolding at one in three. If we do manage to claw our way up that high, we will be at the top of a 13 year range for the market. Then the greatest shorting opportunity of a generation will be on the table because the Great Crash of 2012-2013 will be just around the corner.

Market observers were stunned, amazed, and gob smacked when trading volumes surged with the 300 point move in the Dow last Thursday. Are retail investors at last making a long awaited return to the stock market? Have they broken with tradition and started buying a bottom, instead of a top?
Not a chance. Much of the volume spike can be traced to the obscure mathematics of credit default swaps. These are in effect insurance policies to guard against a default by individual securities, like Greek, Italian, Spanish, or Portuguese sovereign bonds.
Part of Europe?s triple resolution to its sovereign debt crisis involved an implied guarantee of the value of Greek bonds at 50% of their face value. This means that they will never go to zero, and therefore not meet the contractual definition of ?default?. This renders the value of Credit default swaps on these securities worthless.
The implications of this are huge. For a start, it means that all of the hedge funds that sought to profit from the imminent collapse of Europe through buying credit default swaps have suffered huge losses. We probably won?t hear about these losses until the hedge funds report their year ends in December and January. My bet is that the accounting behind the marks to market will reach new heights of creativity.
More importantly, the banks that issued these swaps have, on paper, just made a ton of money, because their shorts also became worthless. But to realize those windfall profits they have to unwind the risk reducing hedges behind them.
A perfect hedge for a credit default swap on a Greek bond is to sell short the underlying security. But this is easier said than done with illiquid, difficult to borrow paper. Besides, who wants to go short paper with a 30% yield?? The cost of carry would kill you. So the issuing banks crafted a series of clever algorithms based on historic correlations with other lower yielding and more liquid securities, like the bonds of other nearby countries, European equities, and yes, you guessed it, US large cap stocks, far and away the most liquid of these alternatives.

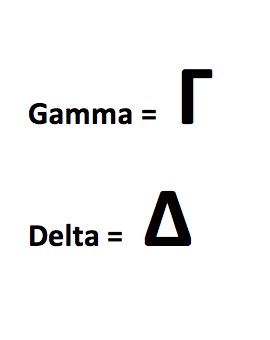
Using the arcane argot of the options world, which is described in ancient Greek letters (no kidding!) the banks had to suddenly adjust for a large change in their gamma, the rate of change on the delta of their positions. And as I?m sure you all know, the delta is the rate of change of an options relative to the underlying stock. For those of you who don?t have a math PhD from MIT, this challenge can only addressed in one way, through buying truckloads of American stocks, and pronto!
So if you client, your boss, or your wife asks you why the market was up, just tell them that hedge funds were rebalancing their gammas to stay delta neutral. If they ask what the hell gamma is, just tell them to look it up on Wikipedia.
"When you run in debt, you give to another power over your liberty,? said Benjamin Franklin.
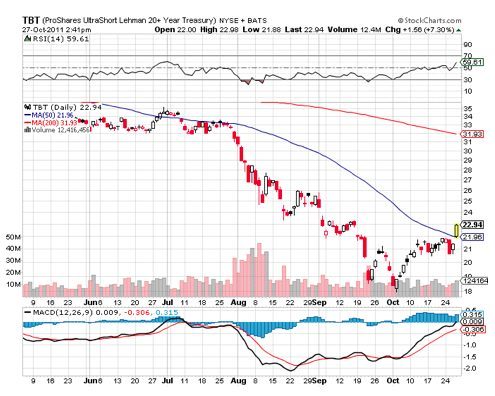
The abject failure of yesterday?s seven year Treasury bond auction and the crash that ensued has enabled the year-to-date return for my Macro Millionaire trade mentoring program to soar to a new all-time high of 43%. The 30 year bond plunged a staggering six points from the previous day?s high. Yields on ten year government paper have ratcheted up 50 basis points in just a few weeks, from 1.80% to 2.38%.
It?s a good thing that my only position going into the collapse was a major holding in the (TBT), an ETF that profits most from exactly this type of scenario, which rocketed some 10% today. Using the leverage embedded in this popular ETF, some 40% of our capital is devoted to short Treasury bond positions. This move comes on the heels of my October 8 call to cover all shorts in ?RISK ON? assets, including stocks, commodities, oil, and foreign currencies, with a major fall rallies imminent.
For those who wish to participate in Macro Millionaire, my highly innovative and successful trade mentoring program, please email John Thomas directly at madhedgefundtrader@yahoo.com . Those who currently subscribe to just the newsletter and want to upgrade to Macro Millionaire to get my trade alerts can get full credit for the remainder of their subscription. Please put ?Macro Millionaire? in the subject line, as we are getting buried in emails. Hurry up, because our software limits the number of subscribers, and we are running out of places.

The financial markets exploded to the upside overnight with news of Europe?s triple resolution of their sovereign debt crisis. As I predicted in my letter only yesterday, the move has caught traders by surprise, enabling markets to break out to the upside from the recent ranges, and give this fall rally longer legs than most expect.
As I write this piece, the (SPX) futures have popped to 1275, a new high for this move. Ten year Treasury yields have ratcheted back up to 2.26%, and the dollar is in full flight against a basket of currencies. Here are the details in summary:
*Capital for the European Financial Stability Fund will be increased to ?1 trillion.
*Greek debt will be written down 50%, halving the country?s debt to GDP ratio in one fell swoop.
*European bank capital ratios must be raised from 6% to 9% by June next year.
The package raises more questions than it answers. It delivers less than what the optimists were hoping for, but more than what the pessimists dreaded. You really have to wonder where banks are going to raise $120 billion in private capital in this environment. As a result, Asian sovereign debt funds will probably end up owning large stakes in European banks at fabulous discount prices.
While the cut in Greece?s debt load to only 120% of GDP is welcome, it offers no clear path on how the beleaguered country is going to cope with the heavy burden of the remaining balance. Of course, the deal is a total home run for the Chinese, who I have been advising to load up on as much Greek debt as possible at 30 cents on the dollar. This is only the first chapter in what is likely to become an epic restructuring of the European economy and financial system. Much work lies ahead, and many more gut churning headlines lie in our future.
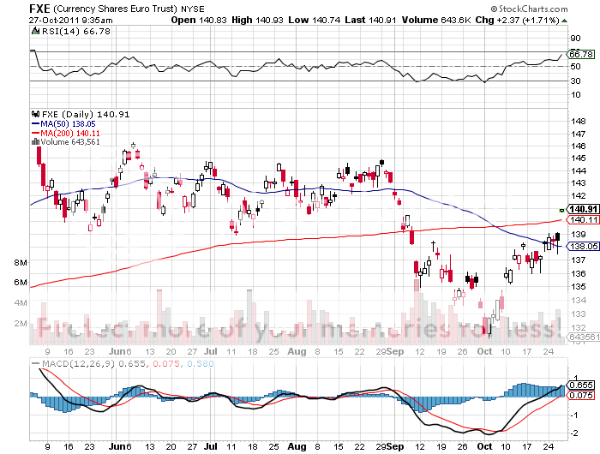
The move has triggered a ?feel good? rally for the European currency, which has soared to the low $1.41?s. Herein lies the opportunity. Wait for this rally to exhaust itself, then sell the daylights out of the Euro. They next move on European interest rates has to be down. Now that the can has been kicked down the road on the debt problem the European Central Bank can now focus on the distressed economy.
With outgoing ECB president no longer around to justify his disastrous rate hikes in the first half of the year, the new president, the Italian Central banker Mario Draghi, has a free hand to initiate a rapid unwind. At the end of the day, interest rate differentials are the only thing that foreign exchange traders really care about, and such a move would pave the way for a dramatic weakening of the Euro against the dollar. Today?s bail out gives us a great entry point for such a trade.
For those who play in option land, the no brainer here is to buy the $1.40 puts on the (FXE) three months out. ETF investors should start nibbling on the (EUO), the double leveraged short play on the Euro. And to show how earthshaking this conclusion is, my house was at the epicenter of a 3.6 magnitude earthquake that just caused it to literally jump off its foundations with a giant roar.

Draghi: To Cut or Not to Cut, That is the Question
My friend, Charles Githler, organizer of the hugely successful Money Shows, graciously invited me to appear as a keynote speaker at the recent Las Vegas event. You will never find more talent, useful tools, and new points of view under one roof than any other confab of this kind. And best of all, they are free to attend.
After my speech, I made a series of instructional videos for new, prospective investors on how to make money in these incredibly difficult and contentious markets. I have listed three titles below along with their links. If long term followers and friends want to have a laugh and see how much this business has aged me, please take a look. They run about ten minutes each. For a calendar of the next Money Show nearest you, please click here.

Video 1: How to Trade Like a Hedge Fund Manager - Play Video
Video 2: 3 Global ETFs Worth Watching - Play Video
Video 3: The Most Common Investor Mistake - Play Video
If you have any questions about the videos, please don't hesitate to contact me.
Thanks again,
![]()