Featured Trades: (THE BUBBLE HAS BURST IN BONDS TOO), (TBT), (TLT)
3) Time to Double Up on the (TBT). I have mentioned in recent days that the stock market is close to fully discounting a recession that isn't going to happen. The bond market is saying that recession is a certainty, that we are already well into it.
I think the bond market has got it wrong this time, or is at least early by a year. So I am going to double up my position in the ProShares Ultra Short Lehman 20+ Year Treasury ETF (TBT), the 200% leveraged fund that profits when Treasury bond prices fall and yields rise.
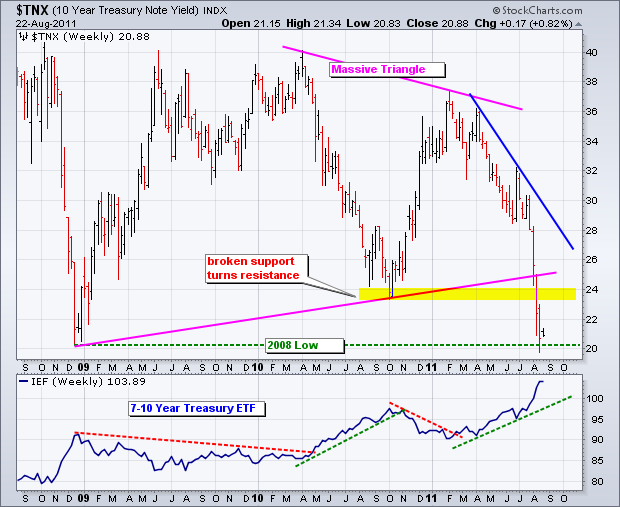
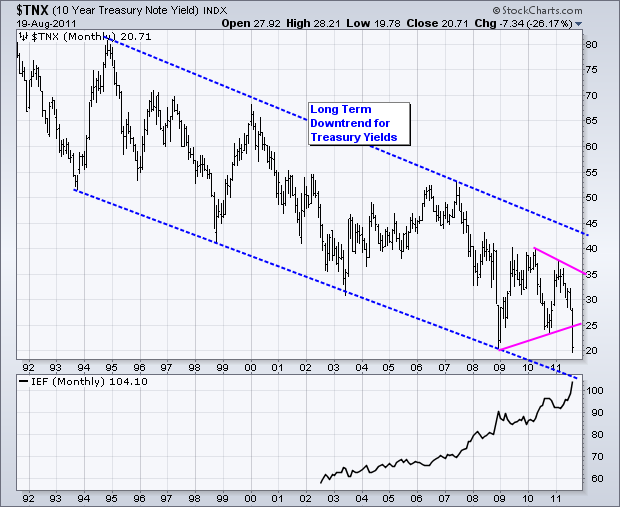
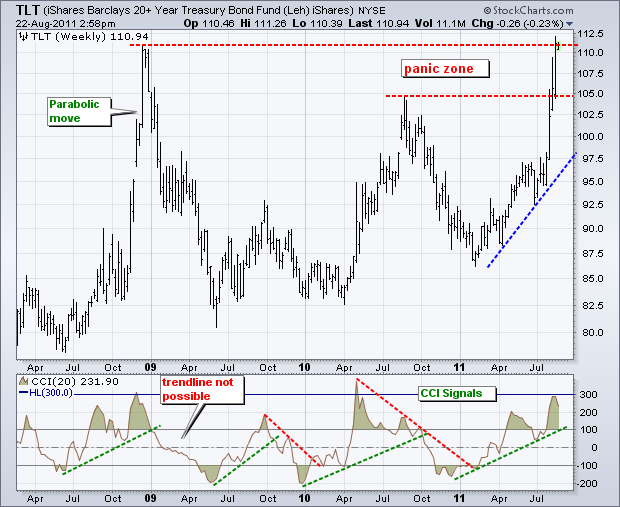
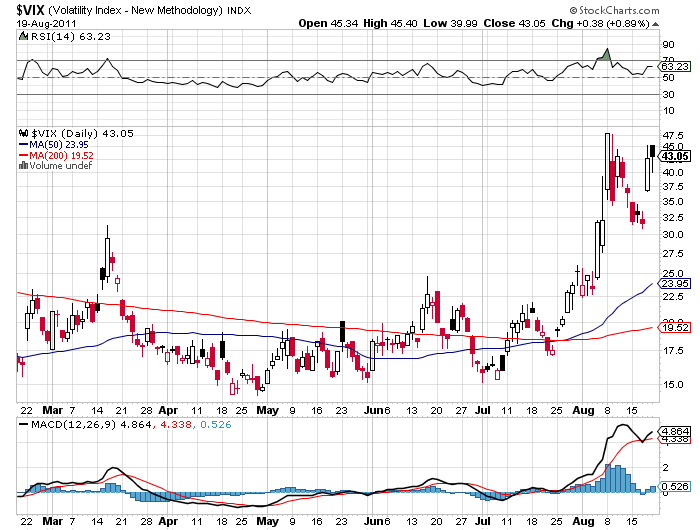
The price movements in the bond market have been so extreme that they have reached multigenerational highs. You have to go back to 1946 to find yields this low, or so historians tell me.
Take a look at the charts below. Even if I am dead wrong, there is still room for a five point rally in the TBT and still maintain its down trend. This is the five points that I am shooting for right now. If I am right, then we are seeing the beginning of a rally that will take yields back up to 4.10%, and the (TBT) back up to $43.
That gives us a potential gain of 80%. Worst case, yields plummet to 1.80%, knocking another 10% off the (TBT). This is the kind of risk reward that I am looking for, 8:1 in my favor.
There is another point to mention here. With the 30 year bond now yielding 3.5%, the cost of carry of the (TBT) has dropped to around 7.5%, the lowest it has ever been. This is down from the 11% carry we saw only six months ago. This ETF has never been such a bargain.
-
-
Featured Trades: (THE DEAD HAND OF THE BABY BOOMER ON THE MARKET)
4) The Dead Hand of the Baby Boomer on the Market. From this year, the nation's 80 million baby boomers have started retiring in large numbers, creating a major depressive effect on stock prices, virtually assuring that we will endure a second lost decade for the leading stock indexes.
Assuming that you worked every year since you were 21 and earned the maximum amount of income, your monthly social security payment will amount to $2,366, or $28,392 a year. The average payment is $1,200 a month, or a paltry $14,400? a year. This is against an average cost of living for a family of four of $50,000 a year in the San Francisco area, and not much less in the rest of the country.
The average savings of a boomer is now only $75,000. However, some 25% of boomers have no savings at all. Many had pensions that were invested in their own firm's stock, which then went bankrupt. Others who planned on retiring on the equity in their homes have seen it vaporize in the housing collapse.
There are going to be further cash calls than just trying to meet the monthly rent. Many boomers lack health insurance, and will have to meet unforeseen medical bills from savings. The dreadful job market is forcing many into early retirement, forcing accelerated draws on IRA's and 401k's. This adds up to a soaring demand for social services, just when the cash available for these is about to get cut.
How are they going to get the money to make up the difference? Selling stocks appears to be at the top of the list, as this month's record selling of equity mutual funds indicates. When they run out of equities, you can bet they'll move on to bonds, forcing interest rates up. The net net for the rest of us will be higher taxes, fewer benefits, and slowing economic growth.

Which Way to the Welfare Office?
SPECIAL MODEL PORTFOLIO ISSUE
1) My View of the Stock Market for the Rest of 2011. Down, then up, then down again. How about that? I believe that the global risk markets will bottom sooner than people think, and that the time has come to compile a shopping list of investments to pick up on distressed days in the market.
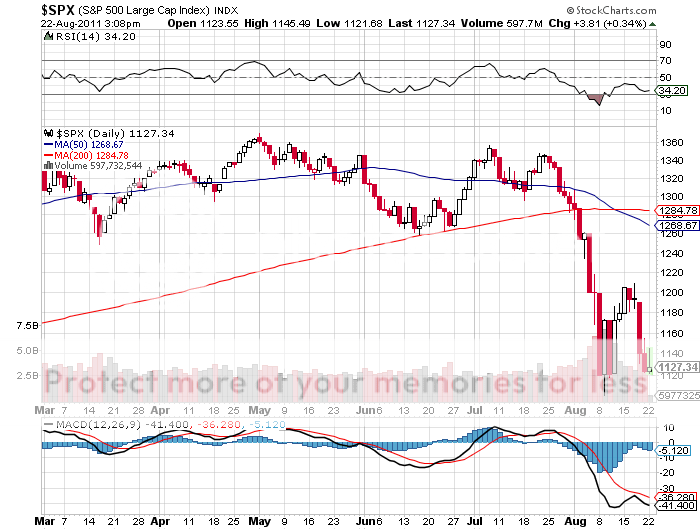
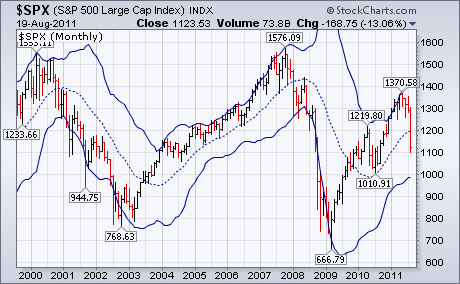
I think that at the most extreme, the S&P 500 will bottom at 1,000 at the lowest from yesterday's 1,123 close. More likely are important bottoms at the Fibonacci levels of 1,045 and 1,065. At 1,000, the index will be showing a 28% decline from the April 29 peak. The market multiple will have collapsed from 14 to 10 times earnings. That is against a 30 year range of 10-22. In other words, we will have discounted a full scale recession. Ten year Treasury bond yields are telling us the same with a 2.03% yield, against a 3.6% inflation rate.
The likelihood is that this recession is not going to happen. Virtually all the current economic data is consistent with the forecast I have maintained all year of 2%. Car sales show that the industry is recovering. Major exporters like Caterpillar and Freeport McMoran show the demand from emerging markets is booming. An enormous reconstruction package in Japan is just starting to kick in. Add all this together, there will be enough demand to assure 2% growth for the full year, which would represent a modest improvement from the first half.
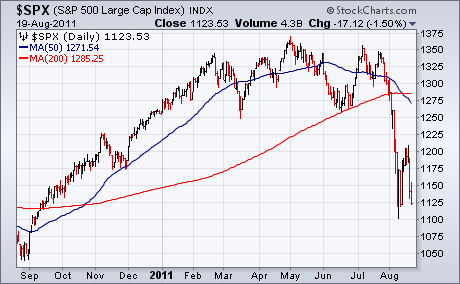
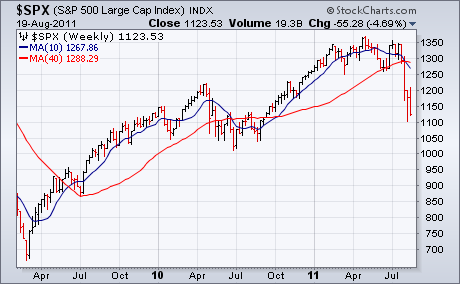
Mind you, I am not proclaiming the birth of an entire new bull market. I believe that we put in the top for stock prices for this economic cycle on April 29 at 1,384, and it is unlikely that we see that print again. My best case scenario will be for a recovery of the 200 day moving average at 1,285. If we start this move off of a 1,000 bottom then there is room for a 28% move, certainly something worth taking a bite of.
What will be the drivers of such a move? In September, we will start releasing Q3 corporate earnings, which are likely to be buoyant. We will also start to see the traditional yearend liquidity push. Europe will hopefully go quite again, once the leadership returns from summer vacation. The icing on the cake would be any surprises from the Federal Reserve on the monetary front, as they did last year. All of this will pave the way a rise in risk assets everywhere that could last three to four months.
That gets us into 2012, when the real challenges reassert themselves. Very little about the presidential election is likely to be equity friendly. Arrest Ben Bernanke for treason? Really? Where's the rally in that? Gale force headwinds on the demographic front start to kick in and the first baby boomers reach the age of 66 and dramatically pare back spending. Corporate earnings will then hit diminishing returns.
Real estate promises to take another leg down, possibly as much as 25%. This will put the banks through the meat grinder once more, but this time there will be more TARP. You can forget about getting any help from congress on the economy either. It all sounds like a replay of 1937 to me, when the government ended stimulus too soon, triggering a secondary great depression. This could all add up to a real crash of the 2008 variety, with declines of 50% or more on the menu.
So what I am proposing here is not an investment, but a trade. It assumes a dead cat bounce in PE multiple from 10 to only 12.8. Preserving your capital will be the name of the game, while pulling in what incremental trading income that you can.
How could I be wrong? If failing stock prices deliver a self-fulfilling prophesy. If this summer's melt down in risk assets frighten consumers into paring back spending and corporations into backing off from capital investment, then my growth targets above will like high, and we are already in a recession. Call us 'dead men walking.' It is also possible that structurally low growth is forcing a permanent downshifting of the market's multiple range from 10-22 to 8-16. Then risk assets will begin plumbing far greater depths. This could also happen if any of the long list of structural negatives listed above accelerate. The only way to stay alive in these markets is to believe that all things are possible at all times.

SPECIAL MODEL PORTFOLIO ISSUE
FOR PAID SUBSCRIBERS ONLY
To obtain this issue in full with Model Portfolio,
please subscribe to The Diary of a Mad Hedge Fund Trader
2) What to Buy at the Bottom.
SPECIAL MODEL PORTFOLIO ISSUE
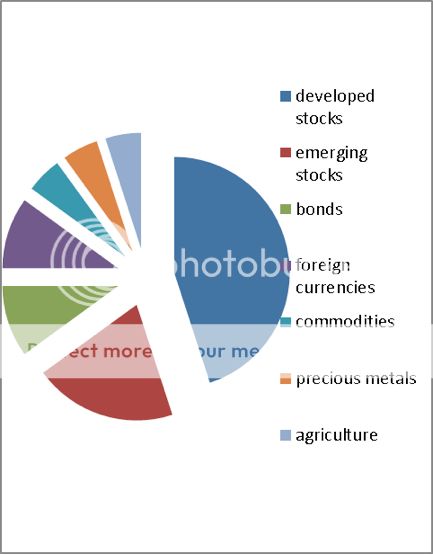
3) The Method to My Madness. The portfolio that I have assembled here capitalizes of the major long term trends that will dominate the global economy for the next decade. Long term followers of this letter will know the names well, as these were the ones we rode up from the March, 2009 bottom, with spectacular results. Those trends include:
*The growth of the global population
*The rise of the emerging market middle class
*The scarcity of essential natural resources
*The shift from paper to hard assets
*Demographic investing
*The rise of technology
*Deflation and then inflation
Let me go through my picks on an industry by industry basis, and I will explain the logic behind them.
Energy-This is no longer a commodity, but a financial asset with a near perfect correlation with risk assets around the world. This is a 'peak oil' play that particularly targets the growth of demand in energy hungry China. Don't forget that they're not making the stuff anymore. For a speedy, leveraged position, buy the (DIG) ETF.
Autos-This industry is seeing demand climb from a low of 9 million units in 2008 to 15 million by 2013. This gets us back to just above the scrapage rate of 14 million. There is also a ton of deferred purchases still in the pipeline, holdovers from the 2008 recession. I picked Toyota because they have a triple comeback to price in from the economic cycle, the brake problems, and the tsunami.
Technology-This is what American does best, is our lead over the rest of the world, and is what everyone wants to buy or steal from us. These are our best of bread companies. If you want a quickie short cut to get in, then just buy the ETF (QQQ).
Rails- You need to transport the coal, iron ore, and food that we are shipping o China. When you weren't looking, this became one of the most efficient industries in the country. It takes one gallon of fuel to move a ton of freight 400 miles. This is a great emerging market demand play. Warren Buffet likes this industry so much that he bought his own railroad to play with, Burlington Northern.
Heavy Machinery-This is how you play the global commodities boom by staying at home. It also gets you into the shift out of paper assets into hard assets. And if you buy a bulldozer, they give you this cool, yellow baseball cap with a big black 'C' on it.
Banks-So you were looking for proof that I really am Mad? Bank of America has a book value of $10 a share. The problem is that no one believes them, so the stock is trading at a 40% discount. Move a patient out of a coma into intensive care, and the stock is good for a 50% dead cat bounce. 'RISK ON' will be the catalyst, along with a selloff in the bond market that widens their spreads.
Emerging Markets-So which do I choose, the country that is growing at a 6% rate, or the one that is plodding along at 2%. I'll let you figure this one out. The answer is a heavy weighting in emerging markets. I have listed the best four here.
Bonds-'RISK ON' means dump bonds. The (TBT) could nearly doubly from here if the ten year Treasury gets back to the 4% yield we saw six months ago.
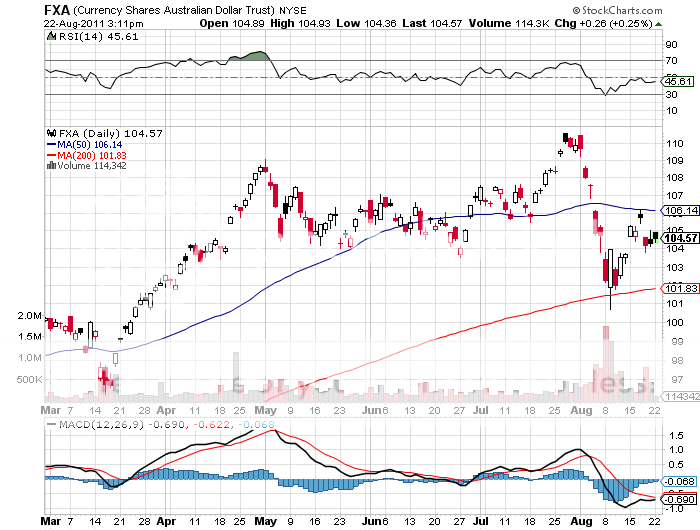
Foreign Exchange-Dump the flight to safety currency, the Swiss franc, and buy the global growth currency, the Australian dollar. Don't touch the yen, which lives in a world of its own, and the operating manual is still written in Japanese.
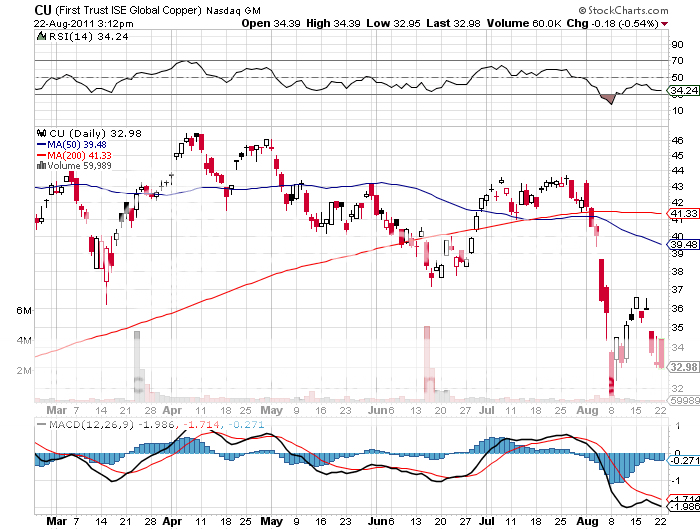
Commodities-Recession fears have beaten copper like the red headed step child that it is. (FCX) is the leveraged play on the recovery of industrial metals.
Precious Metals-With gold at euphoric levels, it is ripe for a $200 pull back, even if the long term trend stays intact. Limit your risk through buying out of the money puts only.
Agriculture- We are making people faster than the food to feed them and this is a global problem. Also look at (JJG) and (DBA) for a more diversified play.
Featured Trades: (THOSE DAMN EUROPEANS!), (AAPL)
1) Those Damn Europeans! I am tearing up my Eurail Pass, returning my espresso machine to Costco, and sending my gelato maker to the recycling center. Next year's summer vacation is going to be at Coney Island, not the Italian Rivera. Those damn Europeans are spoiling everything!
The US stock markets made a determined effort to put in a bottom last week, with the S&P 500 rallying 106 points off the bottom with blinding speed. But the Europeans had other ideas.
First, France and Germany met and agreed to do essentially nothing to solve the current debt crisis. There was no announcement of any bail outs, a Euro TARP, or even the issuance of pan continental Eurobonds. All we are left with are the hemorrhaging effects of austerity. It's as if the Tea Party had learned German and suddenly took over the Bundesbank. Then they tried to staunch market volatility with a short selling ban on all equities, a measure that has a proven history of failure.
Markets understandably gave this dreadful performance a raspberry, followed by a middle finger salute. European banks were particularly trashed, some down as much as 80% in three months. The market capitalization of the entire European banking sector is now less than that of Apple (AAPL), some $340 billion.
The Swiss were even worse. They boosted liquidity in the domestic money markets 400%, from SF30 billion to SF120 billion, in a futile attempt to weaken their own currency. There is talk of pegging the Swiss franc (SFS) to the Euro. Pretty soon, the mountain paradise's largest heavy machinery production is going to be in printing presses.
This comes on the heels of efforts by the Swiss National Bank to intervene in the foreign currency markets, which have so far cost it SF30 billion. I watched the Japanese try to end their bear market in equities via bureaucratic fiat with the end result that the Nikkei made successive new lows.
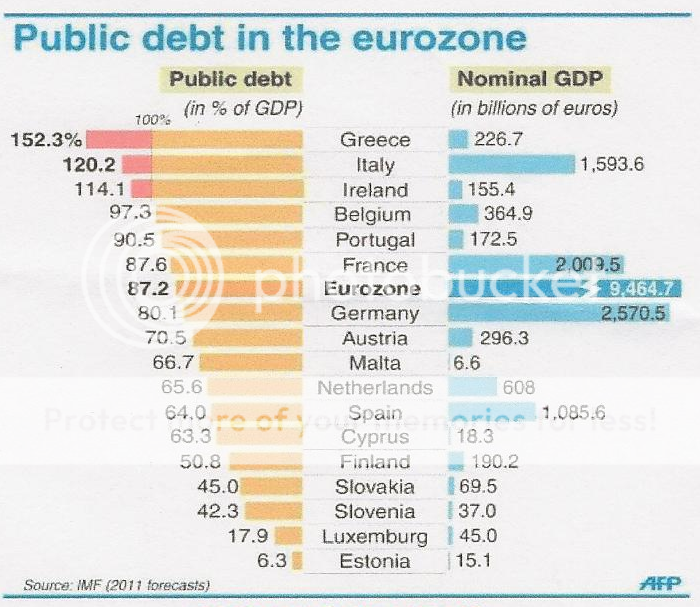
This is Europe's basic problem. They have a common currency, but borrowing is carried out by the 16 individual member states, creating a gigantic asset and liability mismatch. It's as if America had no Treasury Department, Treasury bonds didn't exist, and all of our national commitments were met through borrowing by the individual states. If that were the case, Illinois and California state bonds would be trading at 30 cents on the dollar, while North Dakota state bonds would be going for $3.
The problem is that the Europeans lack the political will to carry out the necessary reforms. No one is really interested in handing over control of monetary matters to Berlin, which would almost certainly administer them with an iron hand. The last time that happened, a certain washed up artist and rabble rouser from Austria was running the country, with unfortunate results.
The bottom line here is that the European debt crisis is going to be like one of those nasty flu's that keeps coming back, no matter how much medicine you take. Write periodic tape bombs from the continent into your trading calendar for the next several years.
By the way, since we're on the topic, hands up from anyone out there who knows who originated the term 'European Community'? Yes, you out there in the back row, wearing the toga. Julius Caesar? Not a chance. The gentleman in the black beret and stripped Breton T-shirt, smoking the Gitane. Napoleon? Nope, but you're getting warmer. You sir, the one wearing the lederhosen and knee socks. Yes, that's right, you got it: Adolph Hitler. Therein lies the problem.
-
-

There Goes Another Load of European Bank Shares
-

The Last Time Berlin Ran European Monetary Policy
Featured Trades: (HOW TO PLAY JACKSON HOLE),
(DBA), (FXE), (USO), (CU), (PALL), (UUP),
(GLD), (SFS), (FXJ), (FXA), (FXC)
2) How to Play Jackson Hole. I remember when the meeting of economists at Jackson Hole was one of those boring, under the radar, non-stories that only those with an interest in the arcana of macroeconomic affairs bothered to take notice. In other words, people like me.
Today that is anything but the case. All eyes will be focused this week on the remote gathering, particularly Ben Bernanke's keynote speech on Friday, August 26. Unless you have been living in a cave on a remote Pacific island without a broadband connection, you probably already know that Ben launched QE2 in his address at the same event last year.
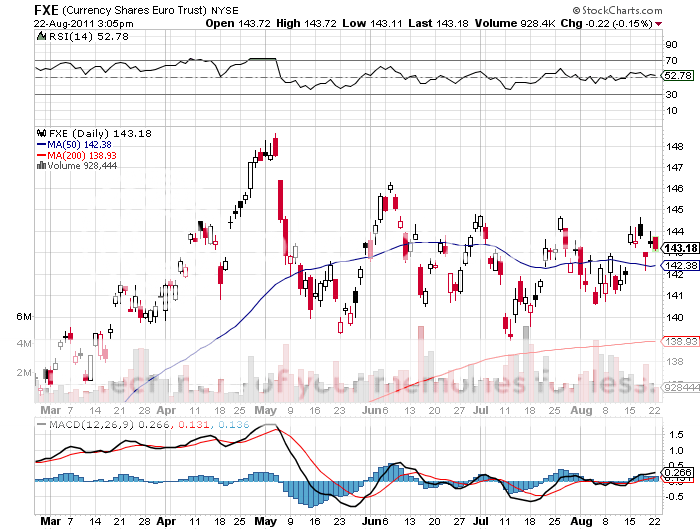
Traders will be hanging on every word, sifting for any evidence of bold, new measures to rescue our sagging economy. If Ben delivers, the markets will riot. The 'RISK ON' trade will be on with a vengeance, and you will want to pile into stocks (SPY), commodities (DBA), the euro (FXE), the Australian (FXA) and Canadian (FXC) dollars, oil (USO), and the industrial metals (CU), (PALL).
If Ben disappoints, 'RISK OFF' lives for a few more weeks, and you want to chase gold (GLD), the Swiss franc (SFS), and the yen (FXY). A weakening economy the 'RISK OFF' trade implies means that a rapidly shrinking trade deficit and the repatriation of American capital from abroad will strengthen the dollar. Please pass the steroids to Uncle Buck (UUP). Equities will probably put in their low for the year.
I vote for the latter. The Federal Reserve has a long history of taking slow deliberate, measured steps. It really couldn't be any other way, given that it is managing a supertanker of an economy. They adopt a policy, and then sit back for six months to see if it works. The tendency to panic is pretty much nil. Since the last bombshell, pegging short rates at zero for two years, landed as recently as August 8, I think the likelihood of further reparative measures this soon is unlikely.
I expect that one thing Ben will mention is that his outlook for the economy is considerably more positive than either you are I might have. He might even say that he expects the second half of the year to be stronger than the first half. If that is the case, the markets will welcome Ben's comments about as much as a loud fart at a Sunday church service.
-
-
-

Casting for the Right Economic Policy at Jackson Hole
-

Please Pass the Steroids to Uncle Buck
Featured Trades: (WHY THIS IS NOT 2008), (SPX), (SPY)
3) Why This is Not 2008. Much of the investment community is now bracing for a repeat of the 2008 crash, when the S&P 500 plunged by a gut punching 52%. For proof, look no further than last week's dramatic selling, when traders could not unload equities fast enough.
Unfortunately for those puking out positions here, this is anything but a replay of the melt down from three years ago. Much like the military, they are over preparing for the last battle, and blind to the one ahead of them. Let me tell you why those capitulating now, have got it all wrong:
*In 2008, banks were essentially insolvent. Since then, they have raised over $50 billion in primary capital.
* Nonfinancial companies are sitting on the highest cash mountains since 1955, some $2 trillion, or 11% of total assets.
*In the last three years, the consumer savings rate has leapt from 1% to 5.4%.
*Public interest coverage is at a ten year high.
*Business inventories have gone from bloated to fighting lean.
*Debt/GDP has fallen from 100% to 90%.
*The cheap dollar is fueling surging exports.
*Short term interest rates have fallen from 3% to 0%, and will remain there for two years.
*Junk bond yields have plunged from 25% to 8%, opening up financing avenues for many subprime corporate borrowers.
*Companies have announced buyback programs of $550 billion, and some $450 billion of this may be executed.
If you were an automaton, and only saw these numbers, you would be loading the boat with equities right here. But you're not, and are probably still nursing scars from 2008 which only recently healed, and still need to be scratched whenever there is a sharp change in the weather. One can never underestimate emotion when it comes to stock market valuations.
My late friends, who traded the 1929 crash and continued on throughout the thirties, told me the experience was so traumatic, that many customers stayed out of the stock market for decades, if not for the rest of their lives. We may be seeing a repeat of that now.
-
-
-
-
History is Not Repeating Itself
Featured Trades: (GERMAN GDP IS ANOTHER NAIL IN THE COFFIN FOR THE GLOBAL ECONOMY), (FXE), (EUO)
2) German GDP is Another Nail in the Coffin for the Global Economy. Major hedge fund strategists were stunned by German's Q2 GDP, which came in at a feeble seasonally adjusted 0.1%. This is a mere shadow of the more virile 1.5% growth seen in Q1. In one shot, economic growth has downshifted from a rapid 4.7% rate to a more American style 2.7%. Germany has been the engine that was driving the European economy. If it breaks down, all of a sudden Europe is going nowhere, and the world suffers.
This is the flip side to the European debt crisis. What did the Portuguese, Italians, Irish, Greeks, and Spaniards do with the money they earned off of all that German sovereign lending? They ran out and bought Mercedes, BMW's, and Volkswagens. Take away their credit cards, and all of a sudden the highly export dependent German economy takes it on the chin.
This is why German Prime Minister, Angela Merkel, is risking her political career attempting to salvage the European monetary system, even though it will be hugely expensive to do so, and is highly unpopular with the electorate. Efforts to fix the European model will be a recurring theme in the financial markets for many years to come.
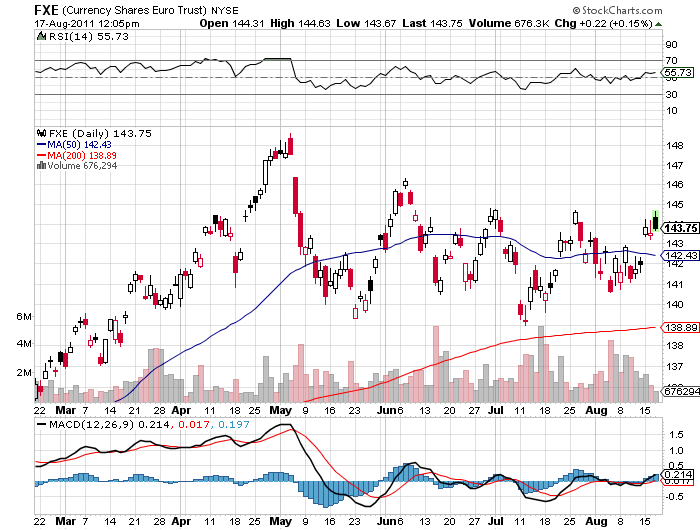
How does the intrepid, opportunistic trader cash in on this? Trade the Euro (FXE) from the short side, or buy the short Euro ETF (EUO). The execution date of the continent's mindless high interest rate policy has just been moved up, and there will be no stay.
-

-

The German Economic Engine Isn't Looking So Good
Featured Trades: (THE HARDEST JOB IN THE WORLD), (FXI), (TLT)
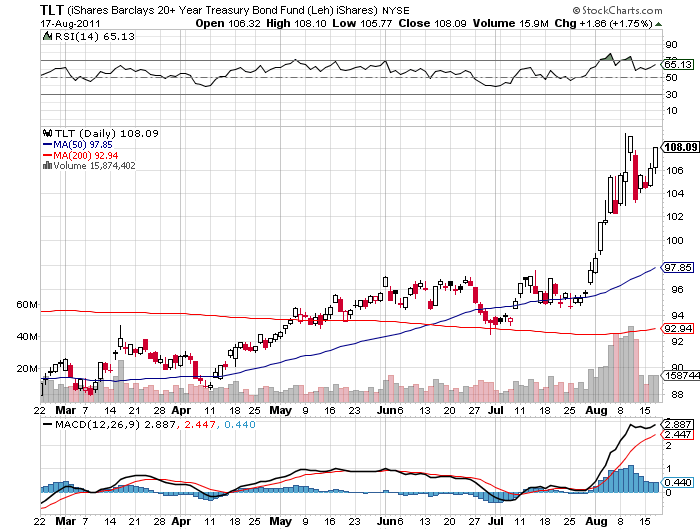
3) The Hardest Job in the World. US Vice President, Joe Biden, currently has the toughest job in the world. He has gone to China, hat in hand, to convince the country's leaders to buy even more US Treasury bonds than they already have. This he must do with ten year yields approaching 2.0%, delivering some of the largest negative yields in history. He is in effect saying, 'give me a dollar, and I promise to give you 90 cents in ten years.' Such a deal!
I'm sure that Joe's lifetime spent hobnobbing with local politicos in union halls, PTA's, and Boy Scout troops in rural Delaware has left him ill prepared for the task at hand. They used to say you could walk through Joe's deepest thoughts and not get your ankles wet. How he became the second most powerful man in the world, I will never know. Like string theory and Einstein's theory of relativity, politics can be difficult to fathom. Yet, he is going up against some of the most brilliant technocrats the world's oldest civilization has to offer.
China is already the planet's largest buyer of Treasury bonds, taking down up to 50% of the monthly auctions, its total holdings approaching $1.3 trillion. It will continue on the bid. You can forget about all of those Armageddon scenarios where China dumps its holdings, sending interest rates soaring. There is simply nowhere else to go with adequate size and liquidity. China is going to have to recycle its $250 billion a year bilateral trade surplus into dollar instruments of every description. Its total reserve now exceed $3 trillion, the largest in history
However, new buying of alternative assets has already begun. The recent run up in gold has Chinese fingerprints all over it. The Middle Kingdom was also a major player of the European refi's, no doubt attracted by sky high double digit yields. Much of the strength of hard assets last year, such as with copper, came from Chinese buying, not for consumption, but to use as a financial asset. It is also attempting to spread the wealth in a more subtle fashion through buying of minority stakes in many of the world's multinational blue chips.
I wish Joe the best of luck in his venture. Just watch out for the Peking Duck state dinner. This is when the greatest number of elderly American visitors die of heart attacks, according to an embassy official I know there.
-
-
Maybe I'll Have the Fish