Featured Trades: (DO YOU REMEMBER WHEN'..?), (GLD), (INDU), (USO), (FXF)
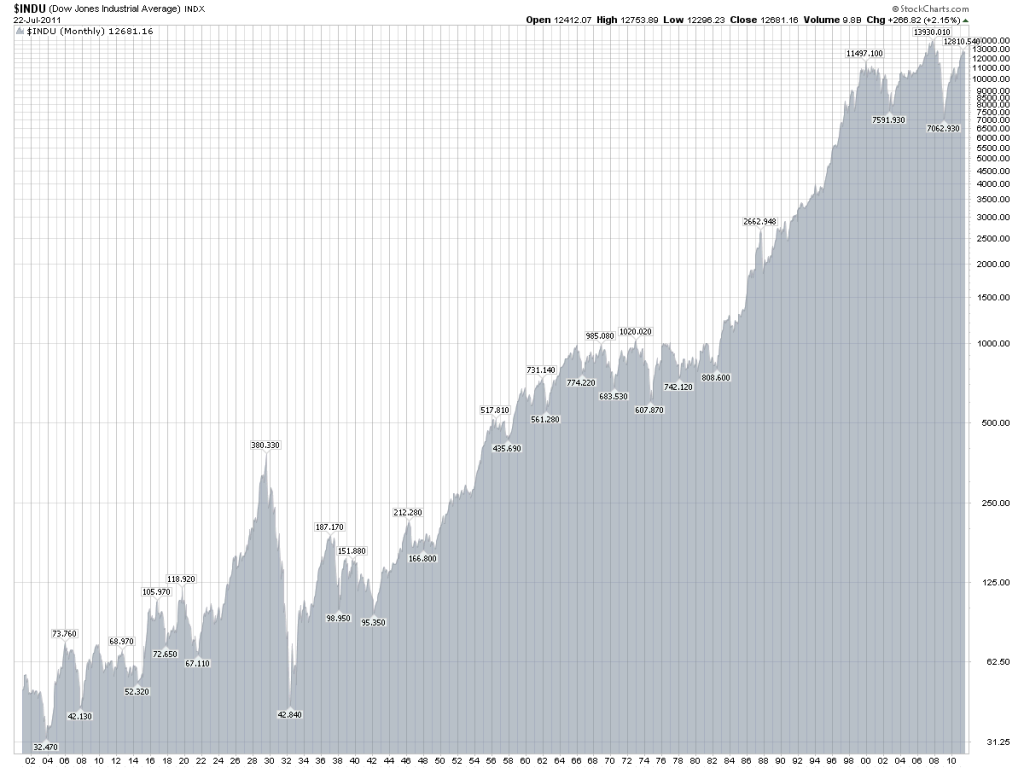
3) Do You Remember When'?.? The stock market managed to eke out a modest 29 point gain today, the first time in nine trading days. If it had closed down a ninth day, it would have been the first time since 1978.
I remember those days well. The Dow average then was trading at 700. Gold (GLD) was at $180 an ounce. The Euro (FXE) would not be created for 20 years, but the Swiss franc (FXF) was floating around 32 cents. Today it is 75 cents. Crude (USO) was priced at $14 a barrel, and gasoline was a mere 65 cents a gallon.
The Chevette five door hatchback was the top selling car in the US. And we all had mutton chop sideburns.

Yes, I Remember Them Well
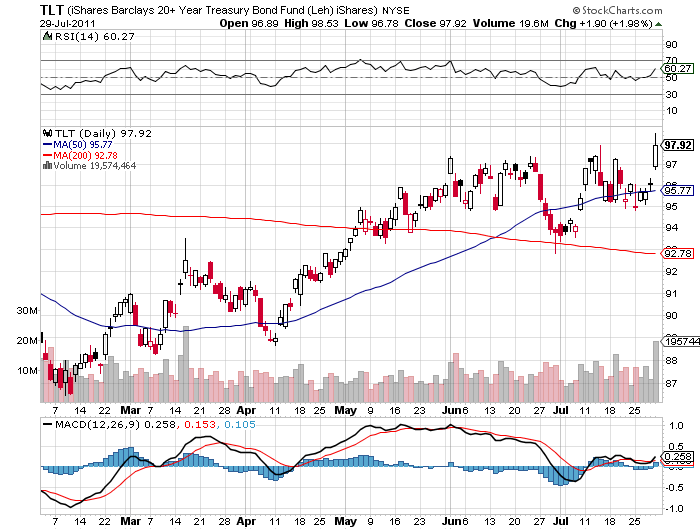
Featured Trades: (WHAT THE MARKETS ARE TELLING US), (SPX), (TLT), (TBT)
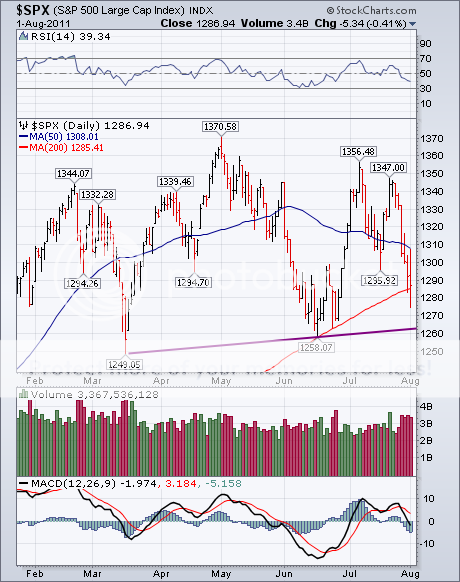
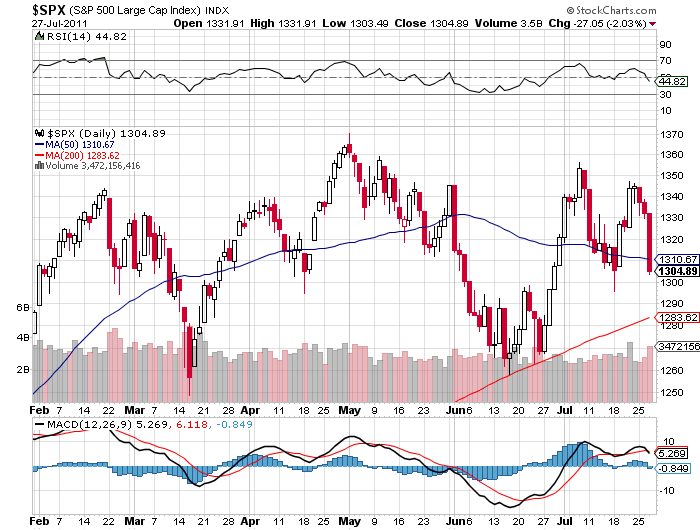
1) What the Markets Are Telling Us. I spent the morning doing a round robin with hedge fund trader friends of mine trying to figure how we all got this so horribly wrong. I did this as the (SPX) was ticking down to 1249 and bond yields cratered to a one year lows at 2.62%.
The uproar of the debt debacle distracted us from what was really driving the markets, the economy. While listening to the hostage drama, where the Tea Party threatened to put a bullet in the head of the world economy unless it got its way, the economic data began a rapid deterioration.
Q2 GDP was marked down to 1.3%, with an even worse revision for Q1 down to 0.9%. This is not a development friendly to asset prices anywhere, and delivered us a huge 'RISK OFF' trade.
Everyone to a man was positioned for a relief rally on the passage of the debt compromise. That's why when the rally came, up to 1,307, it lasted only 15 minutes. When too many crowd one side of the canoe, it flips over. This is why we are all swimming in red ink. Usually, I am watching this happening to other traders, not myself.
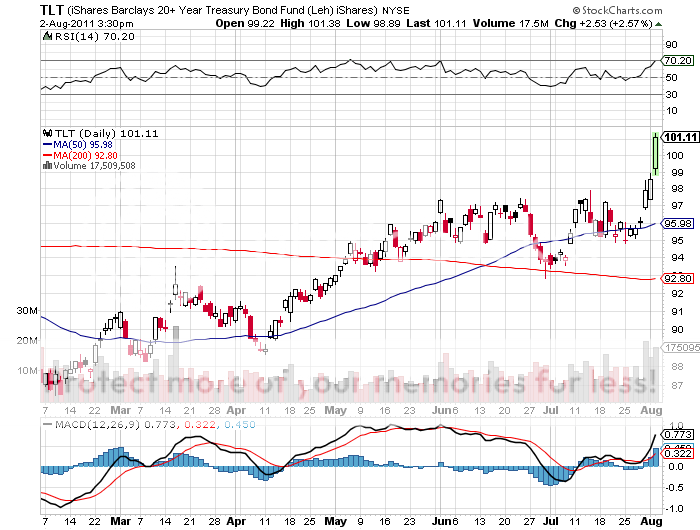
Instead of focusing on the postponement of a downgrade of US Treasury bonds, the markets instead are discounting the chopping of US growth by a third for the next decade that the congressional compromise assures. This is why bonds have soared by six points in a week. Good thing I covered my short call position on the (TLT) on July 22.
What the bond market is telling us is even more interesting. It is proof that the government is borrowing too little money, not too much. The Chinese are kicking themselves that they didn't buy 100% of our monthly bond issuance, instead of only the 50% they did, as prices are now rocketing to 30 year highs. This makes arguments that foreign investors will boycott American debt seem ridiculous. I challenge anyone to point to a market anywhere in the world that disagrees with this obvious conclusion.
The technical damage in the market is compelling, with the S&P 500 trading well below its 200 day moving average. US stocks are about to give up their year. What remains is to see whether the March low can hold here at 1249. If it doesn't, then look out below.
-
-
-
-

Too Many Traders Got Into the Same Canoe
Featured Trades: (BE CAREFUL WHAT YOU WISH FOR)
1) Be Careful What You Wish For. Politicians are popping champagne bottles and celebrating the end of cantankerous negotiations over the debt ceiling. I say be careful what you wish for. Let me give you my quickie, back of the envelope analysis of the debt ceiling deal in Washington.
The compromise calls for $2.4 trillion in spending cuts over ten years. That amounts to 16.6% of GDP, or 1.6% per year. If the Federal Reserve's 3.0% forecast comes true, that means our economic growth rate is about to fall to 1.4% a year. If my prediction comes true, and we grow at a 2.5% rate, that plunges to 0.9%.
There is another country where GDP growth is measured in mere basis points: Japan. Congress has just voted for ten years of austerity. To do this at this stage of the economic cycle, when growth is feeble at best, and we have just seen two back to back quarters of growth at the 1% handle, is to guarantee us a second lost decade of zero stock market returns.
Sure, the spending cuts are back end loaded. But you know what? Investors will front end load the discounts in asset prices this slow growth scenario demands. This is not good news for long term holders of risk assets of any description, be they stocks, commodities, or homes.
This may be the riot act that financial markets are reading us today. Instead of getting the short covering rally that many of us expected, we were given a cascading series of flash crashes. The (SPX) cratered 35 points, oil cracked by $5, the Euro plunged 3 cents against the dollar, copper gave back 20 cents, and even gold pared $15. In the meantime, a flight to safety bid took bonds up two points to an incredibly low yield of 2.72%.
Armchair historians out there have to be recognizing the similarity of 2011to 1937. That is when a republican congress forced Franklin D. Roosevelt to throttle back government spending too soon, throwing the country back into round two of the Great Depression. That triggered a 49% plunge in the stock market. The downturn continued until WWII delivered the greatest stimulus package of all time and ignited a 25 year bull market.
To a large extent, there is not much anyone can do to repair the economy. Possibly as much as half of the economic growth of the past 30 years was borrowed from the future. This is because it was fueled by the $3 trillion that Ronald Reagan borrowed largely from the Japanese during 1980 to 1988, and the $5.5 trillion George W. Bush borrowed from the Chinese from 2000 to 2008.
The bill is now due, but the piggy bank is empty. Decades of minimal growth will be the consequence. I doubt that there is a single business out there that can point to a new customer coming to them as a result of the debt deal. There will be tens of thousands that will moan about lost business. The republicans now own the economy. That may be something they come to regret.
See Any Similarities?
Featured Trades: (GDP IS ANOTHER BUCKET OF COLD WATER)
1) GDP is Another Bucket of Cold Water. Another bucket of cold water was thrown on financial markets on Friday with the shocking release of Q2 GDP of 1.3%. The whisper number prior to the release was at 1.9%, and even this figure is far short of the Federal Reserve's GDP forecast for 2011 of 3.0%.
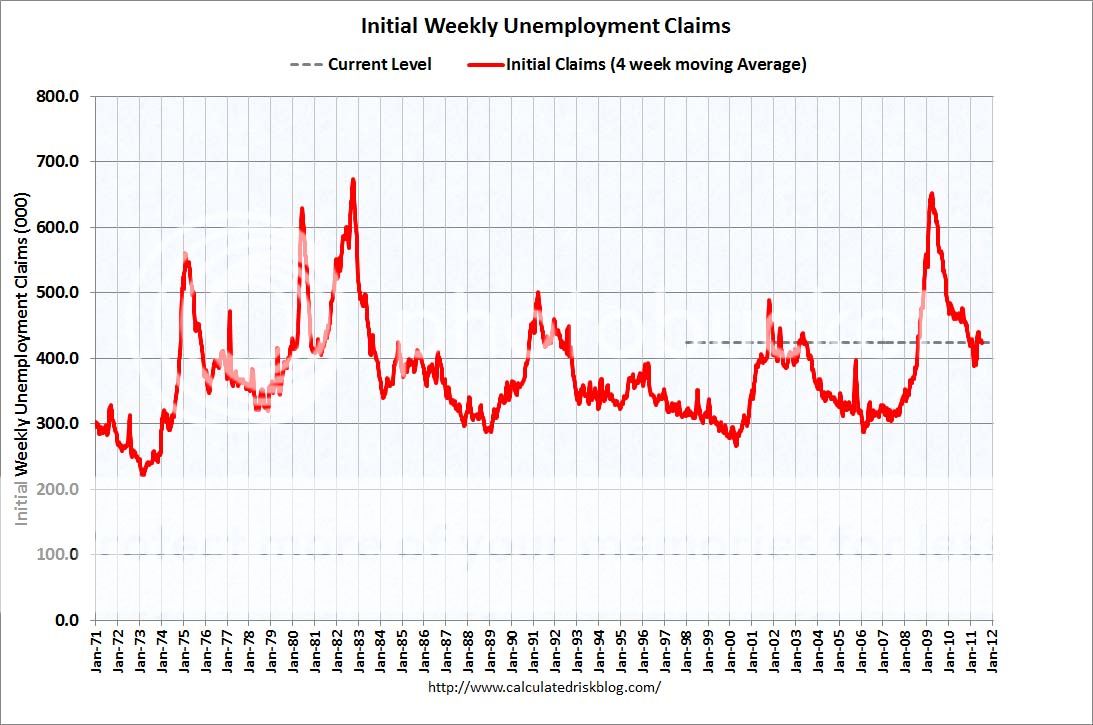
Keep in mind that these are backward looking numbers giving us data that is three months old. Some of the drag was caused by a Japanese tsunami slowed car industry, which the Ford earnings this week are telling us is already starting to snap back. That's why we had a sudden drop in weekly jobless claims this week be 28,000 to 398,000, the lowest since April 2, and the most important coincident indicator there.
I have been trading my own book all year based on a much more modest 2.0%-2.5% growth estimate, and it has served me well. I believed that most economists were vastly underestimating two crucial factors. State and local spending would continue to be a huge fiscal drag as local authorities enforce emergency measures the staunch bleeding deficits.
Remember, for every $3 the federal government shovels into the economy, the states are taking out $1. And now the feds are going to stop pouring money into the economy. I also thought that there would be no bounce back in real estate in a deleveraging world, a major component of past recoveries. This makes a hash of sell side predictions of economic growth this year that ranged as high as 4%.
Billions of dollars is being spent to make you believe that the slowing economy is the result of excessive regulation, burdensome taxes, excessive budget deficits, and 'uncertainty.'? The truth is that the drag is being caused by deleveraging, gun shy bankers afraid to lend, paranoid corporations nervous about hiring, the retirement of 80 million baby boomers, and the disappearance of a consuming idle class. Multinationals sitting on cash mountains are investing it in China and India, not here. These are all long term structural drivers that no one can do anything about.
My long term scenario assumes that financial markets peak sometimes next year, about six months before we go into the next recession. Then the next crash ensues. If these GDP figures continue to deteriorate, I may have to move those targets forward.
-
Coming Sooner Than Expected?
Featured Trades: (AN UPDATE ON RHODIUM)
2) An Update on Rhodium. I was recently interviewed by Daniela Cambone of Kitco News, a boutique firm specializing in the online research and trading of metals. I have known the Kitco people for a long time and they are one of the class acts in the hard asset arena.
To summarize, I think that rhodium (symbol XRHO in London), which is based on the Greek root for 'rose,' is a major long term buy. While gold, silver, platinum, and palladium are trading at, or close to all-time highs, rhodium is still at a lowly one fifth of its record high. It is just a matter of time before rocketing demand for platinum and palladium, driven by a recovering global car industry, spills over into rhodium which can also be used in catalytic converters.
While liquidity in rhodium has been an impediment for investors until now, the launch of a new rhodium ETF by Deutche Bank could break the logjam. Those of you willing to watch my ugly mug pontificating about the long term prospects for? rhodium, please click on this link at http://www.kitco.com/kitconewsvideo/, and then click on 'Platinum, Palladium, and Rhodium outlook, July 27, 2011.
-

Are They a Long Term Buy?
Featured Trades: (WHAT THE TEA PARTY DOESN'T KNOW ABOUT THE BOND MARKET)
3) What the Tea Party Doesn't Know About the Bond Market. I have spoken to several Tea Party leaders since the movement sprung up a year ago, and have come to several conclusions. This is a genuine, grass roots movement composed of people who are unhappy about the changes that have swept the country for the last 30 years. By and large, these are simple, decent, hardworking and retired people.
Their list of complaints is long, and include the downhill slide of public education, declining standards of living, falling wages for working people, the ballooning immigrant population, and the huge losses they suffered to their retirement savings and the value of their homes in the 2008 crash. They all want their lives to return to the simplicity of decades past. To a man, they want lower taxes and for the government to get out of their lives. I sympathize with them on many of their complaints.
They are also not financially sophisticated. They have no understanding of the global financial system and its many intricate moving parts. They distrust Wall Street and bankers, having been conned or victimized in the past. This is a big problem.
It is safe to say that the Tea Party leadership could care less about what happens in the bond market. The scary thing is that they think this market is something that can be simply turned on and off again like a light switch. They do not realize that:
1) US Treasury bonds are the lynchpin of the global financial system.
2) Once you break confidence in this instrument, you won't be able to put it back together again.
3) The pricing of all debt securities and loans around the world key off of US Treasury bonds.
4) Tamper with the pricing of your benchmark instrument, and the entire global financial system goes haywire.
5) The unintended consequences are uncountable.
6) Interest rates will rise across the board. LIBOR rates have already started to creep up.
7) Since many financial institutions meet their capital requirements with Treasury bonds, any undermining of their credit worthiness forces a capital call which could trigger a secondary banking crisis.
8) Short term money markets will freeze up, starving corporate borrowers of cash. This has already started to happen.
9) Mess with Treasuries, and the value of your home is toast, if it is not already.
10) Dump 'full faith and credit' and you undermine the reserve status of the dollar, one of the greatest free lunches for America of all time.
The bottom line here is that you have a bunch of kids playing with matches in a fireworks factory. It is reminiscent of the first failed TARP vote in congress, when the same group of ideologically driven republicans ignored their party leadership and torpedoed their own president's bill.
You may recall that the Dow fell 700 points that day. I do. You may also remember that the following backlash at the polls set their party back a generation. I do. Wait until they have to explain on the campaign trail that their supporter's' IRA's dropped by half again because of a principal.
If this were any other country, the center of the democratic and republican parties would break off from their radical wings, create new parties, and then form a coalition government. But we are stuck with our 220 year old form of government, so that is not an option. But the final solution to the debt ceiling crisis may resemble something like this, subject to the confines of our own, arthritic political confines.
By the way, I want to thank the many readers who have been forwarding my letters to the White House, Senator Harry Reid's office, and John Boehner's staff. I have heard from all three. Keep up the pressure.
I am hoping for the best this weekend. But I am not holding my breath.
-
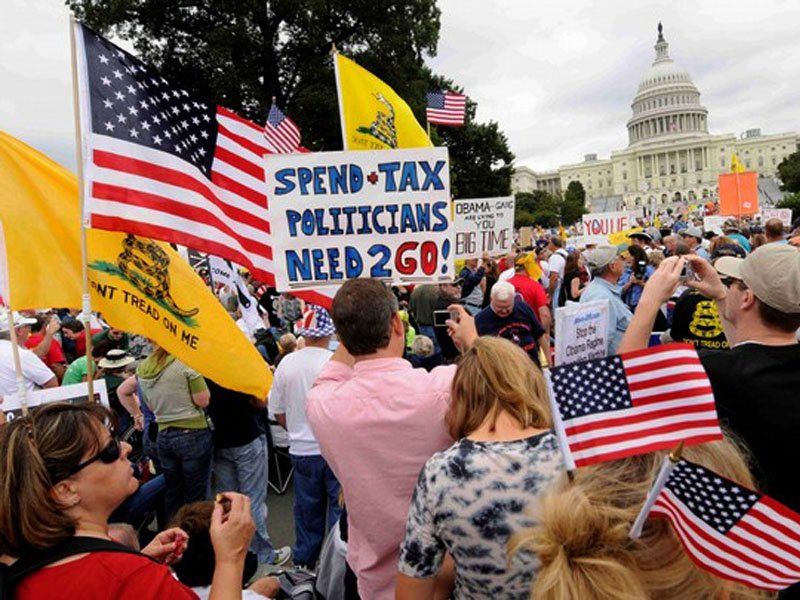
Must the Government Be Destroyed in Order to Be Saved?
SPECIAL AUTOMOTIVE ISSUE
Featured Trades:
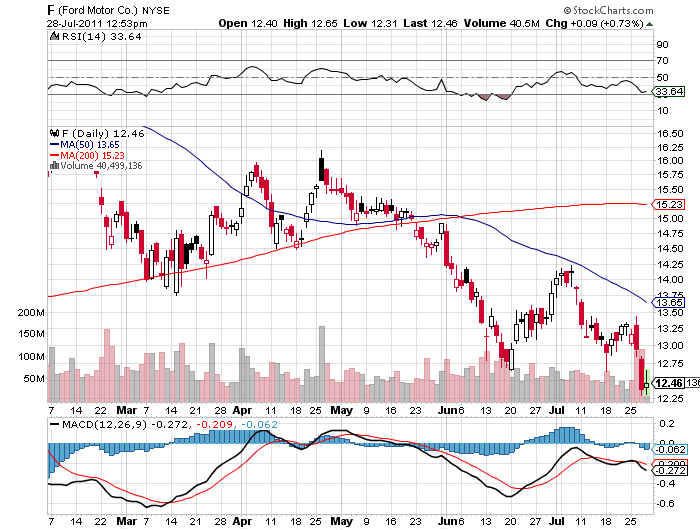
(WHAT FORD IS TELLING US ABOUT PLATINUM AND PALLADIUM),
(F), (TTM), (PPLT), (PALL)
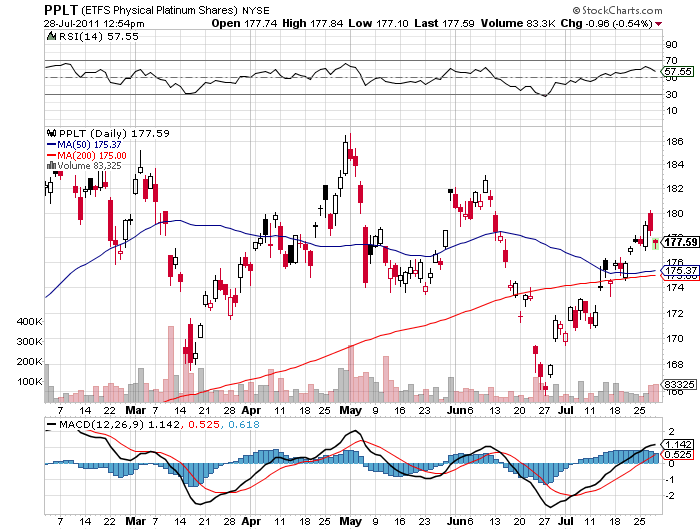
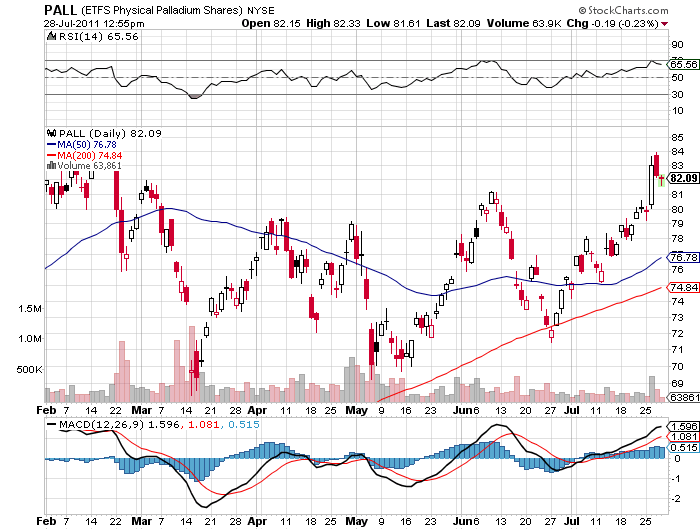
1) What Ford is Telling Us About Platinum and Palladium. Well done to Ford (F), which announced great earnings for Q2, leaving its close call with the junkyard a few years ago well in the rear view mirror. The shocker was in the revenues, which leapt $4 billion to $35 billion.
The big movers here were not in the stock of Henry Ford's legacy, but in the semiprecious metals of platinum (PPLT) and palladium (PALL), up 9% and 18% respectively in the past month. These are key components in the catalytic converters that must go into every American made car.
The US car market is rebounding off an annualized rate of 9.5 million units at the 2009 bottom, could reach 13 million units this year, and may rise as high as 15 million units by 2015. This soaring demand promises to keep these white metals on the boil for years to come.
Metals prices generally have benefited from recent strikes in Chile and South Africa. Any gold miner will now tell you that his biggest headache is the rapidly rising cost of production, from labor to the cost of heavy industrial tires.
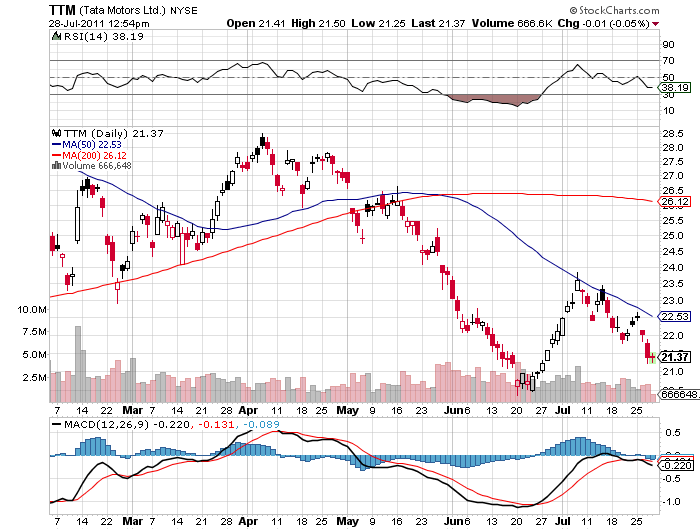
Ford made another interesting announcement. It is investing $1 billion to build low end cars at a new plant in India. One of my old mentors, Carl Van Horn, chief investment officer at JP Morgan, taught me to always watch direct investment, and the stocks will follow. If Ford is making the right call here, then you have to like Tata Motors (TTM), India's largest car manufacturer, whose stock has recently seen a big selloff on inflation fears.
-
-
-
-
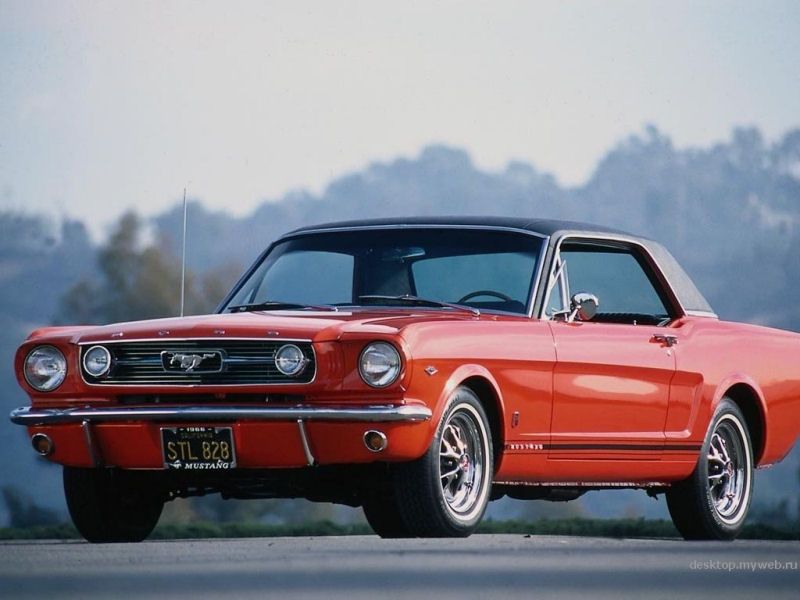
Is This the Future?
-
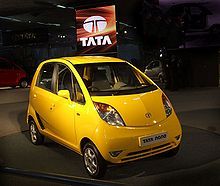
Or This?
Featured Trades: (WELCOME TO THE FUNNY FARM), (SPX)
1) Welcome to the Funny Farm. I promised you a roller coaster for the financial markets this week, and that is exactly what we are getting. The on again/off again talks and the finger pointing that follows seems to be generating round lot moves of 30 points in the S&P 500. The high frequency trading algorithms are running wild.
Keep in mind that what the republicans in the House of Representatives are trying to pull off here nothing less than a Coup '?d Etat. Their machinations are a blatant attempt to expand the power of the House while they command a majority. The debt ceiling has never before been used in this way.
They have taking a normal housekeeping matter and to turn it into a political weapon. Now that they have set the precedent, you can expect the democrats to behave just as badly next time they are in the driver's seat, making all our lives permanently miserable.
I have traded markets like this before, and there is only one way to do it. Close your eyes and stop thinking. Become a robot yourself. If the market is up big, sell it. If it is down big, buy it. It is impossible to predict how the next headline will read. Stocks are really operating independent of the though process. Try an analyze this, and it will just blow up in your face.
Using this twisted, but functional logic, the thing to do after a 50 point sell off in three days is to buy. Just write the damn ticket. If you are mercifully mostly in cash, as I am, then you have plenty of dry powder to do this with. If you don't, you're screwed.
-
Oops, There Goes My Position
Featured Trades: (HOME PRICES STILL DEAD IN THE WATER)
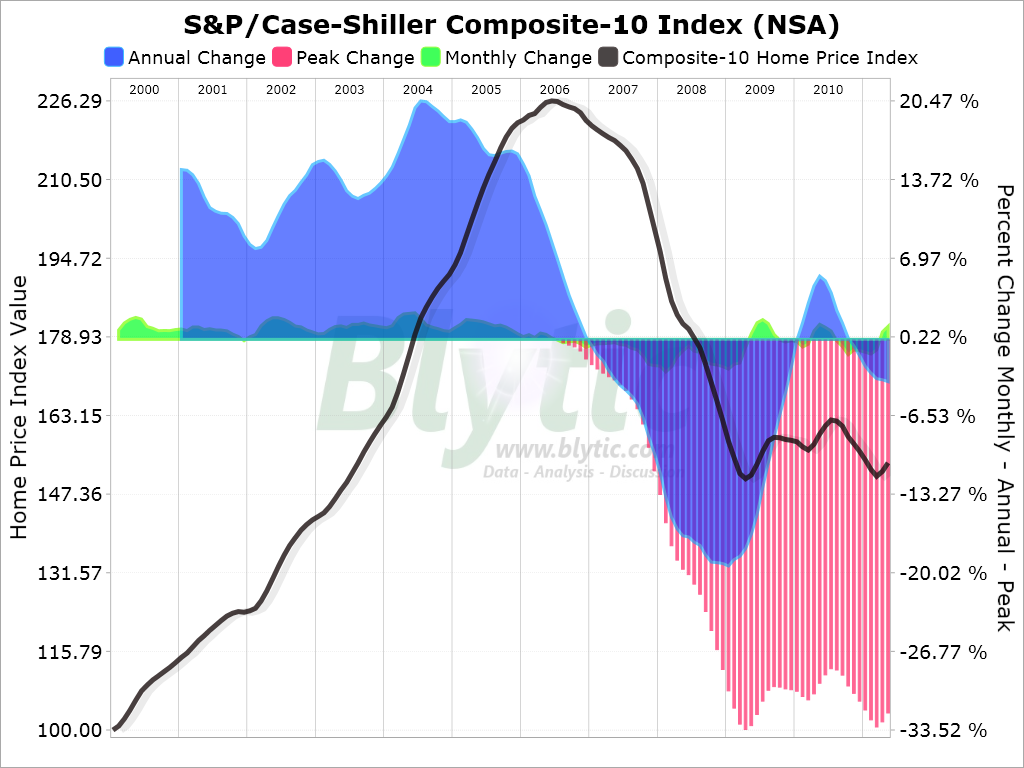
2) Home Prices Still Dead in the Water. Case Shiller released their national home price index for May yesterday, allowing beleaguered real estate agents to let out some feeble, halfhearted cheers. The data showed that prices did not go down last month and are even rising modestly in a few markets, bouncing along some sort interim bottom. The ten market index is up 1.13% since April, while the 20 market index crawled up 1.02%.
Professionals ascribe the modest increases to seasonal strength concurrent with the spring buying season. It is important to note that all of the new housing starts are for multifamily dwellings (apartment buildings), the sector that caters to new, bottom end purchasing families and immigrants.
The declines from the peak on a city by city basis are truly impressive, with the negative equity states well represented. They include Las Vegas (-59.28%), Phoenix (-55.85%), Detroit (51.19%), Miami (-50.65%). And Tampa (-47.46%).
I don't want to cause any of you homeowners out there to lose sleep, but I think that this is simple a calm before the next storm. This is the best that residential real estate can do, despite record low interest rates, massive state and federal subsidies, and affordability at a 30 year high.
What happens next? Another recession hits, the few private lenders out there withdraw from the market, Fannie Mae and Freddie Mac disappear, forcing home loan interest rates up,? desperate baby boomers cut prices further to reclaim what little equity they have left, and prices drop another 25%. Would I buy a house here? Not on pain of death.
-

Doesn't Look Like a Buy to Me
Featured Trades: (REPORT FROM EUROPE, PART IV)
3) Report From Europe, Part IV. Milan, Italy appears to be a city entirely populated by fashion models riding bicycles on the city's frenetic streets. That is one's first impression coming out of the monolithic Milano Centrale train station, built by Mussolini to reaffirm faith in his state. Despite years of allied bombing during WWII, the building is as imposing as the day it was built.

You Think It's Easy Fitting into a Size 0?
-
I came to this medieval city to speak at another strategy luncheon, which was attended by readers from throughout Europe, from the surgeon hailing from Trondheim, Norway, to the Hungarian hedge fund manager. The Westin Hotel provided a spectacular lunch, as only the Italians can.
Much of the conversation revolved around the Euro, which everyone in the room to a man believed was grotesquely overvalued, given the continent's economic outlook. Still, as long as the European central bank pursues its mindless policy of raising interest rates to control commodity driven inflation, it will remain firm.
We discussed various breakup scenarios for the EC which come into vogue every time Greek debt gets downgraded, which is often. This is unlikely, given the modern European's dislike for open conflict. Bring nationalism into the equation, and things could deteriorate quickly. Germany could bail, unwilling to refinance the debt of lazy, tax avoiding, garlic eaters. Southern Europe could do a disappearing act, unwilling to pay their debts to the sauerkraut eaters up North.

Yes, I Can Be Bribed
-
In either case, the European currency bloc shrinks, or disappears completely. It is just a matter of time before an opportunistic political party rides this fast track into power. The Germans will tell you from hard earned experience that this always ends badly.
I cautioned that the risk of nationalism was probably greater in the US now than in any other major country. Of the dozen republicans now vying for the presidential nomination, at least three could be described as extremist, pandering to conservative America's worst fears (high taxes, immigration, cap and trade, gay marriage, the rise of minorities).
An isolationist America would withdraw from international organizations, like the United Nations, the World Bank, and the IMF. Bush's wars in Iraq and Afghanistan would be stepped up, while we would probably walk away from Obama's war in Libya. It would adopt a more threatening posture towards Russia and China. Remember, Sarah Palin threatened to launch a nuclear war against Russian for its invasion of Azerbaijan. We laughed, the Russians, not so much.
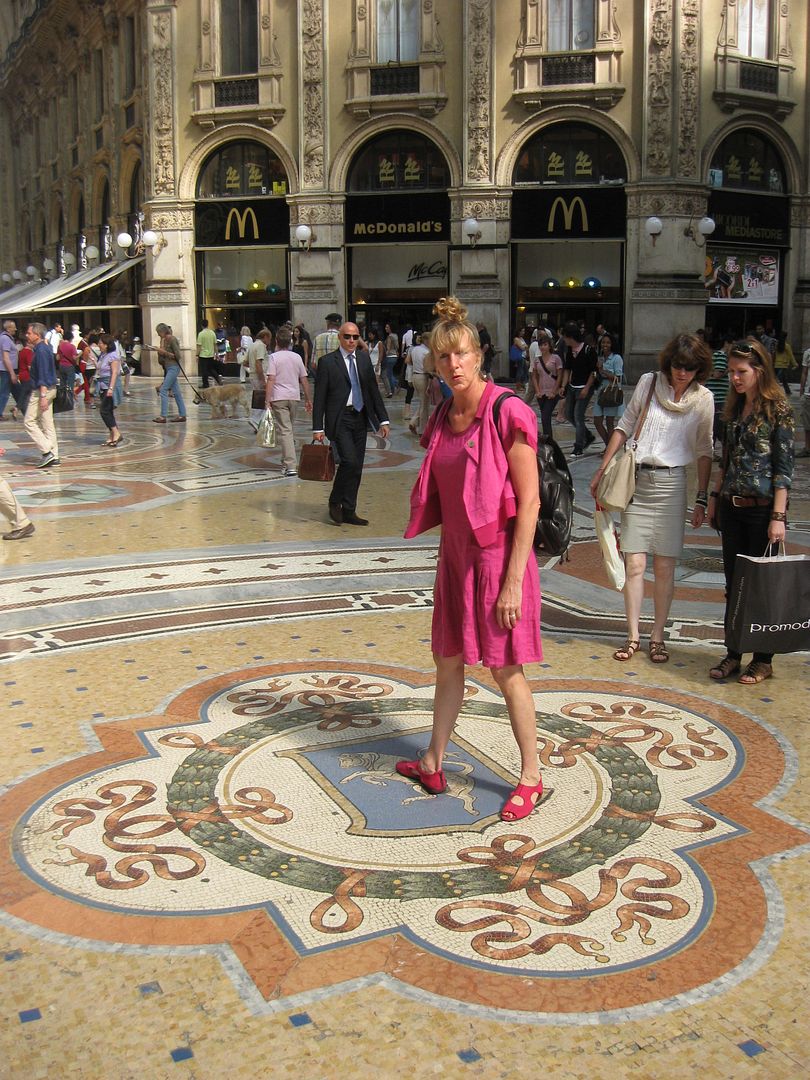
I had exactly one free afternoon to spend in this amazing city. I visited Michelangelo's Last Supper at Santa Maria della Grazie monastery, looking for evidence of the conspiracy theories long ascribed to this masterpiece. I did a quick run through the Galleria and stepped on the bull's balls, conducting three clockwise rotations to bring good luck. Looking at my performance since then, it obviously worked. The impact of the fashion industry on Milan is enormous, with every conceivable brand imaginable on show.
I managed to scoot into the main Brioni store just before closing. There, I watched two Russian Mafia types in their thirties buy a half dozen exquisitely tailored, 200 thread count suits each for $6,000 apiece. That's $72,000 worth of clothes'?. for guys! Alas, they don't carry an American size 48 long in stock, it would have to be a custom order, so I left with only a couple of Leonardo ties in hand. In any case, I happen to know that I can get the identical suit at the Brioni shop Caesar's Palace in Las Vegas for half, thanks to flaccid Uncle Buck, plus they likely have my size. And I will be there in two months for a strategy luncheon (see above).
The next morning found me in a mad dash back to the train station, my taxi driver artfully weaving in and out of traffic, where I boarded a first class Eurostar train. The engine powered North towards the Italian Alps, passing through the Milan slums. Retracing the route seen in the classic Frank Sinatra war flick, Von Ryan's Express. Next stop: Zermatt, Switzerland, and the Matterhorn.
To be continued.