A huge new buyer may eventually enter the gold market.
That could be a year off, maybe two, or three at the most.
I’ll give you a hint who: your taxes will pay for it.
If true, it could send the price of the barbarous relic soaring above $5,000, or even $50,000 an ounce, a target long led by the tin hat Armageddon crowd.
When I spoke to a senior official at the Federal Reserve the other day, I couldn’t believe what I was hearing.
If the American economy moves into the next recession with rising inflation, a near certainty, its hands will be tied. It dare not cut rates for fear of further fanning the flames.
At that point, our central bank’s primary tool for stimulating US businesses will become utterly useless, ineffective, and impotent.
What else is in the tool bag?
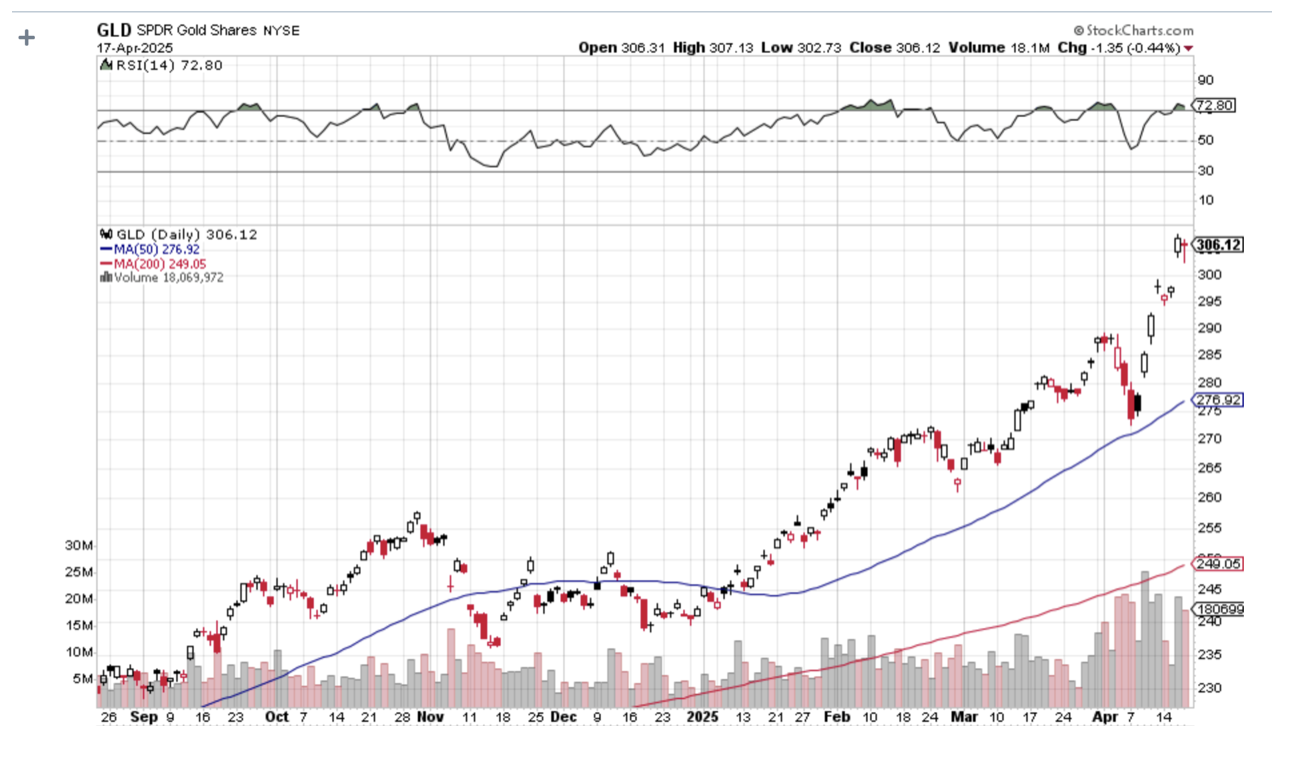
How about large-scale purchases of Gold (GLD)?
You are probably as shocked as I am by this possibility. But there is a rock-solid logic to the plan. As solid as the vault at Fort Knox.
The idea is to create asset price inflation that will spread to the rest of the economy. It already did this with great success from 2009-2014 with quantitative easing, whereby almost every class of debt securities was hoovered up by the government.
“QE on steroids” would involve large-scale purchases of not only gold, but stocks, government bonds, and exchange-traded funds as well.
If you think I’ve been smoking California’s largest cash export (it’s not almonds), you would be in error. I should point out that the Japanese government is already pursuing QE to this extent, at least in terms of equity-type investments.
And, as the history buff that I am, I can tell you that it has been done in the US as well, with tremendous results.
If you thought that President Obama had it rough when he came into office in 2009, it was nothing compared to what Franklin Delano Roosevelt inherited.
The country was in its fourth year of the Great Depression. US GDP had cratered by 43%, consumer prices had crashed by 24%, the unemployment rate was 25%, and stock prices had vaporized by 90%.
Mass starvation loomed.
Drastic measures were called for.
FDR issued Executive Order 6102 banning private ownership of gold, ordering citizens to sell their holdings to the US Treasury at a lowly $20.67 an ounce.
He then urged Congress to pass the Gold Reserve Act of 1934, which instantly revalued the government’s holdings at $35.00, an increase of 69.32%. These and other measures caused the value of America’s gold holdings to leap from $4 to $12 billion.
Since the US was still on the gold standard back then, this triggered an instant dollar devaluation of more than 50%. The high gold price sucked in massive amounts of the yellow metal from abroad creating, you guessed it, inflation.
The government then borrowed massively against this artificially created wealth to fund the landscape-altering infrastructure projects of the New Deal.
It worked.
During the following three years, the GDP skyrocketed by 48%, inflation eked out a 2% gain, the unemployment rate dropped to 18%, and stocks jumped by 80%. Happy days were here again.
However, in the 21st-century version of such a gold policy, it is highly unlikely that we would see another gold ownership ban.
Instead, the Fed would most likely move into the physical gold market, sitting on the bid for years, much like it did in the 2010s Treasury bond market for five years. Gold prices would increase by a multiple of current levels.
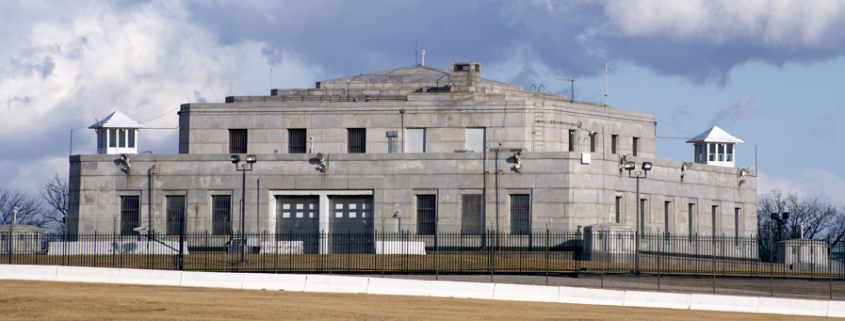
It would then borrow against its new gold holdings, plus the 4,176 metric tonnes worth $40 billion at today’s market prices already sitting in Fort Knox, to fund a multibillion-dollar tax cut.
Yes, this all sounds like a fantasy. But negative interest rates were considered an impossibility only a few years ago.
The Fed’s move on gold would be only one aspect of a multi-faceted package of desperate last-ditch measures to resuscitate the economy at some point in the future. The time to start buying gold is RIGHT NOW!
Persistent urban legends and Internet rumors claim that the vault is actually empty or filled with fake steel bars painted gold.
That is, until Treasury Secretary Steven Mnuchin visited the vault on his way to view the solar eclipse at government expense in August 2017.
He says the gold is still there. But only if you believe Steve Mnuchin. A lot don’t.
We’ll never know for sure. Visitors are not allowed.
The Next Economic Stimulus Program?
https://www.madhedgefundtrader.com/wp-content/uploads/2018/10/Fort-Knox-oct25.png600897MHFTFhttps://madhedgefundtrader.com/wp-content/uploads/2019/05/cropped-mad-hedge-logo-transparent-192x192_f9578834168ba24df3eb53916a12c882.pngMHFTF2025-04-29 09:02:532025-04-29 11:34:23The Next Thing for the Fed to Buy is Gold
Last week, a concierge customer asked me an excellent question. Having correctly called the top in this market to the hour, what would it take for me to go all in on the long side and get maximum bullish?
With everyone now laser-focused on downside risks, which was really a last February game, I thought I’d take the opportunity this morning to examine the upside possibilities, if there are any at all.
Let’s say that the trade war ends before the ninety-day deadline is up on July 9, and the Chinese tariffs are reduced from a trade embargo of 145% to, say, only 20%. Markets will instantly rally 10%, with possibly half of that move happening at a market opening, so you can’t participate.
That is in effect, as what happened last week, with investors willing to look through the trade war to a less onerous business environment sometime in the future. A 20% tariff still takes the US growth rate down to zero, but it at least takes a recession off the table. Problem number one: Zero-growth economies don’t command high earnings multiples.
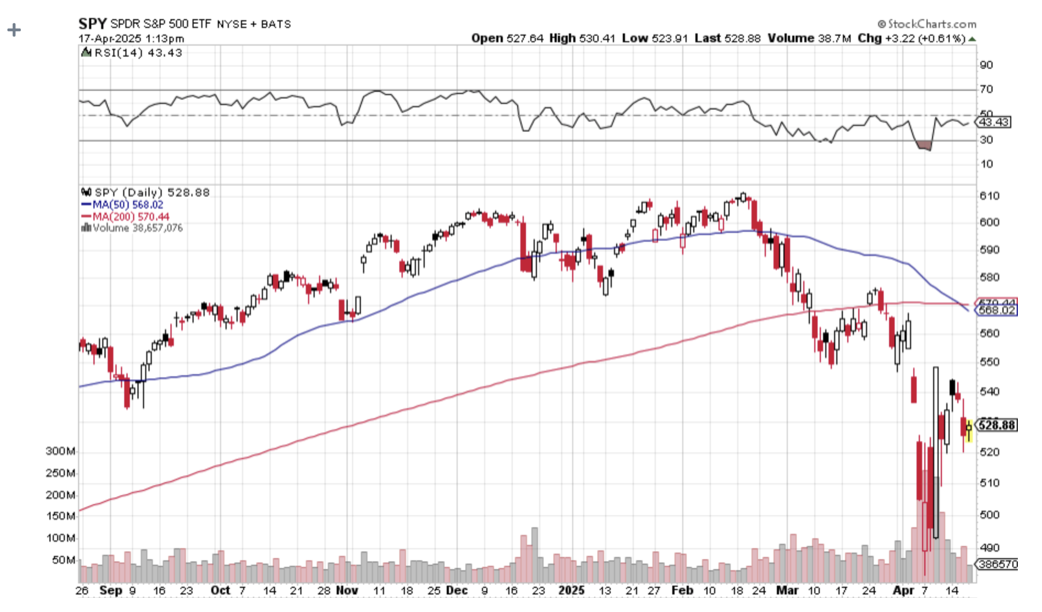
The problem with that scenario is that we hit a wall of selling above 5,800, where the late entrants came in but are now trying to get out, at close to cost. To get above that level, we need a really powerful fundamental bull case, which is now nowhere on the horizon. That’s why it’s unlikely that the stock market will see any positive returns for 2025.
The reality is that the trade war is not the only place where the economy has been driven off the rails. Even a 20% tariff brings substantially higher prices. International trade is falling off a cliff. Massive cuts in government spending are highly deflationary. Deporting large numbers of immigrants reduces demand and shrinks the labor supply. Unless Congress can pass a budget bill soon, we are on track to see an automatic $5 trillion tax increase by yearend. The budget deficit will hit a new record for this year.
Needless to say, companies will continue to sit on their hands with this amount of uncertainty and wait for the many unknowns to play out. None of these commands higher multiples for equities, let alone the near record S&P 500 multiple at 20X that prevails now.
To really get maximum bullish like I was for most of the last 15 years, the economy would have to return to the conditions that took stocks to record highs like we had until three months ago. That would be a globalized free-trading economy with the US playing a dominant role. That’s an economy that deserves high earnings multiples.
We won’t see that for at least four more years, but markets may start to discount it in only three years as we run up to the next presidential election in 2028. Imagine a future presidential candidate who campaigns on a zero-tariff regime and a return to globalization.
To get a sustainable multi-year bull market in stocks, it would help a lot if we started from a much lower base first. New bull markets don’t start at 20X multiples. A 16X multiple is much more likely, or 20% lower than we are now. We may get that.
The government is currently trying to break up three of the Magnificent Seven with antitrust actions, which led the march to higher stock markets for years. Corporate earnings are now rapidly shrinking, but we won’t see the hard numbers until August. Until then, we only get forecasts. Lower earnings command much lower multiples. That leaves on the table my 4,500 forecast low for the (SPX).
We could well be stuck in a trading range for years. Stocks could continue to bump their heads up against a (SPX) 5,800 ceiling but also get talked up by the administration whenever it collapses towards 4,800. Some 1,000 (SPX) points is quite a wide trading range to play with and plenty enough to make money on.
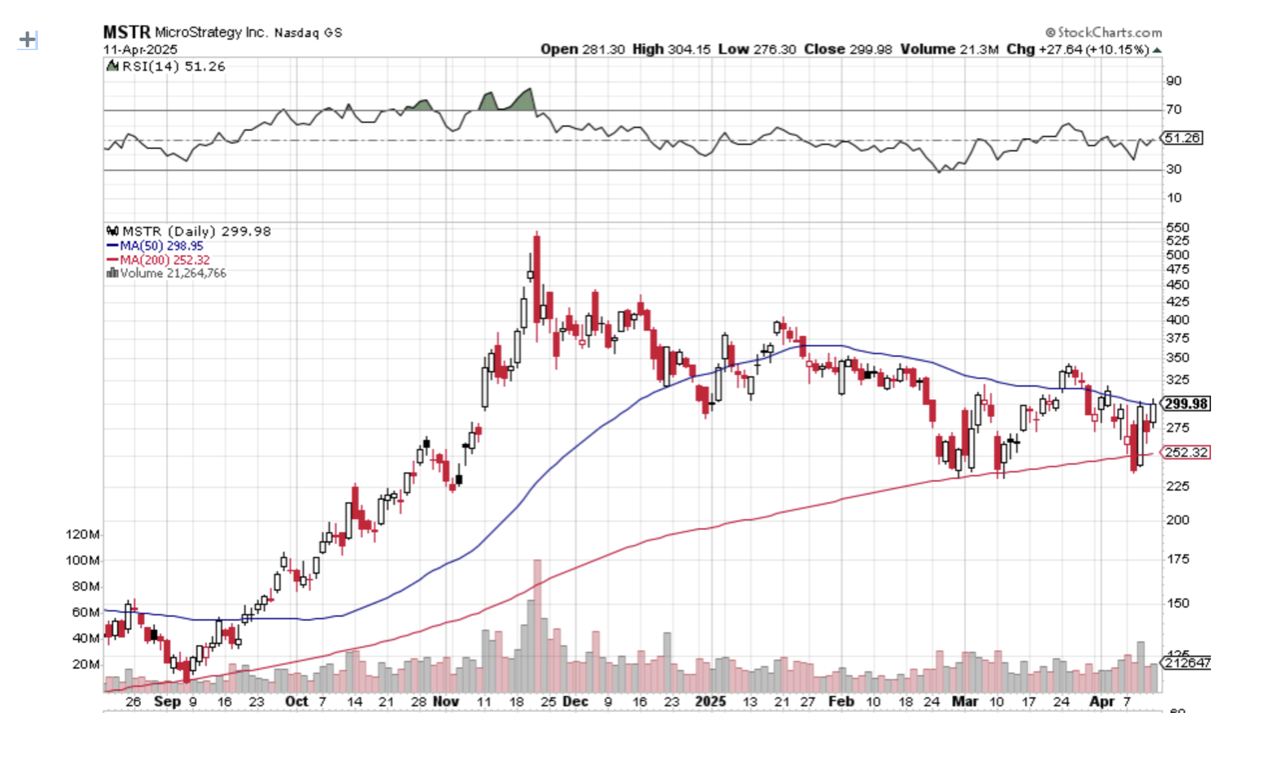
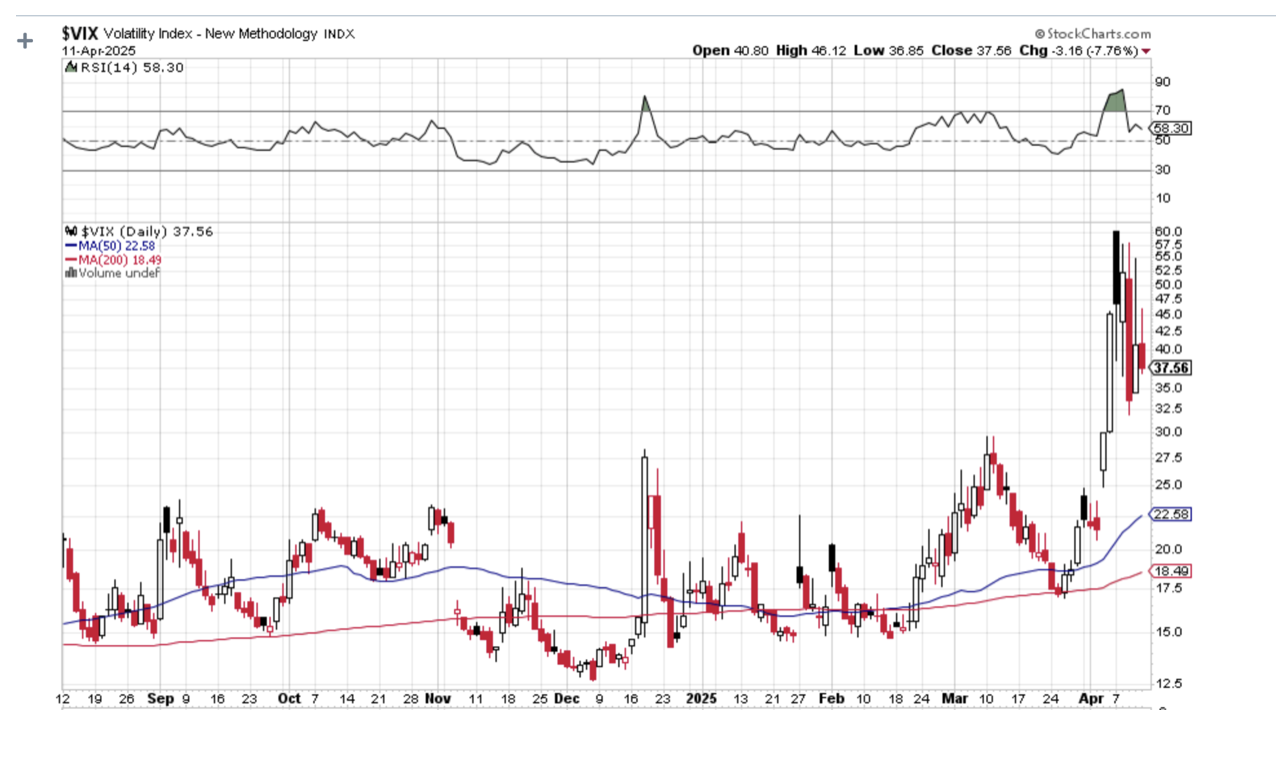
I did it only last week. You have to ignore the news flow and use the volatility index ($VIX) for your market timing. When the ($VIX) hit $54 last week, I piled on longs in (NFLX), (NVDA), (MSTR), and (JPM). By Friday, I gained 8.12% in new performance, my best weekly return in the 17-year history of Mad Hedge Fund Trader.
What if you just want to take a long-term view and not have to check the ($VIX) in between every putt on the golf course?
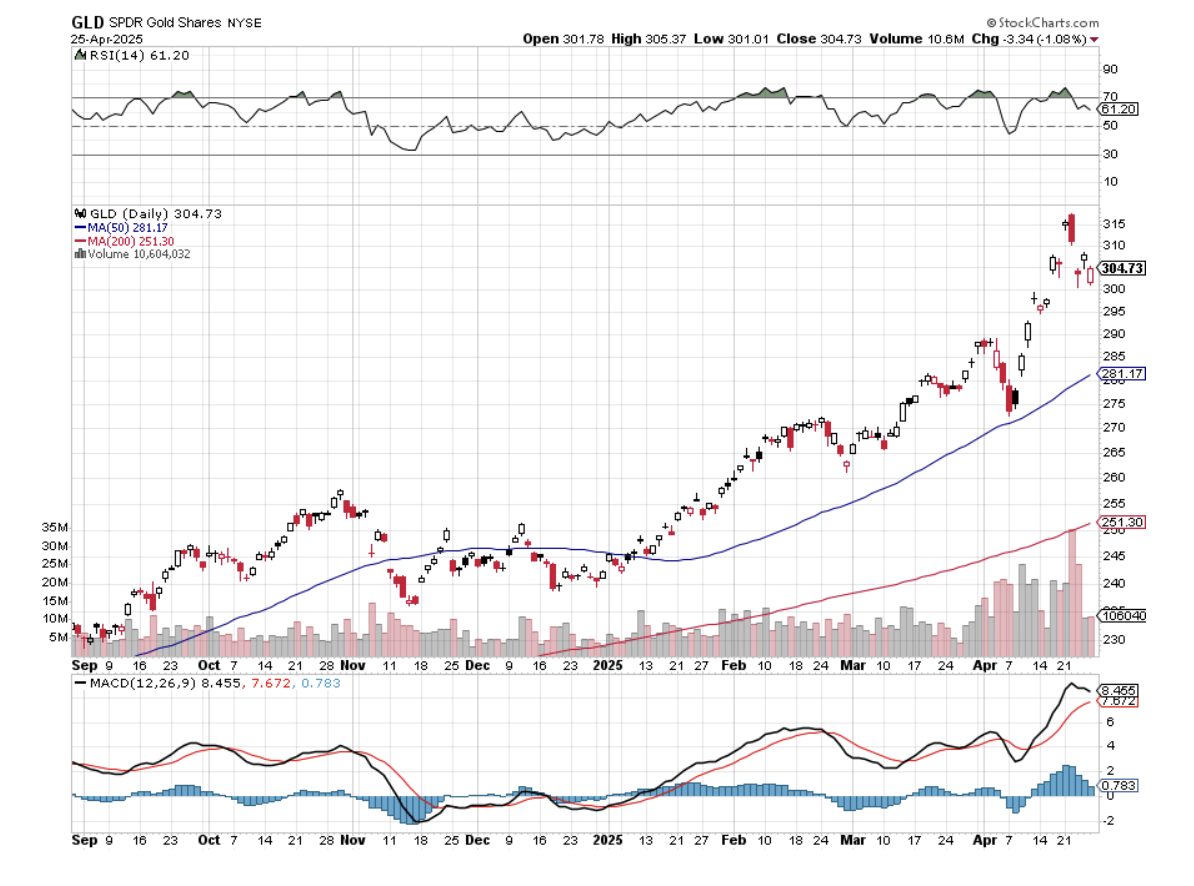
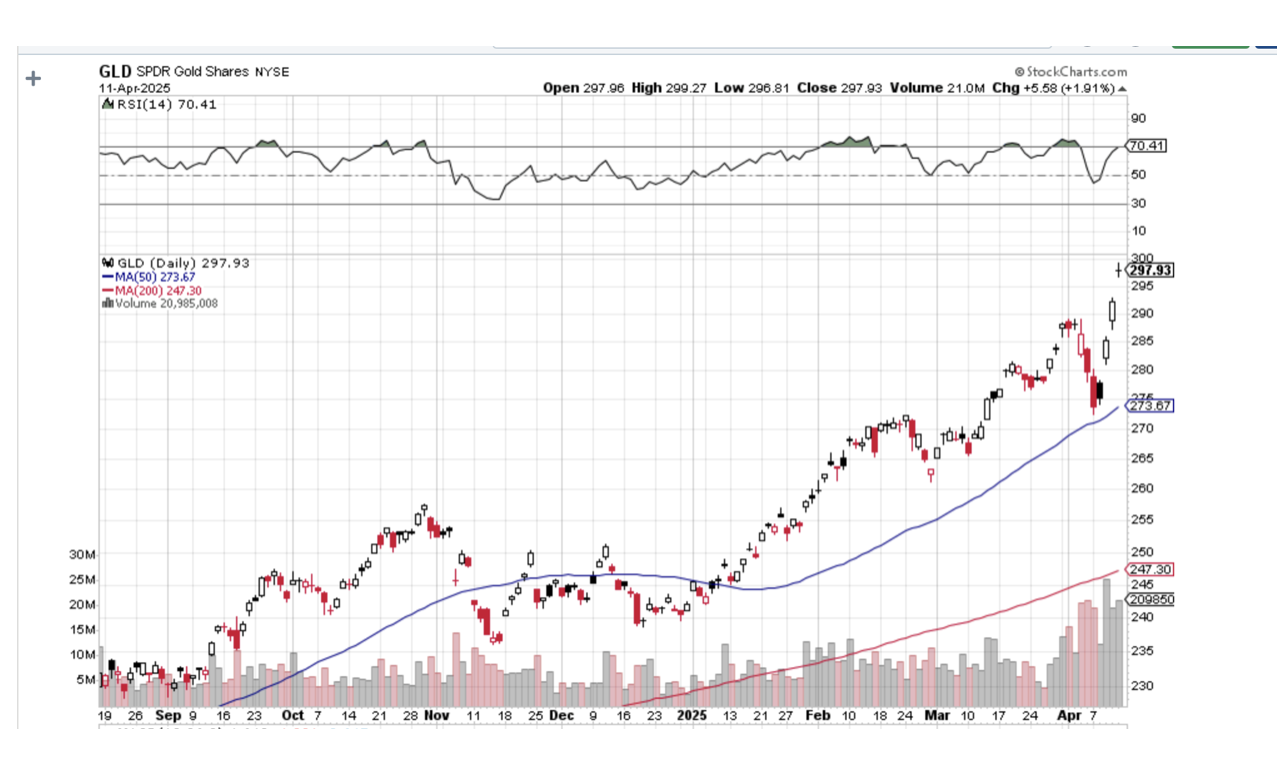
Gold (GLD) is looking pretty darn good right now. With the collapse of the US dollar ongoing, flight to safety assets is in short supply. American economic conditions will get worse before they get better. Central bank accumulation has continued at its torrid decade-long pace. And gold seems to have broken the link with interest rates that held it back for so long, eliminating opportunity cost as an issue. Even ultra-cautious JP Morgan expects the barbarous relic to reach $4,000 an ounce this quarter. The great mystery in the sector has been the lagging performance of the gold miners. While gold doubled, the shares of Barrack Gold (GOLD) went nowhere.
Gold miners have yet to be taken seriously by mainstream institutional investors, as they are often the subject of excessive promotion, scams, and outright fraud. Token or non-existent dividends are another impediment. Millennials have clearly gravitated towards crypto instead. Miners also got a bad rap from the ESG investment trend as they are considered a “dirty” industry. Anything US dollar-denominated is being dragged down by the weak greenback. That’s why gold only accounts for 0.54% of global portfolios today, versus 2.48% in 1998.
That may all be about to change.
Last week, Barrack Gold, which mines gold at a cost of $1,600 an ounce and sells it at the recent $3,500, completed a monster 23% move in the shares. Newmont Mining (NEM) completed an incredible 32% move. Gold attractiveness is such that only a 5% decline was enough to pull me back in on the long side last week.
High prices atone for a lot of sins.
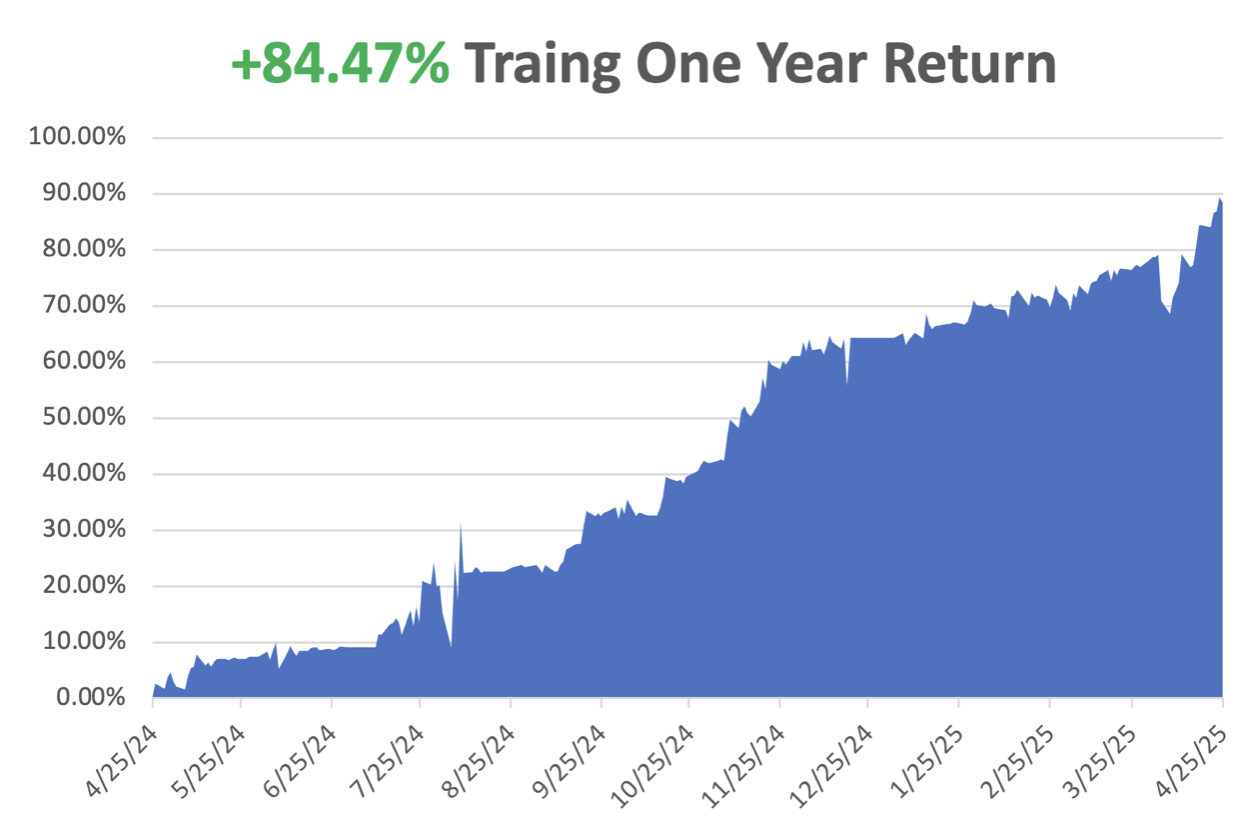
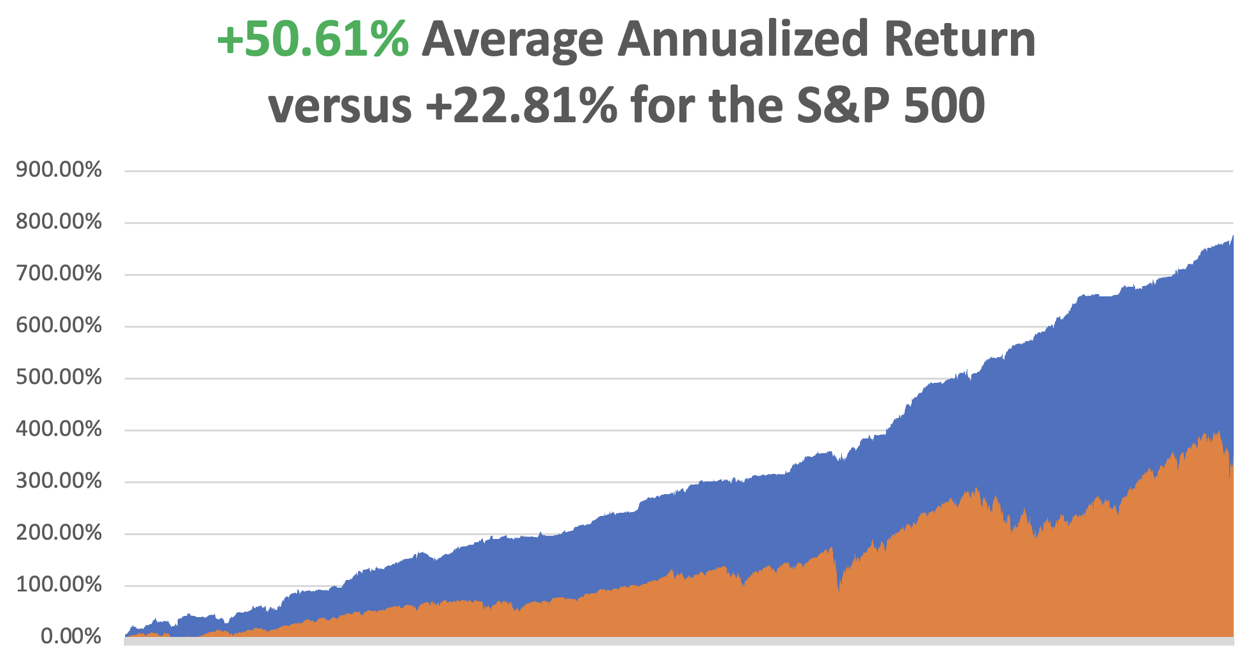
April is now up by a spectacular +10.31%. That takes us to a year-to-date profit of +24.14%so far in 2025. My trailing one-year return stands at a spectacular +84.47%. That takes my average annualized return to +50.61%and my performance since inception to +776.03%, a new all-time high.
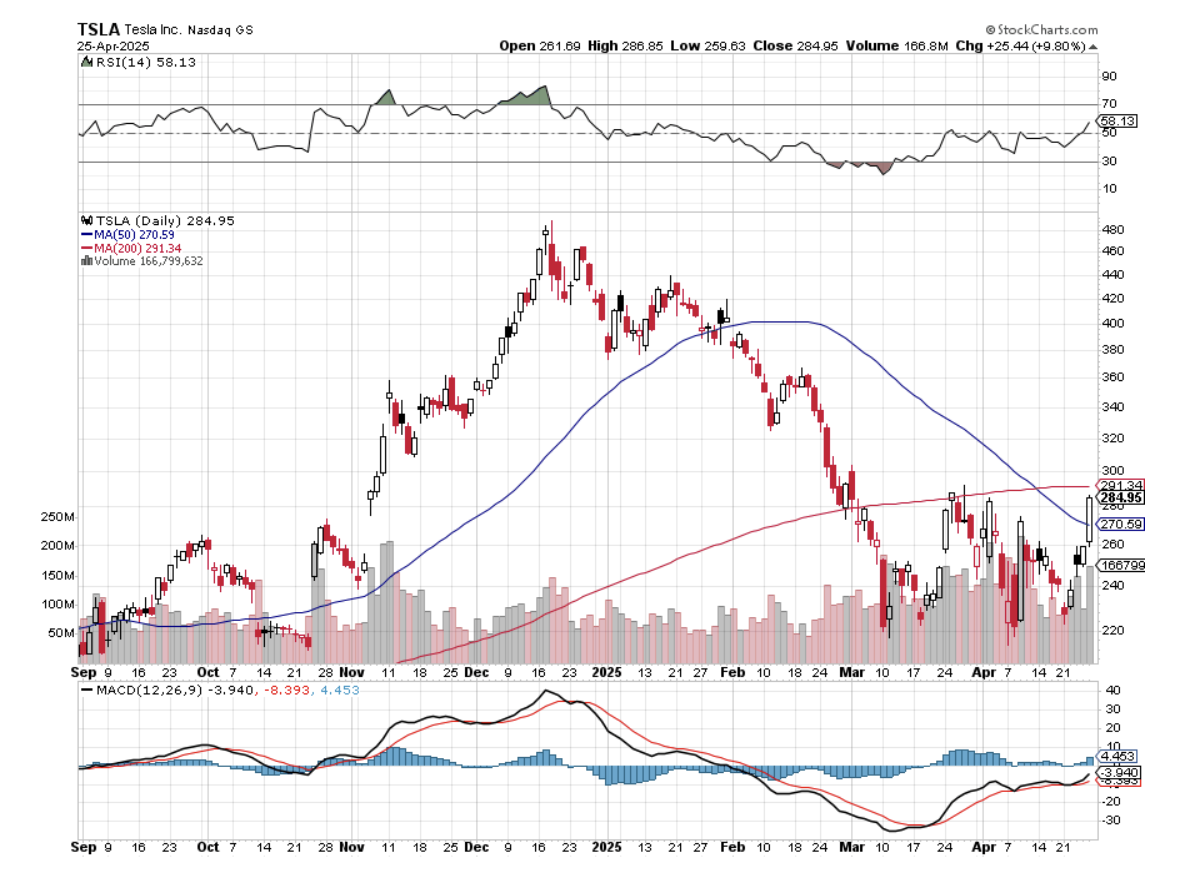
It has been another wild week in the market. I used the 1,200-point meltdown in the Dow Average on Monday to add longs in (NFLX), (JPM), and (MSTR). I also quickly covered a short in (MSTR). After the market rallied 2,000 points, I added shorts in (TSLA), (SPY), and a new long in (GLD). That leaves me 40% long, 30% short, and 30% cash. If everything goes our way on the May 16 options expiration day, we will be up 30% on the year.
Some 63 of my 70 round trips in 2023, or 90%, were profitable. Some 74 of 94 trades were profitable in 2024, and several of those losses were really break-even. That is a success rate of +78.72%.
Try beating that anywhere.
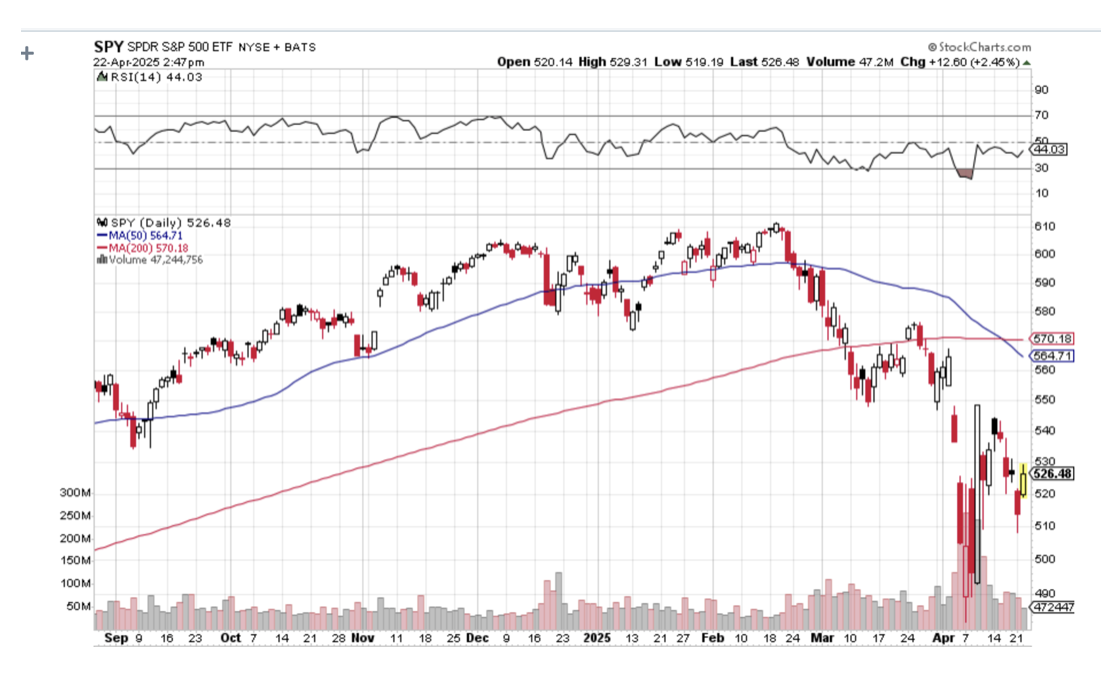
Stock Market Suffers the Worst Start to a Year in History. April was the worst since 1932, and lower lows beckon. The Real “Trump Trade” was a “Sell America” trade, with stocks, bonds, energy, and the US dollar all collapsing.
Fed Beige Books Point to Stagflation. Prices are rising and economic activity has begun to slow across parts of the nation as businesses and households try to adapt to Trump’s erratic rollout of sweeping tariffs aimed at reshaping global trade, a report Wednesday from the Federal Reserve showed.Uncertainty around international trade policy was pervasive across reports, the U.S. central bank said.
Leading Economic Indicators Plunge, published Monday by research group The Conference Board, fell 0.7%, to 100.5, in March, following an upwardly revised 0.2% decline in February. Economists polled by The Wall Street Journal had expected a 0.5% decline for March. The recession is here, you just don’t know it yet. Europe Lowers Interest Rates, down 0.25% to 2.25%, to head off a recession caused by Trump tariffs. The bank’s rate-setting council decided at a meeting in Frankfurt to lower its benchmark rate by a quarter percentage point to 2.25%. The bank has been steadily cutting rates after raising them sharply to combat an outbreak of inflation from 2022 to 2023.
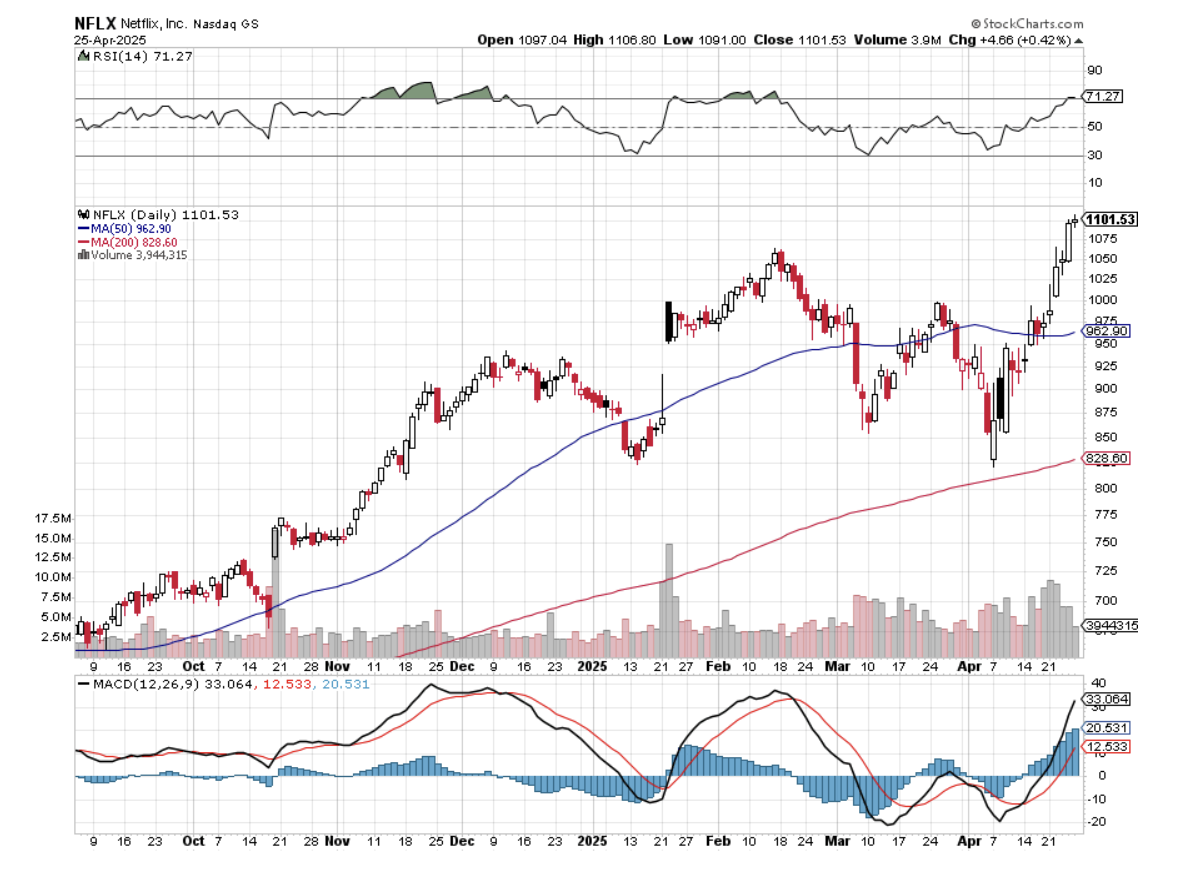
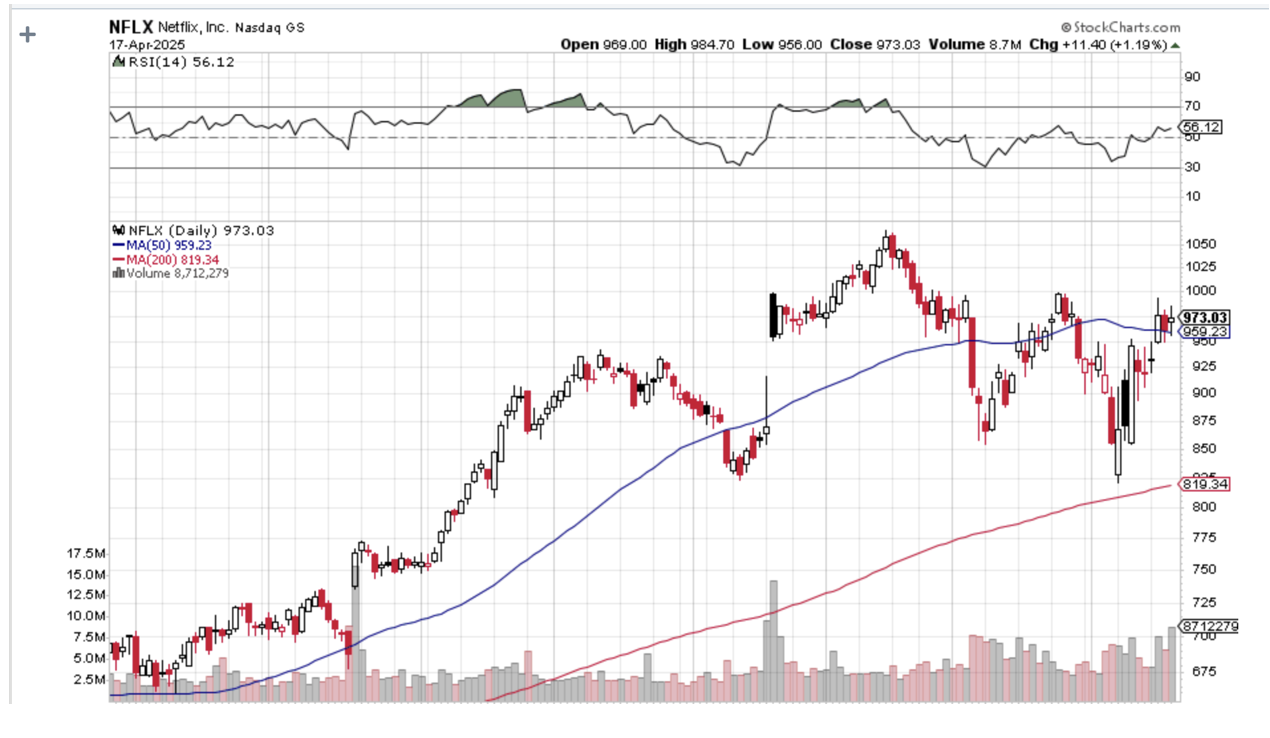
Netflix Earnings rocket, setting the stock on fire, as an indication that the stock may be recession-proof. Netflix reported first-quarter adjusted earnings of $6.61 a share on revenue of $10.54 billion. Analysts surveyed by FactSet expected earnings of $5.67 a share on revenue of $10.5 billion. The stock climbed 3.4% in after-hours trading. As of the market close Thursday, it has risen 9.2% this year. Buy (NFLX) on dips. IMF Cuts US GDP forecast for 2025 from 2.8% to 1.8%, and they are a deep lagging indicator. The prediction is part of a wide-ranging reduction in global growth. Tariffs are to blame. US Dollar Hits Three-Year Low, as the flight from American trade accelerates. No trade with the US means no need to buy the greenback. Gold Tops $3,424, the 1980 inflation-adjusted all-time high. A shortage of “Sell America” trades is driving everyone into gold all at once. The (GDX) gold miners ETF hit a 13-year high. Gold imports are now a major contributor to the US trade deficit.
JP Morgan Targets Gold at $4,000 in Q2, as the “Sell America” trade gathers steam. Central banks are the big winners here, which have been hoovering up the barbarous relic for years.
Tesla Bombs, with Q1 earnings down a gob-smacking 71%, a four-year low. Sales are in free fall globally. Tesla’s cost of making and selling vehicles dropped over 17% year over year, driven by lower raw material prices and reduced expenses of ramping up Cybertrucks production.Automotive gross margin for the period, excluding regulatory credits, was 12.5%, down from 30% a year ago, compared with expectations of 11.8%. Tesla short sellers have earned $11.5 billion so far this year, including myself, with the stock down 55%. The shares rose $10 on news that Elon Musk will spend significantly less time with DOGE. Buy only the biggest dips in (TSLA). Record Funds are Pouring into Japan. Overseas investors have bought a net ¥9.64 trillion ($67.5 billion) of the Asian nation’s debt and equities so far in April, according to preliminary weekly figures released by the Ministry of Finance on Thursday. That level is already the most for any month on record, based on balance-of-payments data going back to 1996. What was the only thing Warren Buffett was buying last year? Japanese trading companies. Existing Homes Sales Hit 16-Year Low. Sales of previously owned US homes fell 5.9% in March to an annualized rate of 4.02 million, the weakest March since 2009. The median sales price increased 2.7% from a year ago to $403,700, a record for the month of March and extending a run of year-over-year price gains dating back to mid-2023. Apple to Move All iPhone Production to India. It is a move that has been underway for some time due to China’s soaring labor costs. Since I began covering China in the early 1970s, China's average annualized income has risen from $300 a year to $16,000, up 5,300%. Alphabet (GOOG) Beats, after the company topped Wall Street estimates and showed growth in its advertising and search business. The company suggested that it’s too soon to tally the impact of Trump’s tariffs, but the ending of the de minimis loophole could create a “slight headwind” to its advertising business. The really interesting number was Alphabet’s estimate of a potential market size of 4 billion rides a year for its Waymo autonomous driving taxi service. My Ten-Year View – A Reassessment
We have to substantially downsize our expectations of equity returns in view of the election outcome. My new American Golden Age, or the next Roaring Twenties, is now looking at multiple gale-force headwinds. The economy will completely stop decarbonizing. Technology innovation will slow. Trade wars will exact a high price. Inflation will return. The Dow Average will rise by 600% to 240,000 or more in the coming decade. The new America will be far more efficient and profitable than the old. My Dow 240,000 target has been pushed back to 2035.
On Monday, April 28, at 8:30 AM EST, the Dallas Fed Manufacturing Index is announced.
On Tuesday, April 29, at 3:30 AM, the S&P Case Shiller National Home Price Index isreleased.We also get the JOLTS job openings report.
On Wednesday, April 30, at 8:30 PM, the Q1 GDP growth rateis published, as is the CPI for April.
On Thursday, May 1, at 8:30 AM, the Weekly Jobless Claims are disclosed.
On Friday, May 2, at 8:30 AM, we get the Nonfarm Payroll Report for April.
As for me, when I was shopping for a Norwegian Fjord cruise a few years ago, each stop at a port was familiar to me because a close friend had blown up bridges in every one of them during WWII.
During the 1970s at the height of the Cold War, my late wife Kyoko flew a monthly round trip from Tokyo to Moscow as a British Airways stewardess. As she was checking out of her Moscow hotel, someone rushed up to her and threw a bundled typed manuscript that hit her in the chest.
Seconds later, a half dozen KGB agents dog piled on top of Kyoko. It turned out that a dissident was trying to get her to smuggle a banned book to the West. She was arrested as a co-conspirator and bundled away to the notorious Lubyanka Prison.
I learned of this when the senior KGB agent for Japan contacted me, who had attended my wedding the year before and filmed it. He said he could get her released, but only if I turned over a top-secret CIA analysis of the Russian oil industry.
At a loss for what to do, I went to the US Embassy to meet with Ambassador Mike Mansfield, whom, as The Economist correspondent in Tokyo, I knew well. He said he couldn’t help me as Kyoko was a Japanese national, but he knew someone who could.
Then in walked William Colby, head of the CIA.
Colby was a legend in intelligence circles. After leading the French resistance with the OSS, he was parachuted into Norway with orders to disable the railway system. Hiding in the mountains during the day, he led a team of Norwegian freedom fighters who laid waste to the entire rail system from Tromso all the way down to Oslo. He thus bottled up 300,000 German troops, preventing them from retreating home to defend from an allied invasion.
During Vietnam, Colby became known for running the Phoenix assassination program. It was wildly successful.
I asked Colby what to do about the Soviet request. He replied, “Give it to them.” Taken aback, I asked how. He replied, “I’ll give you a copy.” Mansfield was my witness, so I could never be arrested for being a turncoat.
Copy in hand, I turned it over to my KGB friend, and Kyoko was released the next day and put on a flight out of the country. She never took a Moscow flight again.
I learned that the report predicted that the Russian oil industry, its largest source of foreign exchange, was on the verge of collapse. Only a massive investment in modern Western drilling technology could save it. This prompted Russia to sign deals with American oil service companies worth hundreds of millions of dollars.
Ten years later, I ran into Colby at a Washington event, and I reminded him of the incident. He confided in me, “You know that report was completely fake, don’t you?” I was stunned. The goal was to drive the Soviet Union to the bargaining table to dial down the Cold War. I was the unwitting middleman. It worked.
That was Bill, always playing the long game.
After Colby retired, he campaigned for nuclear disarmament and gun control. He died in a canoe accident on the lake in front of his Maryland home in 1996.
Nobody believed it for a second.
William Colby
Kyoko
Good Luck and Good Trading,
John Thomas
CEO & Publisher
The Diary of a Mad Hedge Fund Trader
https://www.madhedgefundtrader.com/wp-content/uploads/2023/06/colby.jpg16661325april@madhedgefundtrader.comhttps://madhedgefundtrader.com/wp-content/uploads/2019/05/cropped-mad-hedge-logo-transparent-192x192_f9578834168ba24df3eb53916a12c882.pngapril@madhedgefundtrader.com2025-04-28 09:02:492025-04-28 11:45:53The Market Outlook for the Week Ahead, or Here’s the Best Case Scenario
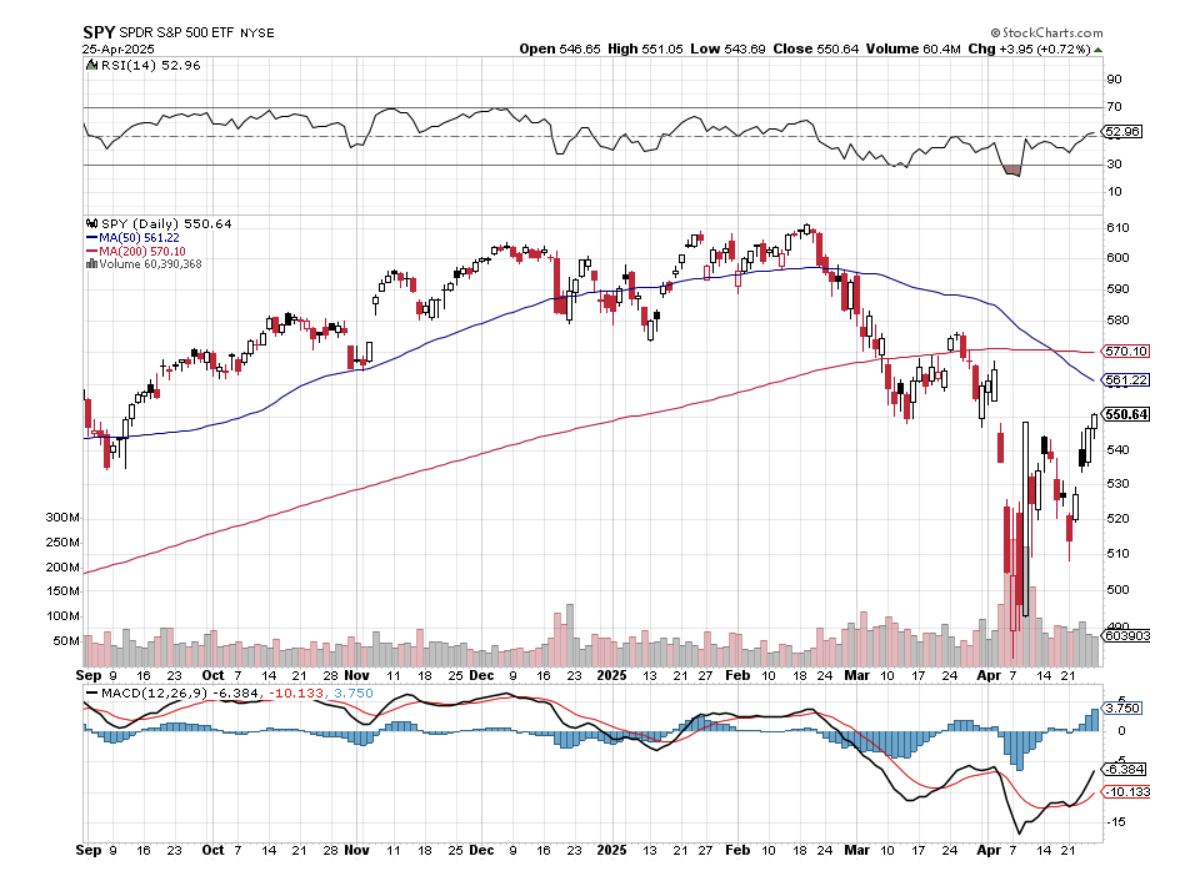
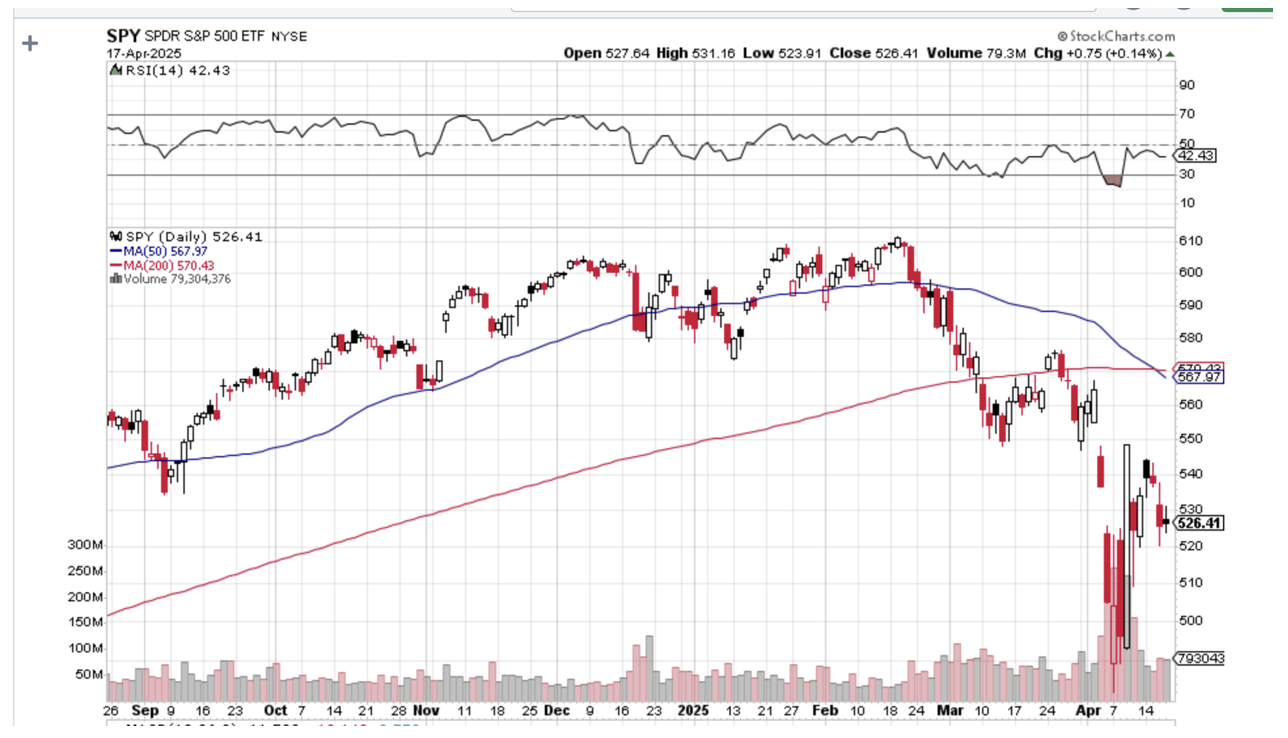
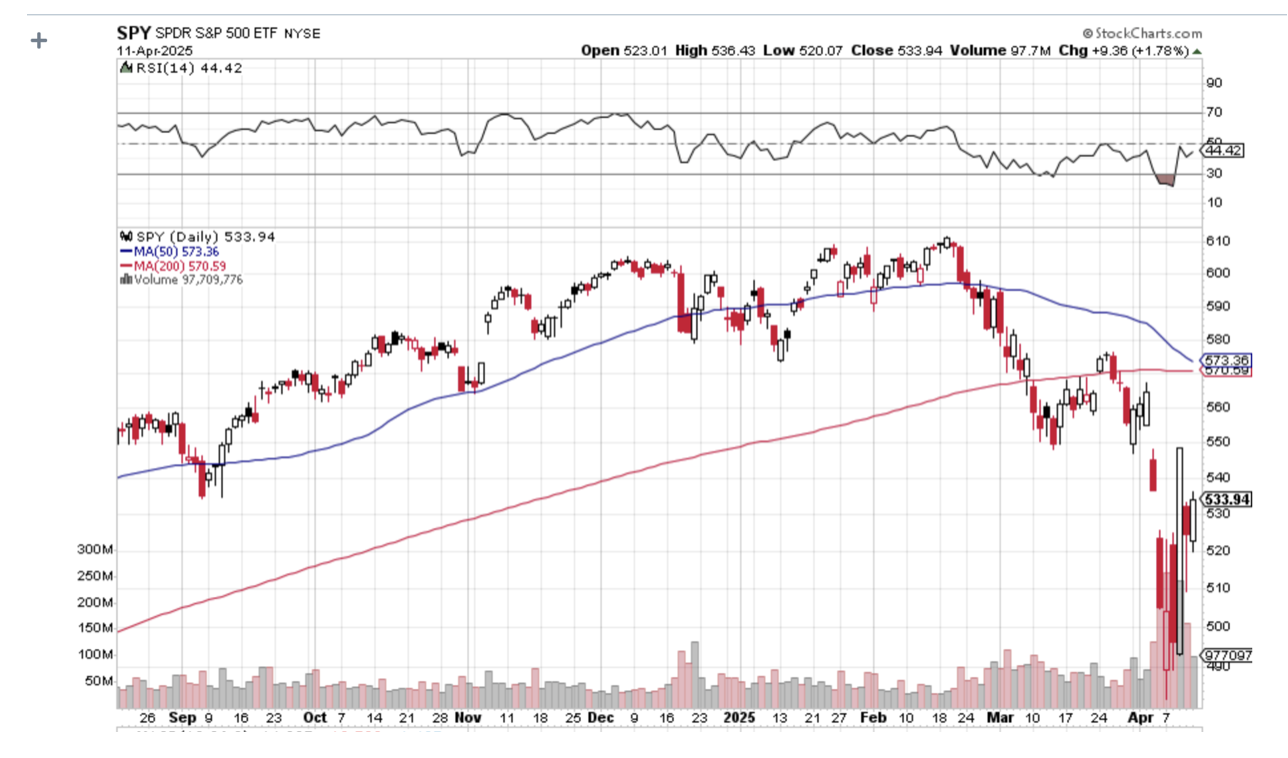
After Monday’s 1,200-point swoon, the S&P 500 (SPY) has fallen 20.88% from its February peak. And we may still have a “Sell in May” ahead of us.
This was one of the most overbought stock markets in my career. I have to think back to the March 2000 Dotcom Top and the Tokyo bubble in 1989 to recall similar levels of ebullience. It seems that everyone in the world is now dumping US bonds and dollars as well.
With a price/earnings multiple of 20, we are still near the top of a long-time historic range of 9-22. High US interest rates make that level appear even more expensive. The “Buy the Dip” crowd has become an extinct species.
So, how much lower do we have to go? I just completed a conference call with some major hedge fund traders, and thought I‘d throw out my numbers and the logic behind them. The following is an itinerary of what your summer trading might look like, expressed in (SPX) terms:
-20.88% - 4,850 – The April 9 low before a tweet triggered a monster 500-point rally.The market is begging for a retest of this level.
-29.52% - 4,320 is an earnings multiple of 18X times unchanged earnings for the (SPX) of $240 a share.
-37.35% - 3,840 is an earnings multiple of 16X times an unchanged earnings for the (SPX) of $240 a share.
-39.96% - 3,680 is an earnings multiple of 16X times a lower earnings for the (SPX) of $230 a share.
-42.57% - 3,520 is an earnings multiple of 13X times an unchanged earnings for the (SPX) of a recessionary $220 a share.
-45.18% - 3,360 is an earnings multiple of 16X times an unchanged earnings for the (SPX) of $210 a share, which assumes the trade war with China extends into 2026.
Big swings in the market also often start and finish around an options expiration, which takes place on the third Friday of each month.
To confuse you even further, contemplate the concept that I refer to as the “Lead Contract.” There is always a lead contract around, one on which all traders maintain a laser-like focus, which leads every other financial product out there. It says “Jump,” and we ask “How High?” It is also always changing.
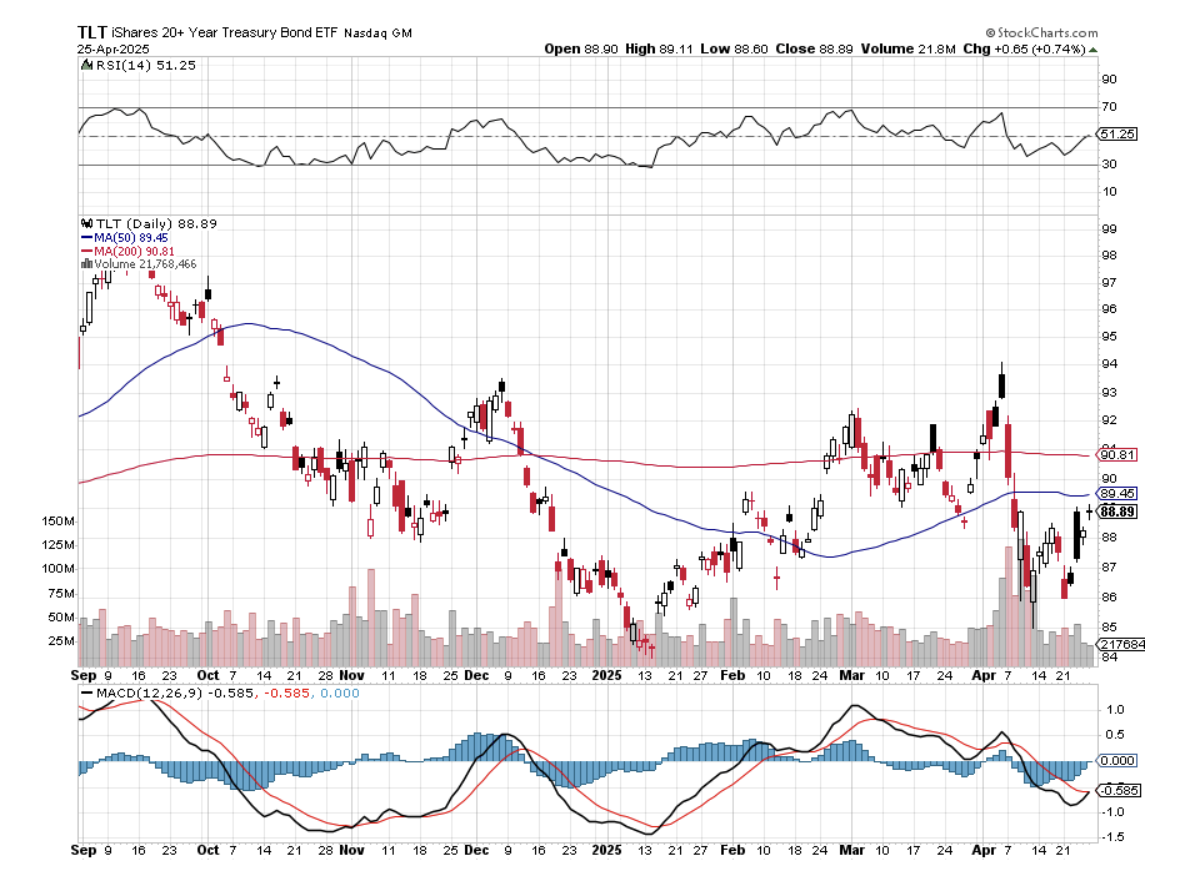
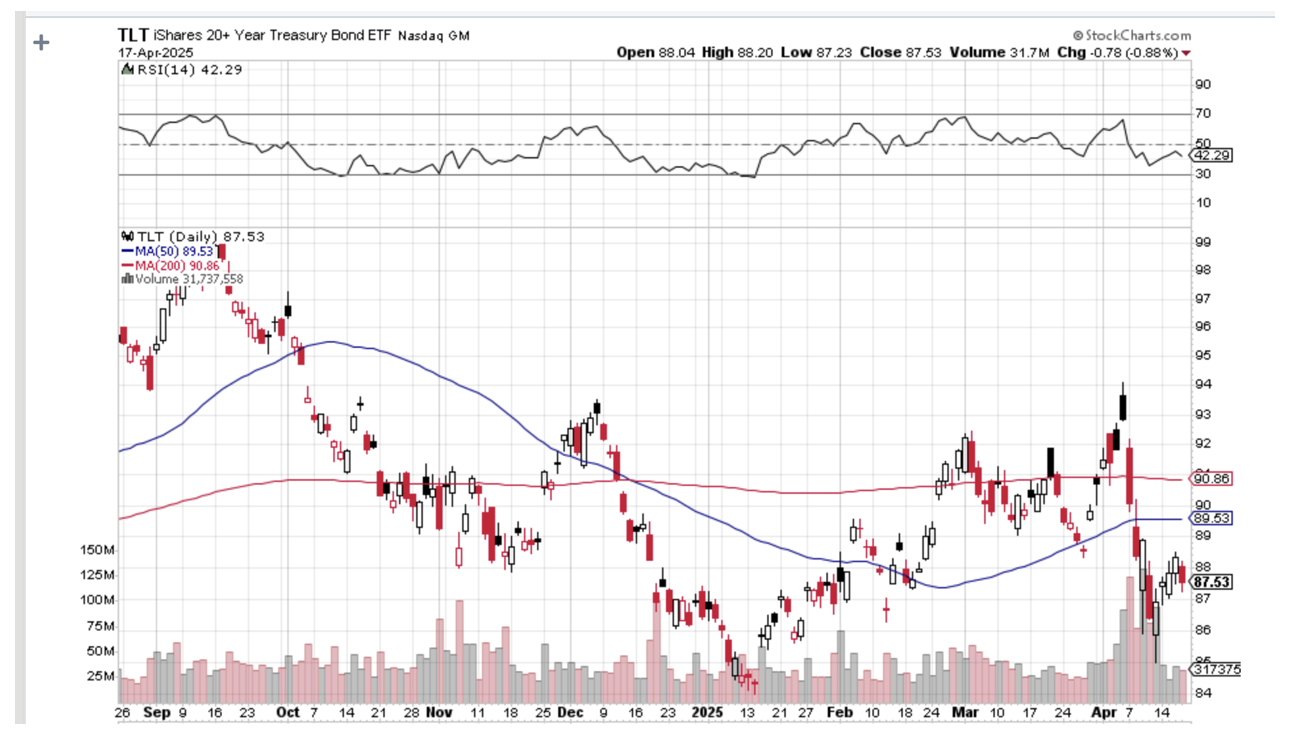
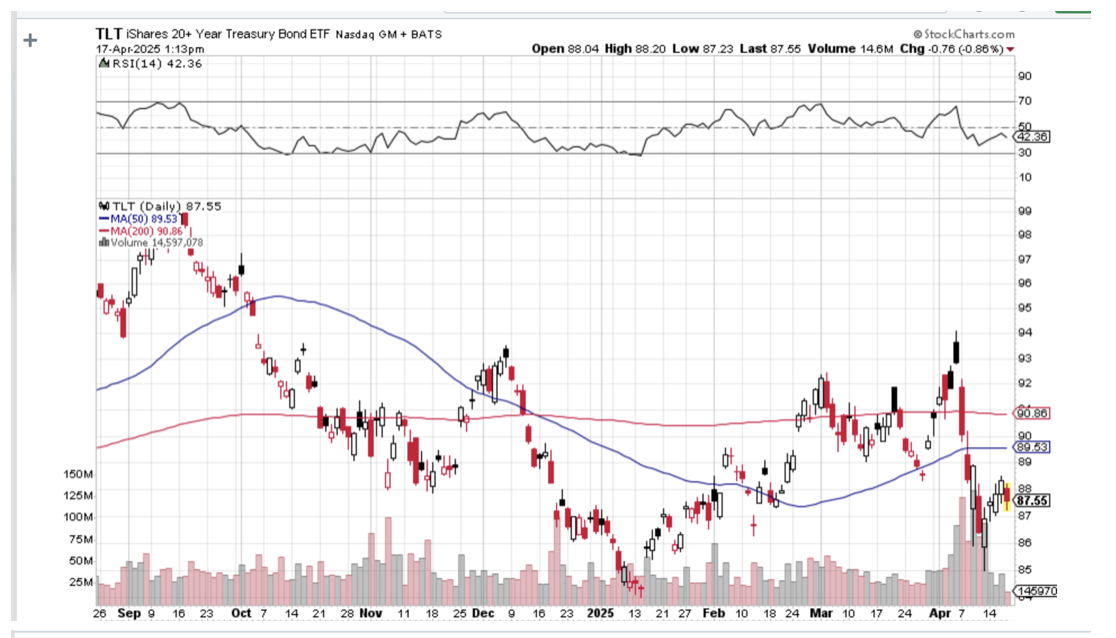
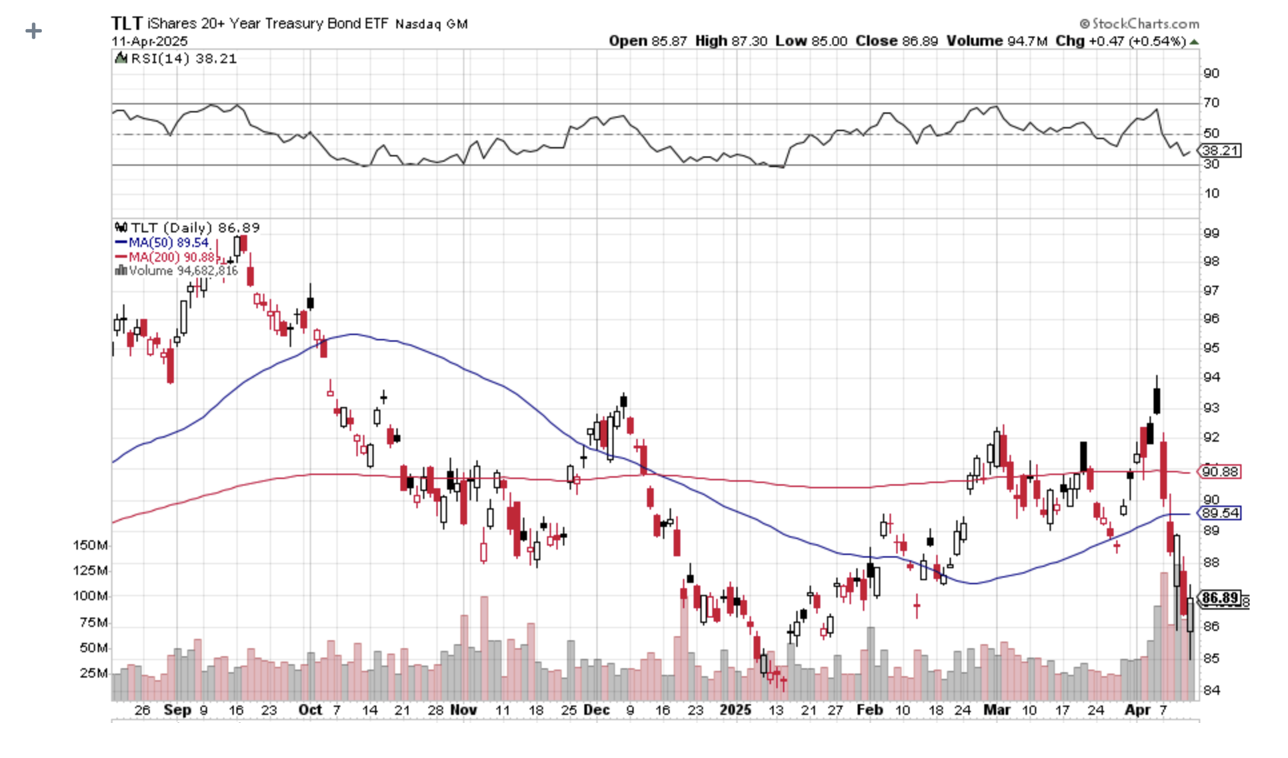
Right now, the bond market futures are the lead contract. When bonds rise and interest rates fall, it is a positive for equities. When bonds fall and rates rise, the “Sell America” trade is back on, leading to the dumping of all US assets. If you want to get a preview of each day’s US trading, stay up the night before and watch the action in the US bond futures in Singapore, as I often do.
Looking for More Market Insights
https://www.madhedgefundtrader.com/wp-content/uploads/2014/04/Girl-with-Chopsticks.jpg406273april@madhedgefundtrader.comhttps://madhedgefundtrader.com/wp-content/uploads/2019/05/cropped-mad-hedge-logo-transparent-192x192_f9578834168ba24df3eb53916a12c882.pngapril@madhedgefundtrader.com2025-04-23 09:04:202025-04-23 10:08:38Where’s This Market Bottom?
I feel obliged to reveal one corner of this time of great turmoil that might actually make sense.
By 2050, the population of California will soar from 40 million to 50 million, and that of the US from 340 million to 400 million, according to data released by the US Census Bureau and the CIA Factbook (check out the population pyramid below).
That means enormous demand for the low end of the housing market–apartments in multi-family dwellings. They will be joined by generational demand for limited rental housing by 65 million Gen Xer’s and 85 million Millennials enduring a lower standard of living than their parents and grandparents.
These people aren’t going to be living in cardboard boxes under freeway overpasses. The trend towards apartments also fits neatly with the downsizing needs of 80 million retiring Baby Boomers. So you have three different generations converging on a single sector of the real estate market. Prices here will hold up, and may even rise.
Rents are now rising at more than 5% a year in some of the more popular markets, and vacancies are dropping like a stone. Good luck finding an apartment in Silicon Valley. Fannie and Freddie financing is still abundantly available.
Institutions combing the landscape for low volatility cash flows and limited risk are now accounting for up to 30% of the low-end market. In some markets, it is now cheaper to buy than to rent, a 50-year reversal, if you can get the credit.
More a Rectangle Than a Pyramid
https://madhedgefundtrader.com/wp-content/uploads/2019/05/cropped-mad-hedge-logo-transparent-192x192_f9578834168ba24df3eb53916a12c882.png00april@madhedgefundtrader.comhttps://madhedgefundtrader.com/wp-content/uploads/2019/05/cropped-mad-hedge-logo-transparent-192x192_f9578834168ba24df3eb53916a12c882.pngapril@madhedgefundtrader.com2025-04-23 09:02:102025-04-23 10:08:28The One Safe Place in Real Estate
Back in 1977, I met Chinese Premier Deng Xiaoping for the first time at the Foreign Correspondents Club of Japan. He was a cherubic 4’10” and I was a lanky 6’4” and when we shook hands, he craned his neck and laughed. When he asked me my name, I answered “Shorty” and we laughed again.
I know for a fact that Deng had survived the 1934 Long March. That was when the forces of Chiang Kai-shek chased the communists 5,000 miles across China in an attempt to wipe them out. The communists blew up bridges to stay ahead, starved, and gave away children to peasant families because they couldn’t feed them. The communist forces shrank from 100,000 to only 8,000 before they reached the safety of distant Yunnan province.
The lesson here? The Chinese can be tough, really tough.
Like everyone else, we here at Mad Hedge Fund Trader have no idea what is going to happen in the markets moment to moment. With trade policy changing by the hour, markets are basically untradable. The goal here is preservation of capital until better days arrive, no matter how long that may take, even if it's four years.
However, I DO know what a 3,000-point move in the Dow Average looks like. For the time being, I will be selling 3,000-point rallies and buying 3,000-point dips until Mr. Market tells me otherwise.
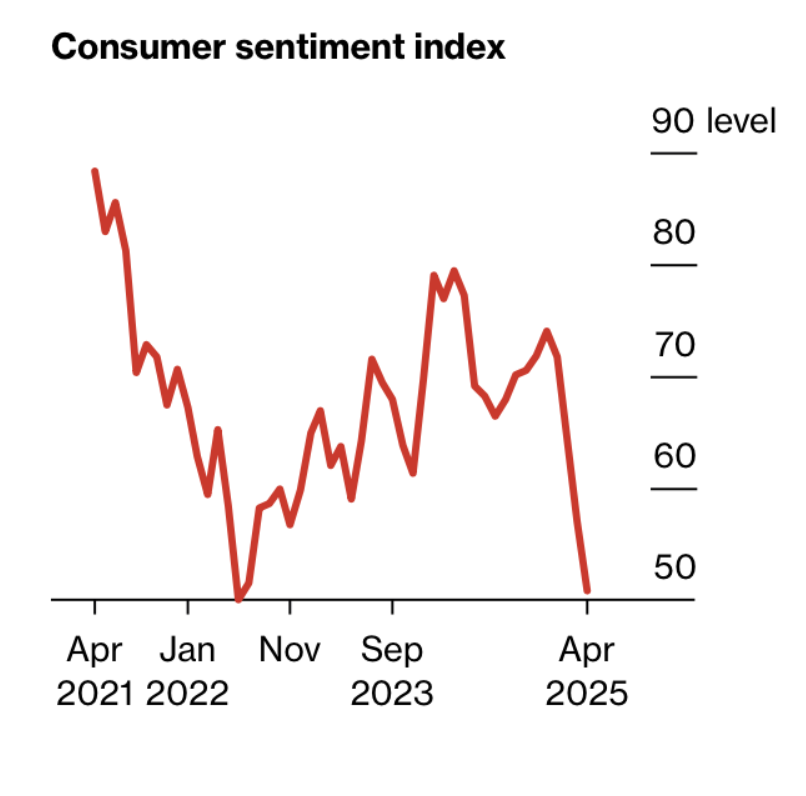
We have seen the biggest collapse in confidence in my lifetime, on par with the two oil shocks in the 1970s, the 1987 stock market crash, 9/11, the Great Recession, and the Pandemic. It’s not a great risk-taking environment.
As hard as it may be to believe, even after the carnage of the last two months, stocks are still historically expensive. The S&P 500 multiple is back up to 20X against a long-term average of 14X. In fact, earnings multiples are rising again because corporate earnings forecasts are being slashed.
At this point, the best-case scenario is that the government negotiates China tariffs down from 145% to only 50%. That still cuts 1% off of US GDP growth, which brings an automatic 4% corporate earnings growth.
Last year, the S&P 500 earned $240 a share, and analysts are chopping the 2025 forecast like an Alaskan lumberjack on steroids. Zero earnings growth this year at the current historically high multiple of 20X gets you a (SPX) of $4,800, where are lot of downside targets are bunching up right now. We almost got there on April 9.
But just as strategists like to competitively raise targets in bull markets, they also competitively lower them in bear markets. Zero earnings growth at an 18X multiple gets you to $4,320, and 16X gets you to $3,840. At 14X, $240 a share gets you to $3,360, where a lot of worst-case scenarios are congregating now.
If I started shouting a $3,360 target from the rooftops now, readers will assume that I‘ve become a permabear on the order of a Joe Granville, who in 1982 expected the S&P 500 Average to fall to 40.
And then what happens if earnings actually go negative this year? You can ratchet all these forecasts downward. What if China chooses not to negotiate, but waits out the trade war until a new president comes along, as most American companies are doing? Then we have four years of the Great Depression. In fact, these days, worst-case scenarios are a dime a dozen. While Republicans are swearing bullets over the mid-term elections in 18 months, the Chinese are as relaxed as ever. They don’t have elections, and if you disagree, you get shot.
The bottom line here is that the Chinese can take far more pain than we can.
The trade war is not the only thing dragging stock prices down right now. When most of the world is willing to buy unlimited amounts of your debt, a $37 trillion national debt is no problem. If they aren’t, it is a big problem. Suddenly, interest rates rise as government borrowing crowds out the private sector, as does the cost of debt service. The US Treasury has to refinance $9.2 trillion in maturing debt this year, as last week’s bond market crash may only be the opening chapter in THIS crisis.
If you’re not confused enough already, the Fed’s dual mandate is now diametrically opposed to each other. Inflation is going up, pushing it to raise interest rates. But there is no doubt that the economy is slowing and unemployment is rising, encouraging a cut. Let me know how this works out. As the Fed has always been a 100% backward-looking organization, the end of the year is the earliest the Fed can cut interest rates. Serious inflation hasn’t even started yet, and the Fed doesn’t anticipate things.
Speaking to several CEO’s this week, it’s clear that companies plan to spread out tariff-driven price increases over three years. Unfortunately for the Fed, that means prices will start rising now and continue indefinitely.
A collapsing economy, soaring interest rates, a trade war, inflation about to take off, and a crisis in confidence in the US do not argue for higher stock prices or multiples to me. If the US Treasury bill market is offering to pay you 4.3% to stay away, I would take it.
A concierge client asked me what would cause me to change my mind and turn 100% bullish. A declaration that all tariffs worldwide will be taken down to zero, ending the trade war. We may actually get several of these declarations, even if no real action is taken.
Once confidence is lost, it takes a really long time to get it back. Trump may have permanently broken America’s ability to borrow abroad.
As for me, I’m not holding my breath.
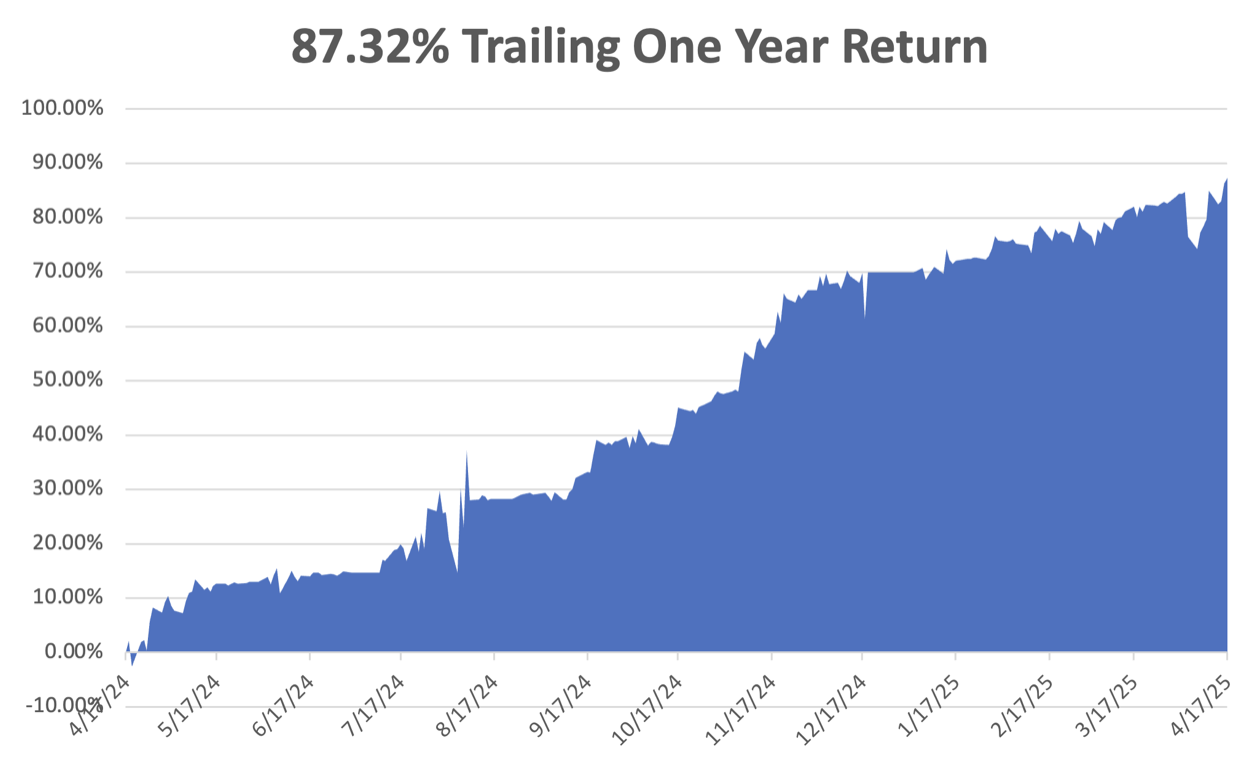
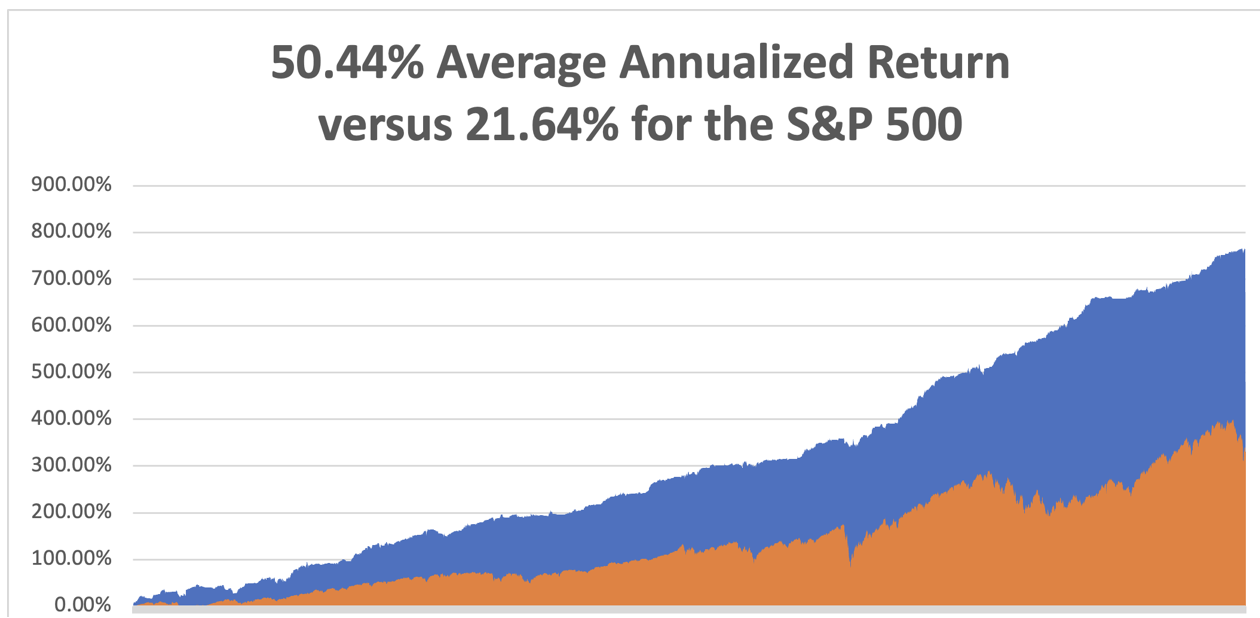
April is now up by +2.19% with our entire remaining portfolio expiring at max profit with the April 17 options expiration. That takes us to a year-to-date profit of +17.35%so far in 2025. My trailing one-year return stands at a spectacular +87.32%. That takes my average annualized return to +50.44%and my performance since inception to +769.24%, a new all-time high.
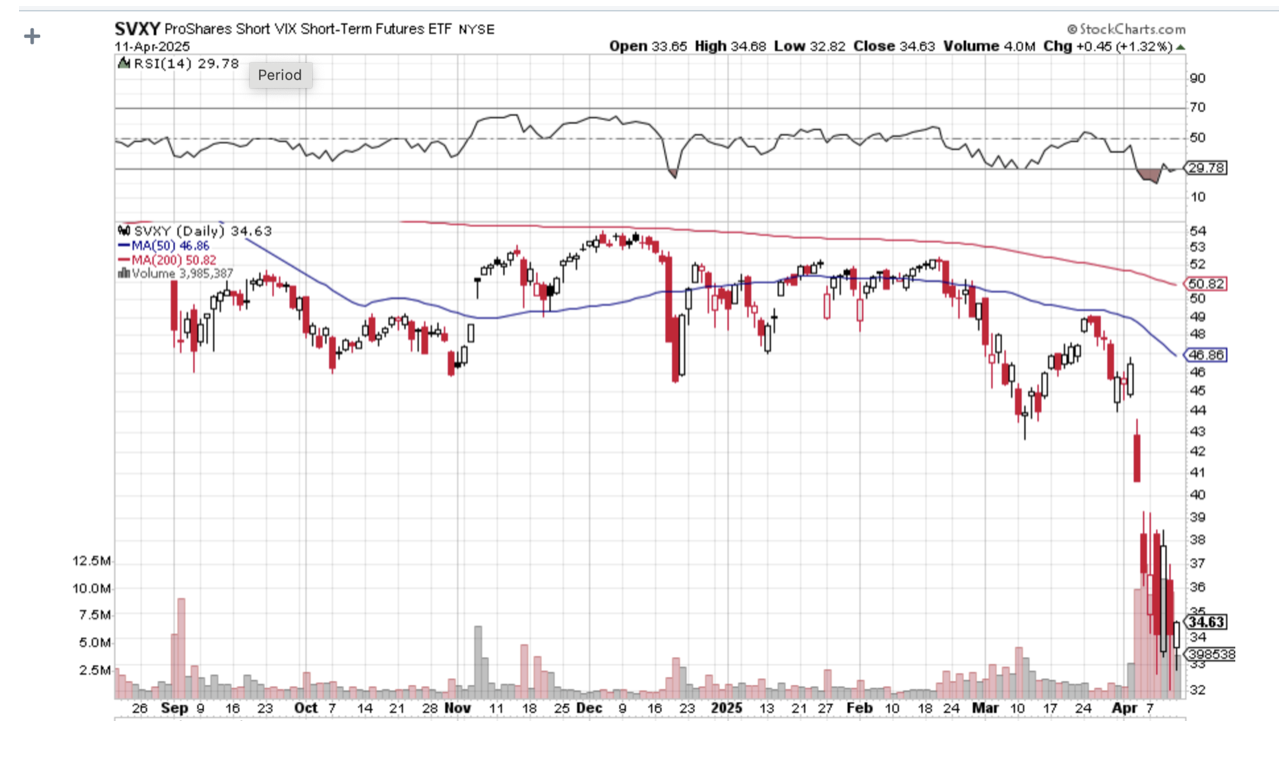
It has been another wild week in the market. I had the good fortune to have five options positions expire at Max profit in (NFLX), (COST), (NVDA), (TSLA), (MSTR). I added both longs and shorts in the leveraged long Bitcoin play (MSTR), betting that it will not rise or fall more than $100 in the next 19 days. I also use the collapse in the Volatility Index ($VIX) from $54 to $30 to take profits in the Proshares Short Vix Short Term Futures ETN (SVXY). Unusual times call for unusual trades.
Some 63 of my 70 round trips, or 90%, were profitable in 2023. Some 74 of 94 trades have been profitable in 2024, and several of those losses were really break-even. That is a success rate of +78.72%.
Try beating that anywhere.
Jay Powell Hints at No Rate Cuts This Year, due to the inflationary impact of the biggest tariff increases in history, sending markets crashing. Gold is through the roof. The Fed is also turning bearish on the economy.
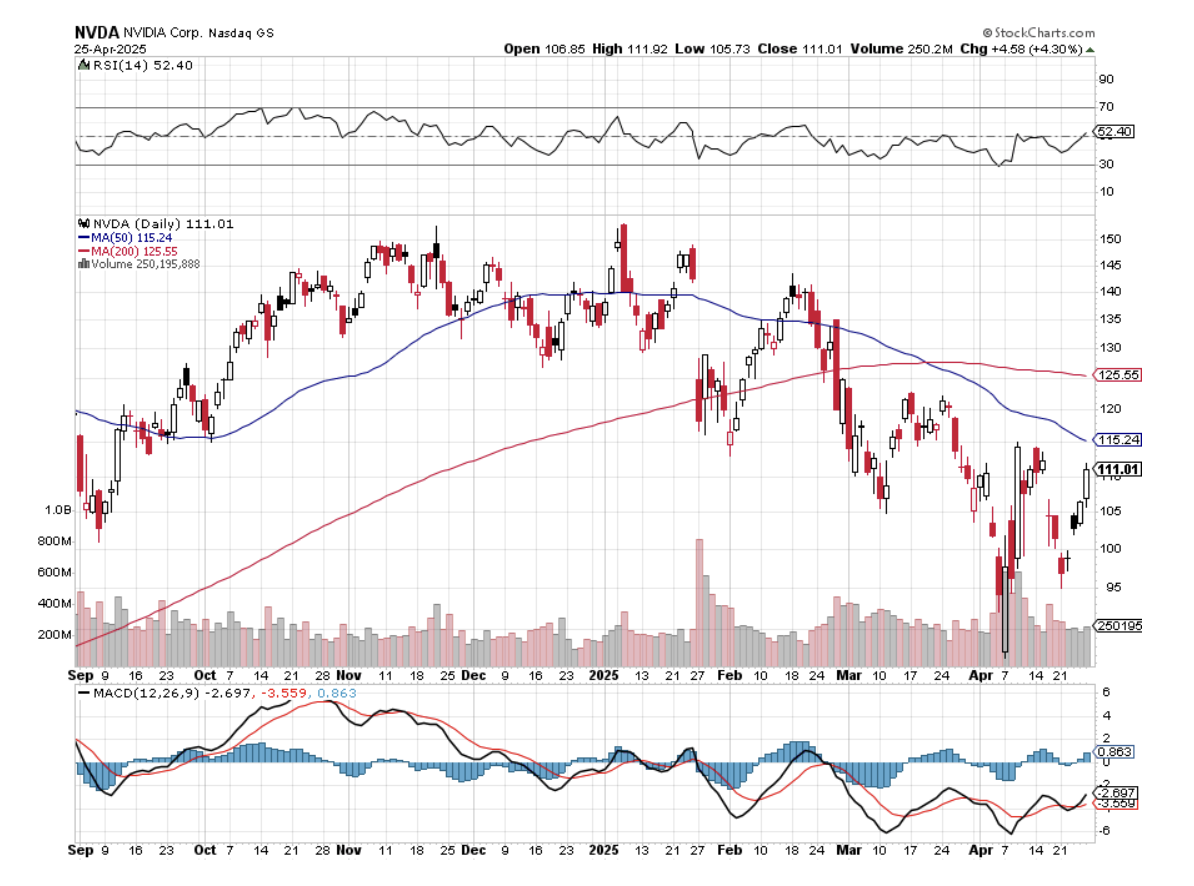
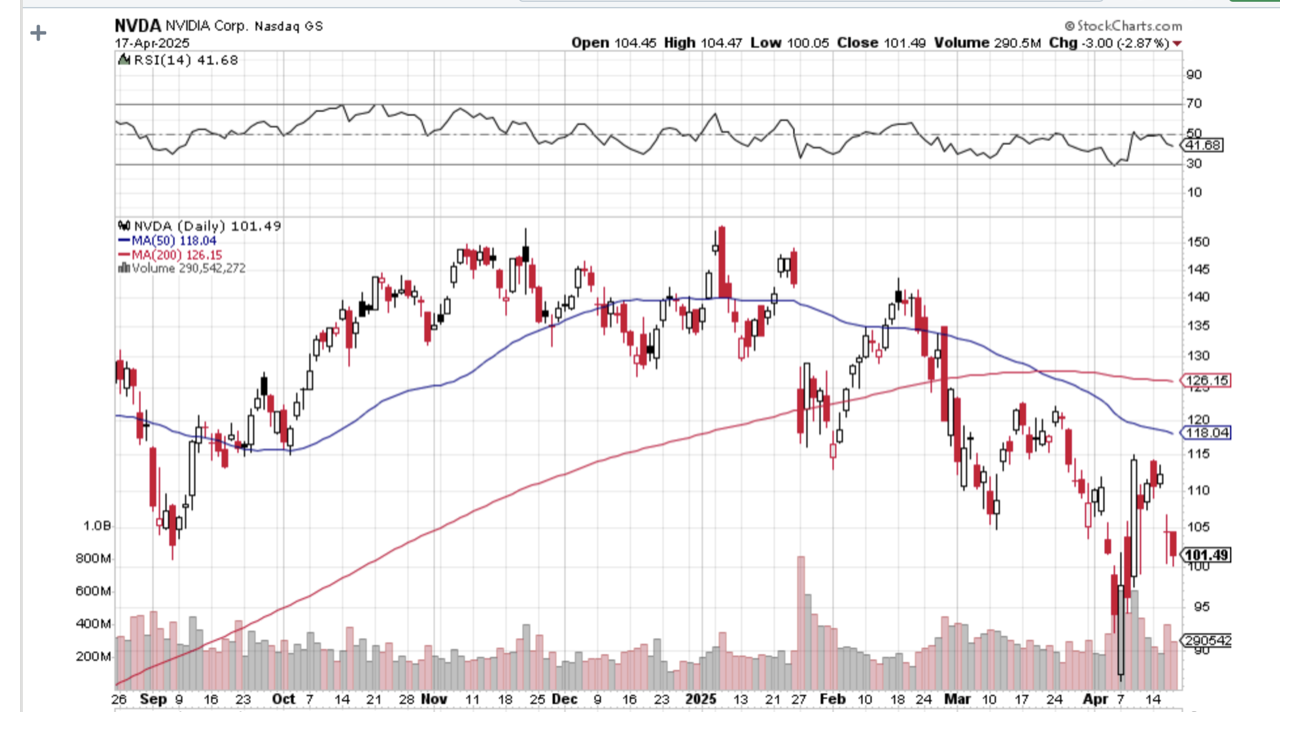
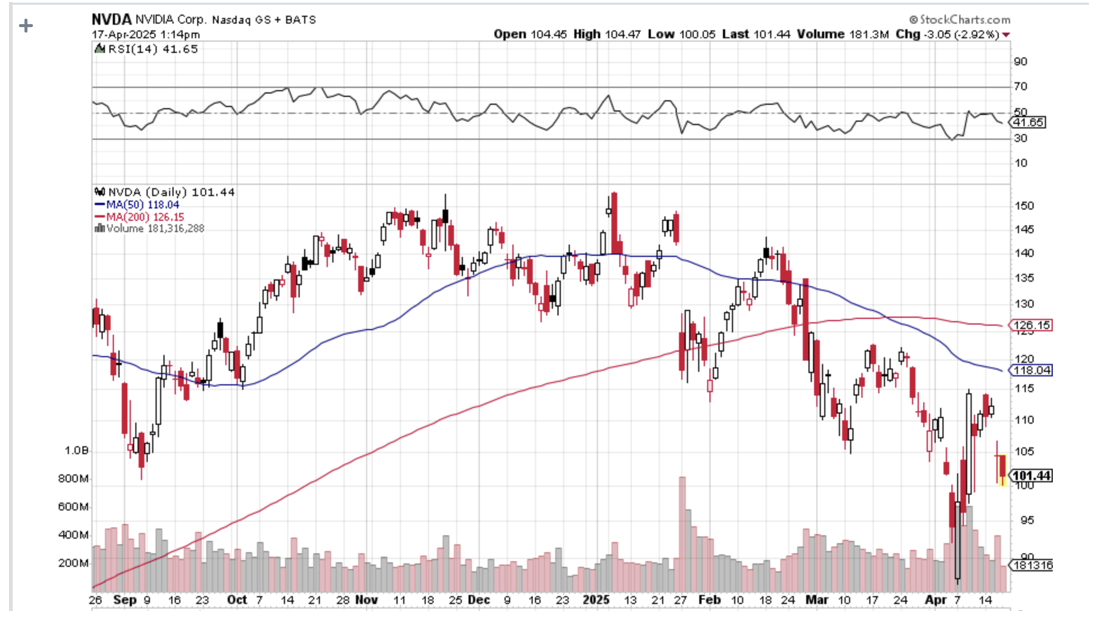
US Inflation Expectations Hits 44-Year High. Sharply rising interest rates are now a new factor pushing prices up, with the bond market suffering its worst week in 25 years. The University of Michigan on Friday showed that Inflation Expectations had soared to 6.7% in the wake of Trump's April 2 reciprocal tariffs announcement. Antitrust Case Proceeds Against Meta, with the FTC attempting to force the company to divest WhatsApp and Instagram. Other antitrust cases are proceeding against Alphabet (GOOGL) and Amazon (AMZN). Not only is Trump wrecking the US economy, but he is also dismantling the largest West Coast profit earners. Nvidia Suffers a Perfect Storm, with a ban on selling its no.2 chip in China, the H20, and a national security investigation by Congress. The shares suffered an 11% selloff. Semiconductors are definitely the chief whipping boy in this trade war. These H20 chips are dumbed down solely for export to China so they can be sold anywhere else.
China Imposes Rare Earth Ban for US, essential elements for all electronic manufacturing. The US has plenty of rare earths, but 90% of the processing is done in China. You can’t make semiconductors without rare earths.
Foreign Central Banks Selling US Treasury Bonds, and buying Treasury bills. Fewer dollars are needed to recycle smaller trade surpluses. It’s also a good time to de-risk. Taken together, that signals foreign governments could be pessimistic on the long-term prospects of the U.S. while trying to increase their access to cash in the near term. In February, foreign central banks unloaded a net $19.6 billion in longer-term U.S. bonds and notes. They sold $24.1 billion in January, 2025, and $42.3 billion in December, 2025. A little over a billion was sold in November 2025.
China Cancels Boeing Order, as part of the tit-for-tat trade war that’s seen Trump levy tariffs of as high as 145% on Chinese goods. Beijing has also requested that Chinese carriers halt any purchases of aircraft-related equipment and parts from US companies, the people said, asking not to be identified discussing matters that are private.
Morgan Stanley Marks Down (SPX) Earnings, from $270 to $257 per share. Citigroup said the Goldilocks sentiment in place entering this year has given way to abject uncertainty. Expect an avalanche of coming downgrades of US stocks.
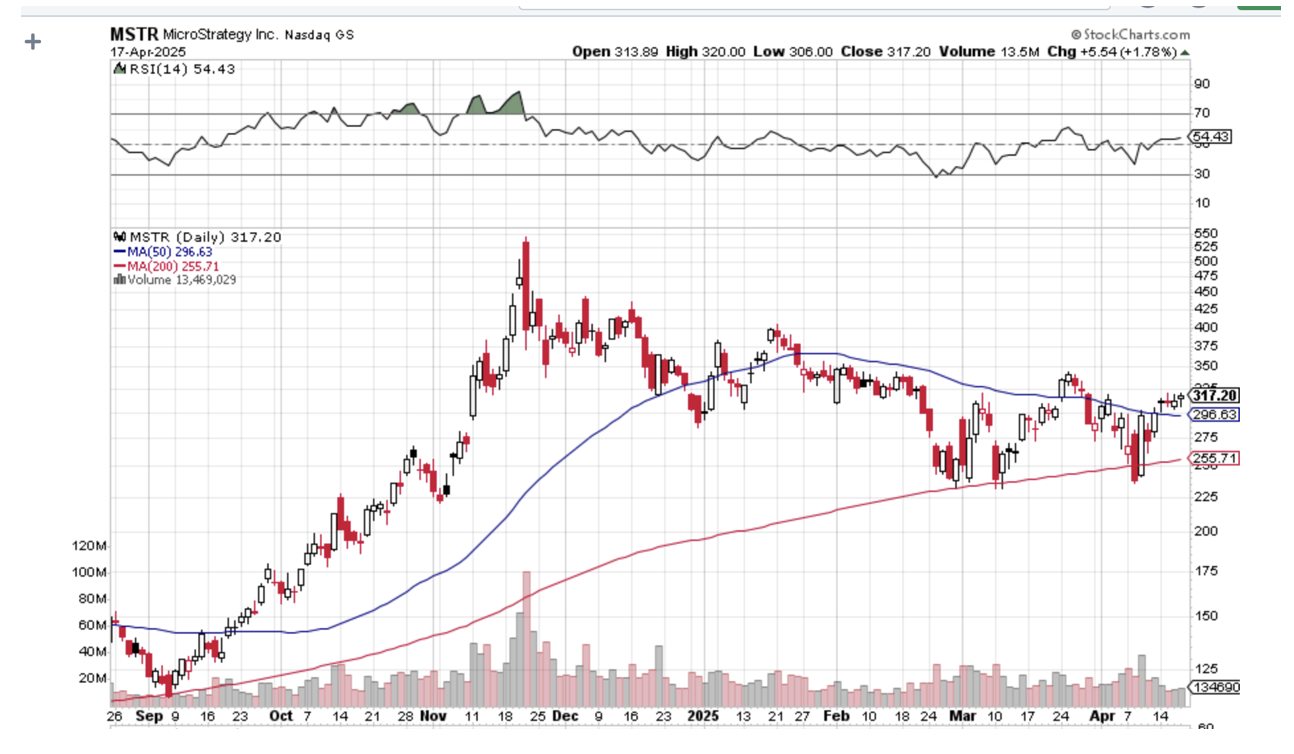
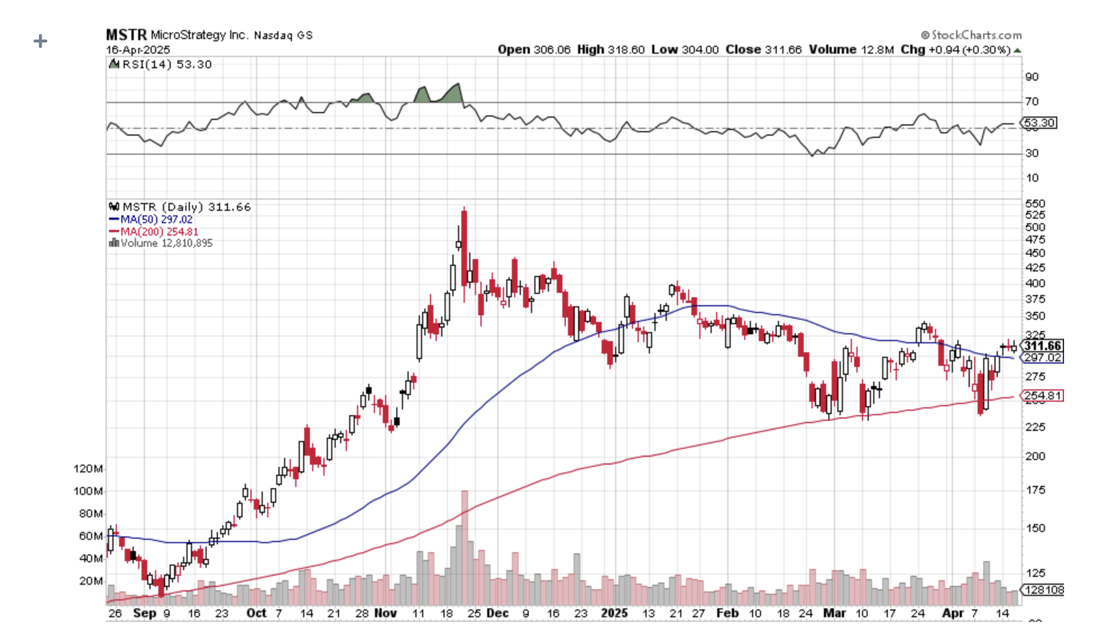
MicroStrategy Loads the Boat with Bitcoin. The company, which does business as Strategy, revealed in a Form 8-K that it had acquired 3,459 Bitcoins for roughly $285.8 million, or around $82,618 per Bitcoin, between April 7 and Monday, April 14. The latest purchase brought MicroStrategy’s total holdings to 531,664 units of the digital currency, with an aggregate purchase price of $35.92 billion. Sell (MSTR) rallies. This is not a RISK OFF” asset, which trades like a leveraged long tech stock.
Unemployment Fears Hit Five-Year High. Consumer worries grew over inflation, unemployment, and the stock market as the global trade war heated up in March, according to a New York Fed survey. The probability that the unemployment rate would be higher a year from now surged to 44%, up 4.6 percentage points, and the highest level going back to the early Covid pandemic days of April 2020. The expectation that the market will be higher a year from now slid to 33.8%, a decline of 3.2 percentage points to the lowest reading going back to June 2022.
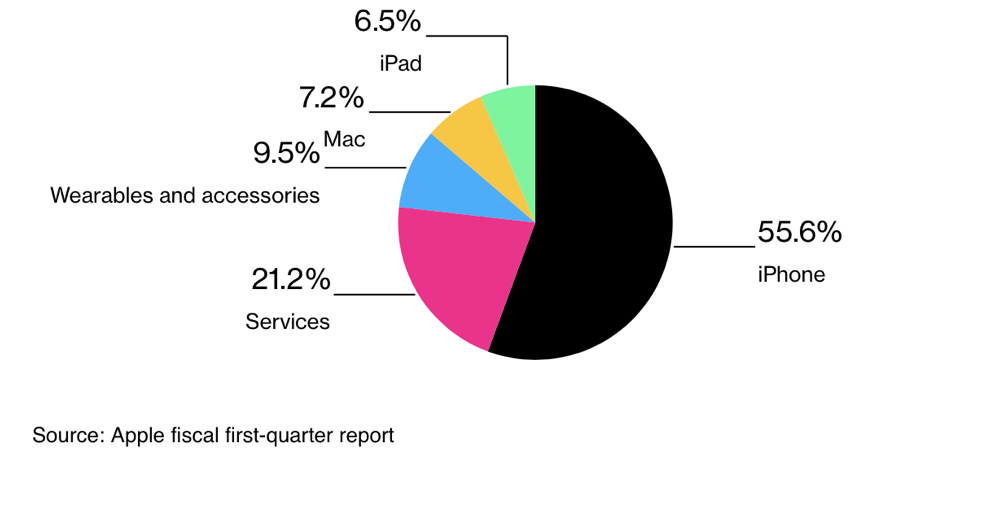
Apple Flew $2 Billion Worth of iPhones from India to beat the trump tariffs. (AAPL) It is probably the worst-affected company by the trade wars. Front-running tariffs have been going on throughout the economy.
US Temporarily Exempts Import Duties on Smart Phones and Chips, lifting a huge burden off Apple’s shoulders. The administration finally realized that moving iPhone production from China to the US is impossible. Like coffee beans, they can’t be grown here, except in Hawaii. Looks like Tim Cook’s million-dollar donation to Trump paid off. Buy Apple on dips.
My Ten-Year View – A Reassessment
We have to substantially downsize our expectations of equity returns in view of the election outcome. My new American Golden Age, or the next Roaring Twenties, is now looking at multiple gale-force headwinds. The economy will completely stop decarbonizing. Technology innovation will slow. Trade wars will exact a high price. Inflation will return. The Dow Average will rise by 600% to 240,000 or more in the coming decade. The new America will be far more efficient and profitable than the old. My Dow 240,000 target has been pushed back to 2035.
On Monday, April 21, at 8:30 AM EST, the Conference Board Leading Economic Indicators are announced.
On Tuesday, April 22, at 3:30 AM, the Crude Oil Stocks arereleased.
On Wednesday, April 23, at 1:00 PM, New Home Sales are published.
On Thursday, April 24, at 8:30 AM, the Weekly Jobless Claims are disclosed. We also get Existing Home Sales.
On Friday, April 25, at 8:30 AM, we get the University of Michigan Consumer Sentiment.
As for me, not a lot of people get a chance to board a WWII battleship these days. So when I got the chance, I jumped at it.
As part of my grand tour of the South Pacific for Continental Airlines in 1981, I stopped at the US missile test site at Kwajalein Atoll in the Marshall Islands, a mere 2,000 miles west southwest of Hawaii and just north of the equator.
Of course, TOP SECRET clearance was required, which I’ve had since I was 20, and no civilians were allowed.
No problem there, as clearance from my days at the Nuclear Test Site in Nevada was still valid. Still, the FBI visited my parents in California just to be sure that I hadn’t adopted any inconvenient ideologies in the intervening years.
I met with the admiral in charge to get an update on the current strategic state of the Pacific. China was nowhere back then, so there wasn’t much to talk about in the wake of the Vietnam War.
As our meeting wound down, the admiral asked me if I had been on a German battleship. “It’s a bit before my time,” I replied. “How would you like to board the Prinz Eugen he responded.
The Prinz Eugen was a heavy cruiser, otherwise known as a pocket battleship built by Nazi Germany. It launched in 1938 at 16,000 tons and with eight 8-inch guns. Its sister ship was the Admiral Graf Spee, which was scuttled in the famous Battle of the River Plate in South America in 1939.
Early in the war, it helped sink the British battleship HMSHood and damaged the HMSPrince of Wales. The Prinz Eugen spent much of the war holed up in a Norwegian fjord and later provided artillery support for the retreating German Army on the eastern front. At the end of the war, the ship was handed over to the US Navy as a war prize.
The US postwar atomic testing was just beginning, so the Prinz Eugen was towed through the Panama Canal to be used as a target. Some 200 ships were assembled, including those from Germany, Japan, Britain, and even some American ships deemed no longer seaworthy, like the USS Saratoga. One of the first hydrogen bombs was dropped in the middle of the fleet.
The Prinz Eugen was the only ship to remain afloat. In the Navy film of the explosion, you can see the Prinz Eugen jump 200 feet into the air and come down upright. The ship was then towed back to Kwajalein Atoll and put at anchor. A typhoon came later in 1946, capsizing and sinking it.
It was a bright and sunny day when I pulled up to the Prinz Eugen in a small boat with some Navy divers. There was no way the Navy was going to let me visit the ship alone.
The ship was upside-down, with the stern beached, the bow in 300 feet of pristine turquoise water. The propellers had recently been sent off to a war memorial in Germany. The ship’s eight cannons lay scattered on the bottom, falling out of their turrets when the ship tipped over.
The small part of the Prinz Eugen above water had already started to rust through. But once underwater, it was like entering a live aquarium.
A lot of coral, seaweed, starfish, and sea urchins can accumulate in 36 years, and every inch of the ship was covered. Brightly tropical fish swam in schools. A six-foot mako shark with a hungry look warily swam by.
My diver friends knew the ship well and showed me the highlights to a depth of 50 feet. The controls in the engine room were labeled in German Fraktur, the preferred prewar script. Broken dishes displayed the Nazi swastika. Anti-aircraft guns frozen in time pointed towards the bottom. No one had been allowed to remove anything from the ship since the war, and in the Navy, most men follow orders.
It was amazing what was still intact on a ship that had been blown up by a hydrogen bomb. You can’t beat “Made in Germany.” Our time on the ship was limited as the hull was still radioactive, and in any case, I was running low on oxygen.
A few years later, the Navy banned all diving on the Prinz Eugen. Three divers had gotten lost in the dark, tangled in cables, and drowned. I was one of the last to visit the historic ship.
I checked with my friends in the Navy, and the Prinz Eugen is still there, but in deteriorating condition. When the ship started leaking oil in 2018 and staining the immaculate beaches nearby, the Navy launched a major effort to drain what was left from the 80-year-old tanks. No doubt a future typhoon will claim what is left.
So if someone asks if you know anybody who’s been on a German battleship, you can say, “Yes,” you know me. And yes, my German is still pretty good these days.
Vielen dank!
Good Luck and Good Trading,
John Thomas
CEO & Publisher
The Diary of a Mad Hedge Fund Trader
The Prinz Eugen in 1940
On Pelelui Island
https://www.madhedgefundtrader.com/wp-content/uploads/2021/10/john-thomas-peleliu-island-1975.png434628april@madhedgefundtrader.comhttps://madhedgefundtrader.com/wp-content/uploads/2019/05/cropped-mad-hedge-logo-transparent-192x192_f9578834168ba24df3eb53916a12c882.pngapril@madhedgefundtrader.com2025-04-21 09:02:052025-04-21 15:34:25The Market Outlook for the Week Ahead, or In Search of the Lost Market Bottom
Learn from 24 of the best professionals in the market with decades of experience and the track records to prove it. They are offering a smorgasbord of successful trading strategies.
Every strategy and asset class will be covered, including stocks, bonds, foreign exchange, precious metals, commodities, energy, and real estate.
Get the tools to build an outstanding performance for your own portfolio. To view, click here.
https://www.madhedgefundtrader.com/wp-content/uploads/2025/03/march-2025-summit.png2321088april@madhedgefundtrader.comhttps://madhedgefundtrader.com/wp-content/uploads/2019/05/cropped-mad-hedge-logo-transparent-192x192_f9578834168ba24df3eb53916a12c882.pngapril@madhedgefundtrader.com2025-04-17 09:04:222025-04-17 14:22:04The Mad Hedge March Traders & Investors Summit Replays are Up!
Below, please find subscribers’ Q&A for the April 16 Mad Hedge Fund Trader Global Strategy Webinar, broadcast from Incline Village, NV.
Q:Is it time to get out of the (SH), which is the short S&P 500 LEAPS?
A: I would say no. We're still very deep in the money for the LEAPS I put out two months ago. I doubt we're going to new highs by August when that LEAPS expires, so I would hang on to it, especially if you have other longs on the stock market. But if you're nervous, you probably have at least a 50% profit in that anyway, so take the money and run.
Q: Could the S&P 500 trade down to 4,500?
A: Absolutely, yes. China is kind of in a good position. They can wait. They can wait a very long time until they get what they want. We can't. Trump needs China to fold immediately, or the trade with China will cause a never-ending recession in the US. Remember, we have elections here—in China, they don't. That puts them in a very strong negotiating position. That's why you're seeing basically all economic data roll over and point to a recession. Even if some settlement is negotiated, there still will be some tariffs left. They just won't be at 145%. You know, it’s not a great investment environment to bet your retirement savings on, and certainly not an environment to engage in very rapid short-term trading unless you have 50 years of experience like I do. That's why I'm up this month, and the rest of the world is getting absolutely crushed.
Q: Are you going to send more LEAPS?
A: LEAPS are something we do at market bottoms, not tops, because we have such enormous leverage in the LEAPS trade—they’re usually 10 - 1 to 100 - 1 leverage. At some point, there'll be a lot of fantastic LEAPS in technology stocks, but I don't think we've hit bottom yet. In fact, at best, they've mounted weak bounces over the last few days. So, the charts still look terrible—not a good time for LEAPS.
Q: When do you see the bottom?
A: I have no idea, nobody has any idea. It's like economic policy is changing hour by the hour. Best thing to do is nothing in that situation—and that's what most of the economy is doing. That's why the economy is shutting down. Nobody knows what the final picture will look like—the uncertainty is the greatest since the uncertainty of the pandemic, or 9/11 before that.
Q: Should I hide in a money market fund?
A: No, with the money market fund, you run credit risk with the issuer of that fund. With 90-day US Treasury bills, there's no risk, so you have a government guarantee to get all your money back on the maturity date. If your custodian goes bankrupt, you can always get the T-bills back. It may take you three years in custodian bankruptcy proceedings to get your money market fund back. That’s what we saw with MF Global in 2011.
Q: What is the end game of the China-US trade dispute? How does it affect the stock market?
A: Well, we can't see an end game. Basically, you have two counterparties who are stubborn as heck, and we could be stuck in no man's land for a very long time. You'd have to think eventually a settlement of some type comes. Is that worth a recession for the U.S? For most people, I doubt it. And what if China just wants to wait out Trump and wait for the tariffs to go away in four years? That is a possible outcome. Stock markets always discount the worst-case scenario first before they discount anything else. I think that's what we saw last week, when we broke 5,000 in the S&P 500.
Q: Are you optimistic about bank stocks now?
A: No. They will lead the downturn along with technology stocks. But when this all ends, they will also lead the upturn, and that's why you're seeing bank stocks have such hard bounces off their bottom. It's another one of two sectors that people will be first to rush into—banks and technology stocks. And while tech is expensive, banks are cheap.
Q: How can interest rates fall when government policies, interest rate policies, are causing them to spike?
A: Well, it's very simple: when foreign investors lose faith in the U.S. Government, they have, they pull their money out. They don't need to be here. It's a situation of, “Well, if you don't need us, we don't need you.” And foreigners own about 25% of all of the $36 trillion in national debt out there, or about $9 trillion. And in stocks they own here and the number goes up to $12 trillion. It doesn't take much selling to cause a panic in the bond market. That is what we have been seeing. Whether that continues, I have no idea—it depends on the next tweet coming out of Washington.
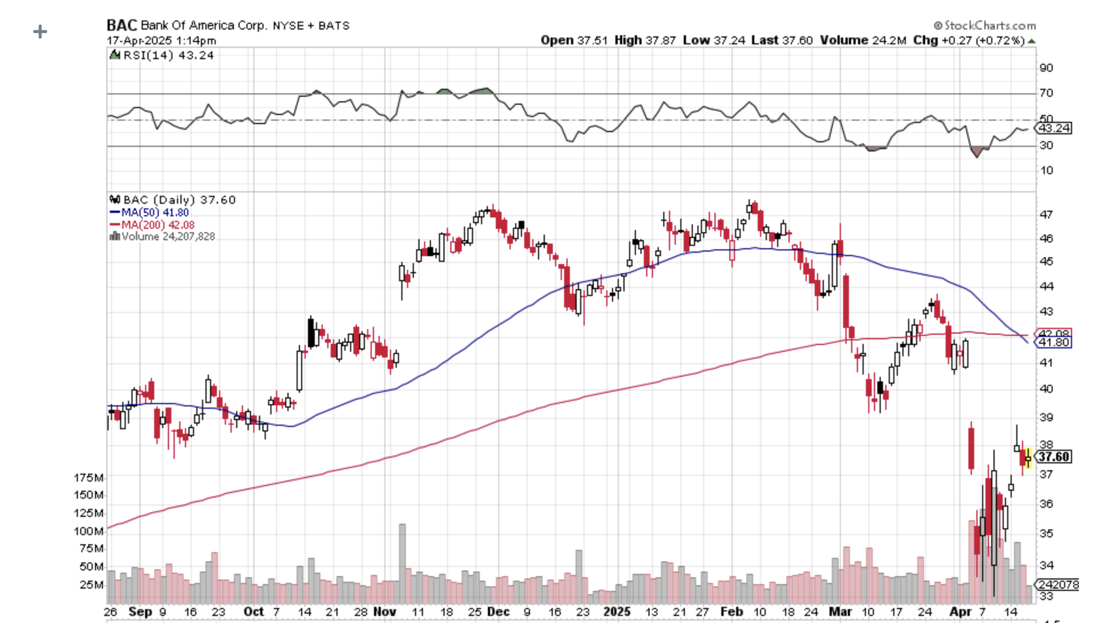
Q: What about Bank of America (BAC)?
A: Yeah, it will also bounce the hardest off the bottom—great buy, and these things are all cheap relative to technology stocks. You know, banks still have PE multiples in the low teens. Tech stocks are all the way down to the low 20s from the 30s and 40s, so they're roughly trading at double the multiples of bank stocks. That's one reason people are rushing back into these.
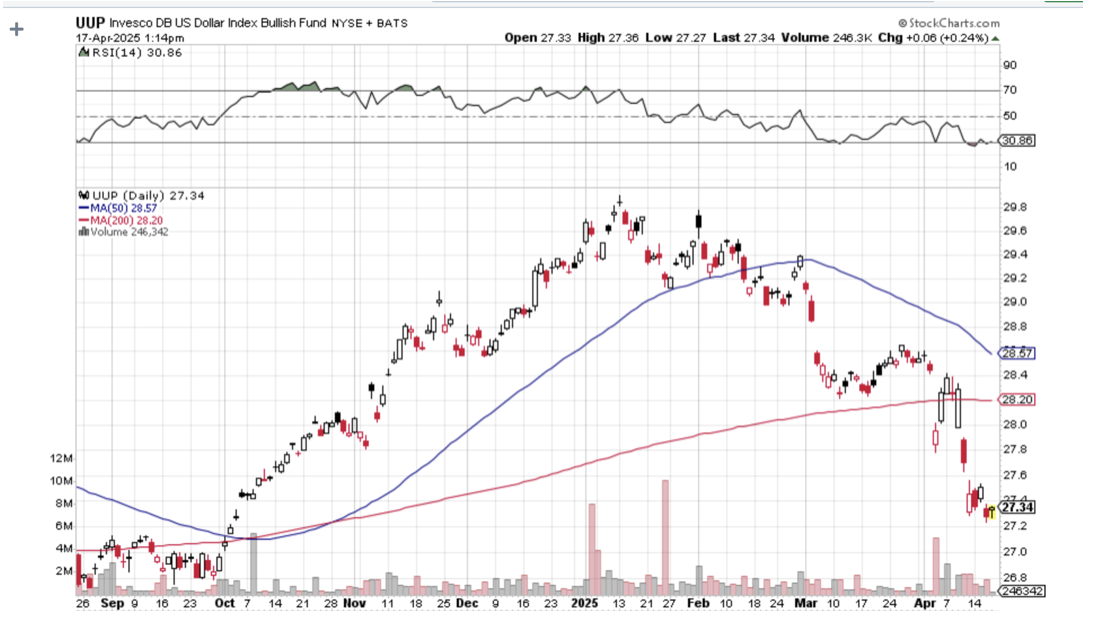
Q: What's the basis of your prediction on a falling US dollar?
A: Again, it's foreign selling. I don't think I've ever seen a falling dollar and rising interest rates in 60 years of watching. It goes against all economic fundamentals in the currency markets. But when there's a panic, there's a panic. People want out of everything at any price, and that's what's happening now. As long as foreigners are dumping our assets, the dollar will keep going down—dumping our assets means dollar selling after 80 years of dollar buying.
Q: Is gold the only safe haven?
A: Yes. We'll get into this in the gold section, but even gold went down for three days, and then wiser heads prevailed and it actually triggered a panic melt-up in gold assets. The miners were up 25% in days. That is another great weak-dollar play.
Q: How do you protect the US from a dollar fall?
A: Change our economic policies; end the trade war.
Q: Is it a good time to buy a house?
A: No, it is not, unless you can wait out the current downturn. High interest rate mortgage rates shot up from 6.5% to 7.1% in a week, and that basically kills off the housing market for the foreseeable future. And of course, when people are worried about their futures, their savings, and their assets, the last thing they do is go out and buy a house.
Q: Is there enough negative sentiment around now for us to go back into the bond market?
A: No. There is no precedent for the type of market action that's going on now. Will the U.S. government suddenly become reasonable? I doubt it. You can expect tweet bombs to happen at any time. So, people are just hoarding cash and avoiding risk at all costs. It used to be that bonds were the safe place to go. No longer. Not with 10% moves down in a week like we saw last week. Sorry—T-Bills are the only actual safe play out there, and their yield is the same as Treasury bonds without the risk.
Q: Will crypto keep going down?
A: If we continue with a risk-off market, I think you can expect crypto to keep falling. Crypto fell 30% from its top—at least Bitcoin did. It's basically matching the downside with tech stocks one for one, so no protection in crypto, no diversification. The protection aspect that was promised by crypto promoters lever shows. No flight to safety is happening there whatsoever. And that's why I'm looking to add to my short in MicroStrategy Inc. (MSTR)—they're a leveraged long Bitcoin play.
Q: Is the U.S. economy set for a hard landing?
A: I think absolutely, yes, the hard landing is in progress. That's what all of the economic data says. It's hard to find any positive news coming out of the economy—people are running for their lives, essentially.
Q: Do you expect inflation to return and take stocks lower?
A: Absolutely, yes. The highest tariffs in history start hitting retail prices in the next month or two, and the price increases should be dramatic, especially on anything from China. So yeah, we should see that come out in the data in the next few months.
Q: Do you expect silver to follow gold?
A: Yes, I do, but it hasn't been performing as well because there is a recession drag on silver, which you don't have for gold. Silver (SLV), (AGQ) are used in a lot of electronics and solar panels.
Q: When do you get back into gold (GLD)?
A: Whenever we get a dip. So far, any dips have been very brief and short-term. It's kind of reminiscent of the 1970s when gold moved from $32 an ounce to $900. That’s when you found me in a line in Johannesburg, South Africa, waiting to sell all my Krugerrands.
Q: Which countries will benefit from manufacturing moving out of China?
A: The answer is really no countries. As soon as manufacturing moves from China to another one like Vietnam, the US then puts punitive tariffs on that second country. So, there's no place to hide. It's really a war against the world. That's the message that the administration is putting out: if you don't want to build a factory here, we don't want to do business with you. We don't want your products. And most companies will do nothing. They'll wait this out, wait for a future president to eliminate all tariffs. Until then, international trade grinds to a halt. No trade makes sense at 145% tariff. Just to give you some idea on how much that is, if you buy a top end MacBook Pro for $8,000, and you pay the full 145% tariff, that is an $11,600 tariff if you have to pay it, which brings the total cost of a MacBook Pro to nearly $19,600. How many are you going to buy at that price?
Q: Do you think the Fed will cut interest rates?
A: No, we haven't seen the inflation data yet. They are backward-looking, and only after we see a sharp rise in prices will they raise rates. Chances of them cutting now are zero with all the risks in inflation to the upside right now and unemployment still under control. So, no interest rate cuts this year.
To watch a replay of this webinar with all the charts, bells, whistles, and classic rock music, just log in to www.madhedgefundtrader.com, go to MY ACCOUNT, click on GLOBAL TRADING DISPATCH, then WEBINARS, and all the webinars from the last 12 years are there in all their glory.
Good Luck and Good Trading
John Thomas
CEO & Publisher
The Diary of a Mad Hedge Fund Trader
Followers of the Mad Hedge Fund Trader alert service have the good fortune to own FIVEin-the-money options positions that expire on Thursday, April 17, and I just want to explain to the newbies how to best maximize their profits.
These involve the:
Risk On
(COST) 4/$840-$850 call spread 10.00%
(TSLA) 4/$160/$170 put spread 10.00%
(NFLX) 4/$800-$810 call spread 10.00%
(NVDA) 4/$70-$75 call spread 10.00%
Risk Off
(MSTR) 4/$340-$350 put spread -10.00%
Provided that we don’t have a monster move in the market in three trading days, these positions should expire at their maximum profit points.
So far, so good.
I’ll take the example of the (NVDA) 4/$70-$75 call spread.
Your profit can be calculated as follows:
Profit: $5.00 expiration value - $4.50 cost = $0.50 net profit
(25 contracts X 100 contracts per option X $0.50 profit per option)
= $1,250 or 11.11% in 9 trading days.
Many of you have already emailed me asking what to do with these winning positions.
The answer is very simple. You take your left hand, grab your right wrist, pull it behind your neck, and pat yourself on the back for a job well done.
You don’t have to do anything.
Your broker (are they still called that?) will automatically use your long position to cover your short position, canceling out the total holdings.
The entire profit will be credited to your account on Monday morning, April 21, and the margin freed up.
Some firms charge you a modest $10 or $15 fee for performing this service.
If you don’t see the cash show up in your account on Monday, get on the blower immediately and find it.
Although the expiration process is now supposed to be fully automated, occasionally, machines do make mistakes. Better to sort out any confusion before losses ensue.
If you want to wimp out and close the position before the expiration, it may be expensive to do so. You can probably unload those pennies below their maximum expiration value.
Keep in mind that the liquidity in the options market understandably disappears and the spreads substantially widen when a security has only hours or minutes until expiration on Thursday. So, if you plan to exit, do so well before the final expiration at the Thursday market close.
This is known in the trade as the “expiration risk.”
One way or the other, I’m sure you’ll do OK, as long as I am looking over your shoulder, as I will always. Think of me as your trading guardian angel.
I am going to hang back and wait for good entry points before jumping back in. It’s all about keeping that “Buy low, sell high” thing going.
I’m looking to cherry-pick my new positions going into the next quarter's end.
Take your winnings and go out and buy yourself a well-earned dinner.
Well done, and on to the next trade.
You Can’t Do Enough Research
https://www.madhedgefundtrader.com/wp-content/uploads/2019/09/john-and-girls.png322345april@madhedgefundtrader.comhttps://madhedgefundtrader.com/wp-content/uploads/2019/05/cropped-mad-hedge-logo-transparent-192x192_f9578834168ba24df3eb53916a12c882.pngapril@madhedgefundtrader.com2025-04-15 09:02:192025-04-15 10:02:38How to Handle the Thursday, April 17 Options Expiration
Back in 1987, I flew my Cessna 340 twin from London to Rome to visit Morgan Stanley’s high-end Italian clients. Held over by meetings, I got a late start, and I didn’t get as far as the French Champagne country until midnight. Right then, at 20,000 feet, the gyroscope suddenly blew up with a great resounding “thwacking sound.”
I instantly lost all instruments and lights, but still had a radio. I commenced a very wide spiral dive in the pitch-black darkness. Paris control started yelling at me because I was deviating from my approved flight plan. I started to pass out from vertigo.
Then I did what all Marines and Eagle Scouts are taught to do in this situation.
I improvised.
I pulled a flashlight and canteen out of my cockpit side pocket. By steering to the water level, I was able to use it as an artificial horizon level and straighten out the plane. Then I used the Girl Scout compass I always kept around my neck and plotted a rough course to Paris. Then I got on the radio.
“Mayday, Mayday, Mayday, N3919G complete instruments failure, request emergency landing at nearest airfield.” The air went dead for 30 seconds.
Then I heard “N3919G, cleared for approach Charles de Gaulle, steer 240 degrees and change over to 118.15.” As I made my final approach, the Eiffel Tower sparkled off my starboard wingtip. I could see the entire Charles de Gaulle fire department (Sapeurs Pompiers in French), blinking their blue lights. When I hit the runway, they chased me all the way until I stopped.
Then a captain elaborately dressed in firefighting gear stepped out of his fire engine cabin and asked, “Are you alright?”
The experience reminds me of the government’s current economic policies. They are attempting to rebuild the engines of a plane while flying at 20,000 feet in the dark with no tools or instruments. Except there are 340 million passengers this time, not just one.
Will we pull out of the dive before we crash?
Back in January and February, my biggest concern about the markets was complacency. It is safe to say now that this concern has completely vanished, not just by me but everyone.
I have been looking for parallels to the current crisis, and there are few to choose from. Stocks, bonds, oil, commodities, and the US dollar are all crashing at the same time. S&P 500 multiples (SPY) have been marked down from 22X to 18X in a mere two months, and 16X or 14X beckon. The NASDAQ multiple has collapsed from 31 to 21. Small caps (IWM) were hit the hardest, falling to 2016 levels.
It was the action in the bond market that was most concerning, which was hit by massive waves of selling from both foreign investors and hedge funds facing margin calls. Liquidity has disappeared and the Treasury was ill-equipped to deal with this because DOGE just fired 10,000 of their people.
Most don’t realize that US bonds are the lifeblood of the global financial market. When they drop 10% in a week, as they just did, ripples become tidal waves. Suddenly, banks are undercapitalized, central banks and companies have to mark down reserves, and margin calls run rampant.
A national debt of $36 trillion, which was happily ignored for 25 years, instantly becomes a crisis. Is US debt headed for junk status? Will Trump impose capital controls to stem the outflows? You might call these questions fanciful or born of conspiracy theories, but I was woken up every morning last week from European banks asking exactly this. When they start asking in the debt markets, you have a problem.
All earnings reports coming out now can be torn up and thrown out the window. That’s because they reflect profits from an ancient economy in the distant past that no longer exists, like January-March 2025.
Back then, it was about a growing globalized economy spinning off ever-increasing profits and higher multiples and share prices. Now it’s about a shrinking global economy at war with itself, declining profits everywhere justifying lower multiples and share prices.
Last year, S&P 500 earnings came in at $240. Two months ago, the consensus forecast for 2025 was $270. Now it’s moving towards $230.
The average price earnings multiple is now back up to 20X. The 120-year average is 14X. American exceptionalism picked up another 8 multiple points after WWII. If we give all that back and the multiple returns to 14X that gets the (SPX) down to $3,220, or off 47.5% from the February high.
Confidence levels are collapsing at 50-year lows. We’re rearranging the deckchairs on the Titanic while we’re headed straight for a giant iceberg, and it's dark and darn cold outside. We are not getting a reversion to the mean in stock markets; we are getting a reversion far beyond the mean. Markets won’t bottom until all the worst-case scenarios out there are fully discounted.
The shock to the global financial system is of the same magnitude as when Nixon took the US off the gold standard in 1972. That’s why gold is rocketing now as then. The US dollar then lost half its value.
This is the first bear market created by government policies since 1930, back when the Smoot-Hawley Tariff Act started the last major trade war. When the current policies end, the bear market will end and not before then. We are now within days, if not hours, to the complete collapse of the global financial system. The global economic pie is rapidly shrinking, and everyone is fighting over the scraps that are left.
Trillions of dollars of capital from corporate America have been stranded abroad in the wrong countries because Trump convinced them to move there eight years ago, like Vietnam. Millions of small businesses unable to eat the tariffs or pass them on to consumers will go out of business.
With no policy changes from Washington expected any time soon, it’s likely that we will eventually exhaust selling and enter an “L” shaped bottom. That has stocks bottoming out and then moving sideways in a range for a long time. You can forget about any immediate sharp “V” type recovery that takes us back to the all-time highs we saw in February.
So you should use any rally in the stock market to sell short calls against the long equity positions you want to keep. If you want to be more proactive than that, I have some clever ideas for you.
We now know that Trump is willing to resort to gaming the market by talking it up whenever the S&P 500 hits 5,000. That’s because he is taking immense heat from Americans who have lost 20%-30% of their retirement funds in two months.
You can use the next plunge to 5,000 in the (SPX) to buy the best quality technology names like (AMZN), (AAPL), (GOOGL), (PANW), and (NFLX), which likely won’t go to new lows on the next crash and will rocket on any trade war success.
There are other fish to fry.
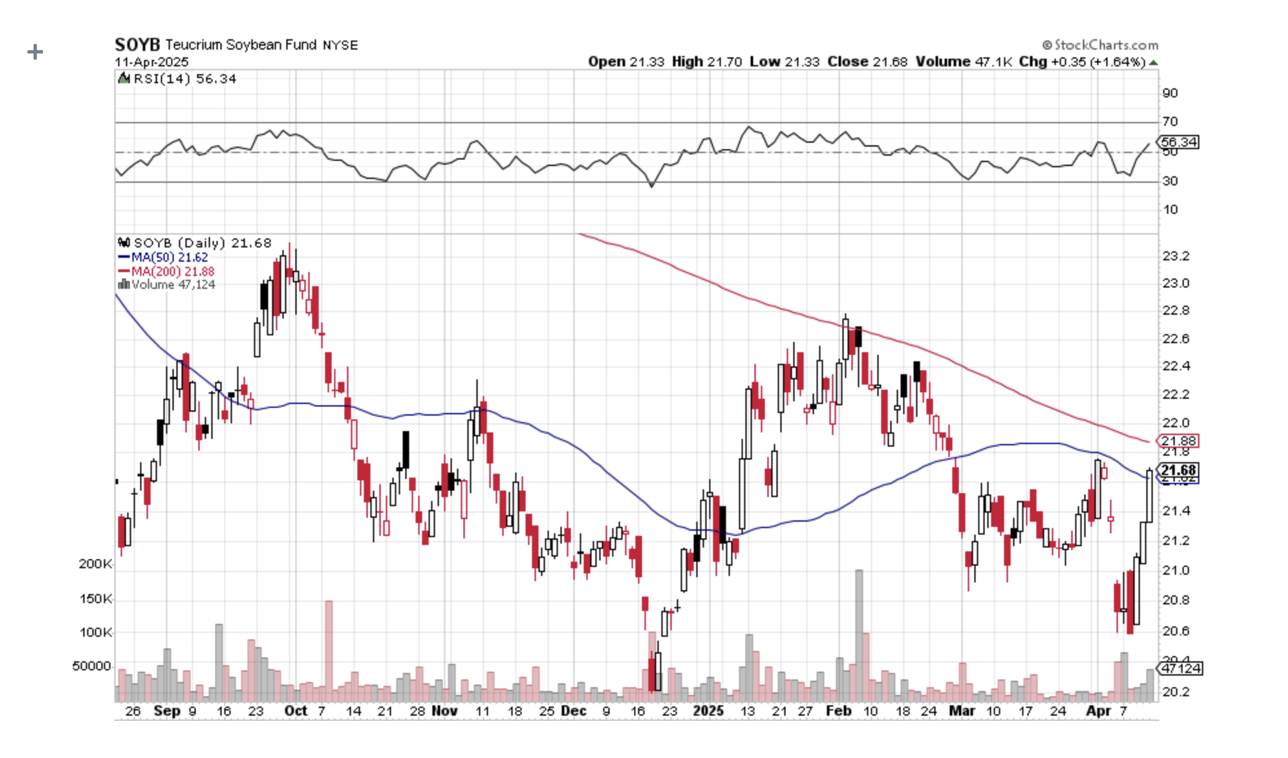
Let’s say that a tweet hits that the trade war is progressing or is about to end. What are China’s biggest US imports? Corn (CORN), wheat (WEAT), or soybeans (SOYB), which all have actively traded ETFs just above four-year lows. They will take off like a scalded cat on any good news.
The next time the Volatility Index ($VIX) takes a run at $60, buy the Proshares Short Vix Short Term Futures ETN (SVXY), an exchange-traded fund that sells short futures in the ($VIX). You can buy shares in it like any ETF. There is no expiration date. It hit a low of $32.90 on Thursday, but traded as high as $40 the week before, and $50 in December.
By the way, icebergs don’t enter the Atlantic shipping lanes anymore. Global warming has melted them before they do. The few that do drift south are tagged with transmitters that show up on ship radars. So if you’re planning a trip to Europe this summer on the Queen Mary II, you don’t need to worry about suffering the fate of Leonardo DiCaprio.
The Financial Crisis Trade is Still On, with 10-year US Treasury bonds hitting 4.6% yields, the US dollar plunging to 3-year lows, and gold at an all-time high. Foreign investors are abandoning the US at an unprecedented pace. It turns out that confidence in the US was worth a lot more than we thought. You don’t know what you have until you lose it.
Trump Cracks, Caves, and Does a U-Turn, announcing a 90-day delay in trade tariffs forced by the imminent collapse of global financial markets. The 10% tariffs remain. Inflation is still on track to skyrocket. A Fed interest rate cut is now on the table for June to head off a recession. What is the long-term trend now? It’s anyone’s guess. But Christmas shopping is certainly going to be a lot more expensive this year.
China Imposes 125% Retaliatory Tariffs, and Europe is yet to come. China’s biggest US imports are all agricultural, and many commodities hit multi-year lows on Friday, delivering a knockout blow to US farmers just as the planting season begins. Shiploads of American grain may be left to rot in the ports as Chinese importers refuse delivery due to the dramatic price increase. Also announced were antitrust investigations of US tech companies and export restrictions on rare earths needed for tech products. It’s 1930 all over again.
Chinese Tariffs Raised to 145%, in a US retaliation to the retaliation. Markets tanked again. Most of the goods and parts cannot be obtained elsewhere. Recession fears are now going mainstream, it’s not just me.
Unemployment rises to 4.2%, a multi-year high, says the March Nonfarm Payroll Report. Nonfarm payrolls in March increased to 228,000 for the month, up from the revised 117,000 in February. Health care was the leading growth area, consistent with prior months. The industry added 54,000 jobs, almost exactly in line with its 12-month average.
Federal Reserve’s Powell Says Inflation to Rise, as a result of the larger-than-expected tariffs. But don’t expect any interest rate cuts until yearend when the Fed has the benefit of 20/20 hindsight on inflation.
Volatility Hits 16-Year High at 60, in overnight Asia trading. The ($VIX) peaked at 95 during the Financial Crisis in 2009. ($VIX) may not have peaked yet.
Oil Crashes, down an amazing $13, or 18% in a week, from $72 to $59. High dividend-paying (XOM) has collapsed by 18%. It is the sharpest fall in Texas tea prices since the 1991 Gulf War. Recession fears are running rampant, and no one wants to pay for storage until a recovery, which may be years off. Sell all energy rallies.
JP Morgan Raises Recession Risk to 79%, while credit investors remain sanguine even as funding stress threatens to build. The small-cap focused Russell 2000, which has been battered in the recent selloff, is now pricing in a 79% chance of an economic downturn, according to JPMorgan’s dashboard of market-based recession indicators. Other asset classes are also sounding alarms.
Q1 Gold Inflows Hit Three-Year High, according to the World Gold Council. Gold ETFs saw an inflow of 226.5 metric tonnes worth $21.1 billion in the first quarter, the largest amount since the first quarter of 2022, when global markets were grappling with the immediate consequences of Russia's invasion of Ukraine. This raised their total holdings by 3% to 3,445.3 tonnes by the end of March, the largest since May 2023. Their record was 3,915 tonnes in October 2020.
Canadian Visitors Fall 32%, in line with other forecasts of a collapse in international travel. That is why Delta Air Lines (DAL) crashed by 50% in three months. Conditions will get worse before they can get better. A weak dollar has caused the price of my Europe trip this summer to rise by 20%.
Consumer Confidence is in Free Fall. Friday brought a fresh signal that consumers were queasy even before Wednesday’s policy shift. US consumer sentiment tumbled to the second-lowest level on record in a University of Michigan survey, as inflation expectations soared to multi-decades highs. That result was based on interviews from March 25 through April 8, before the change in tack on tariffs.
Delta Pulls Guidance, citing the trade war’s impact on sales. The stock is down 50% in three months. No guidance from any company is possible or credible, as Q1 earnings took place in an ancient, more business-friendly world.
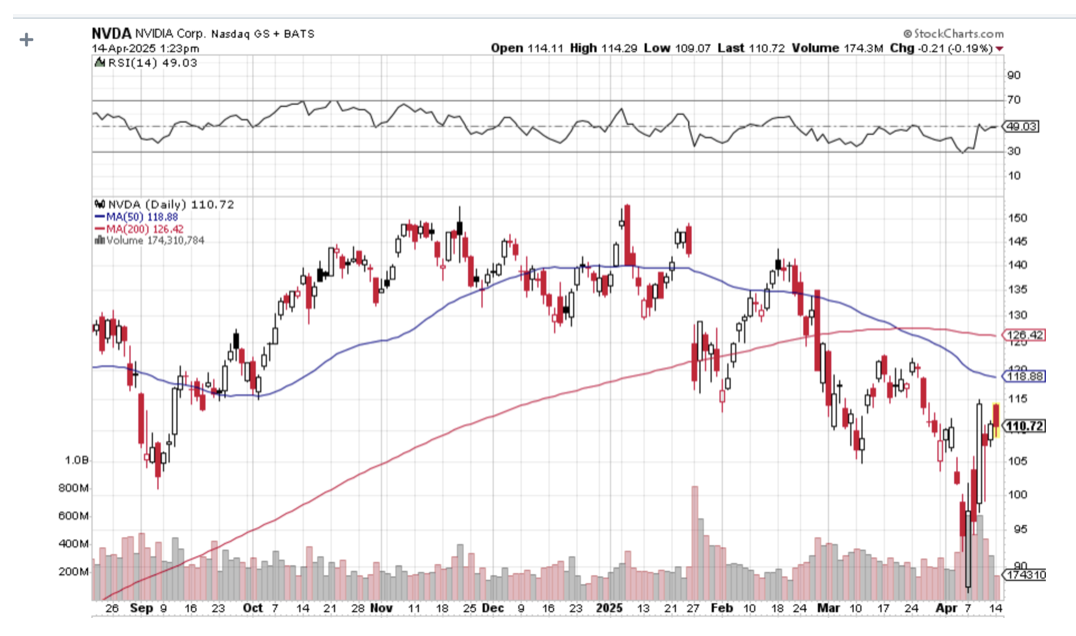
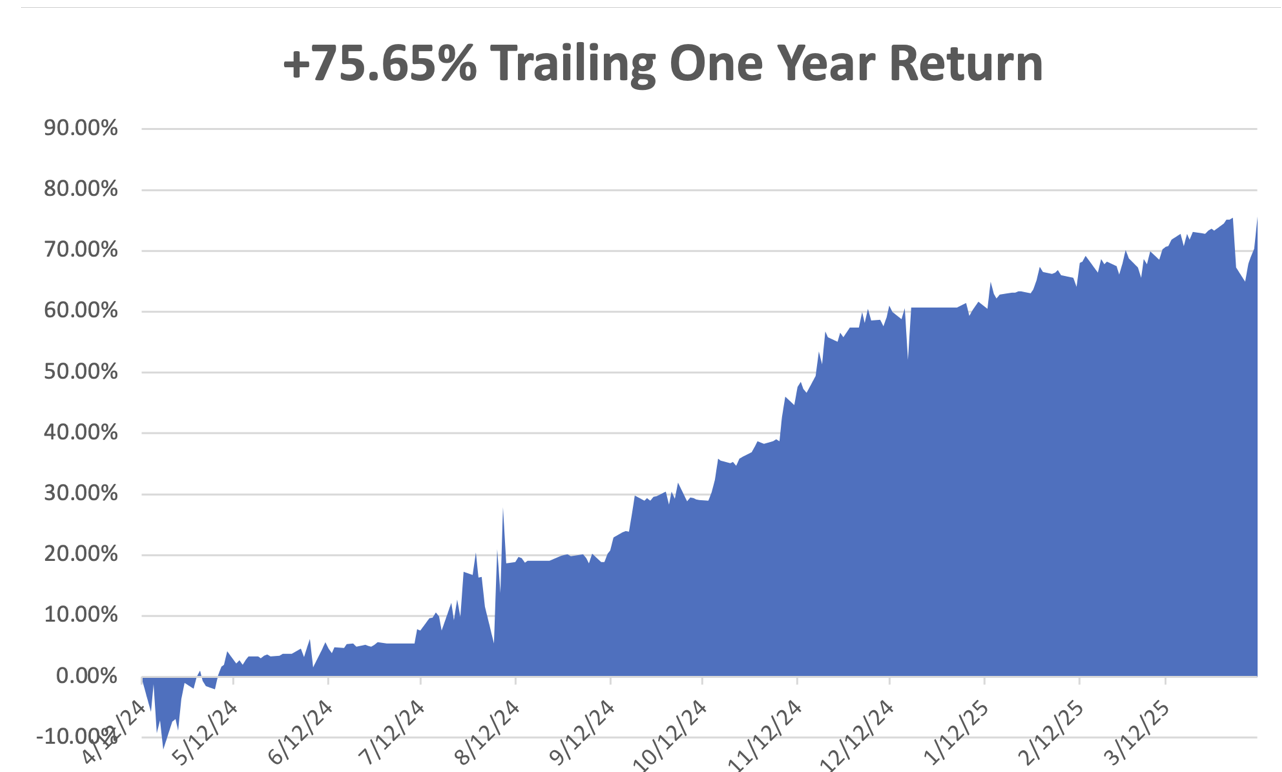
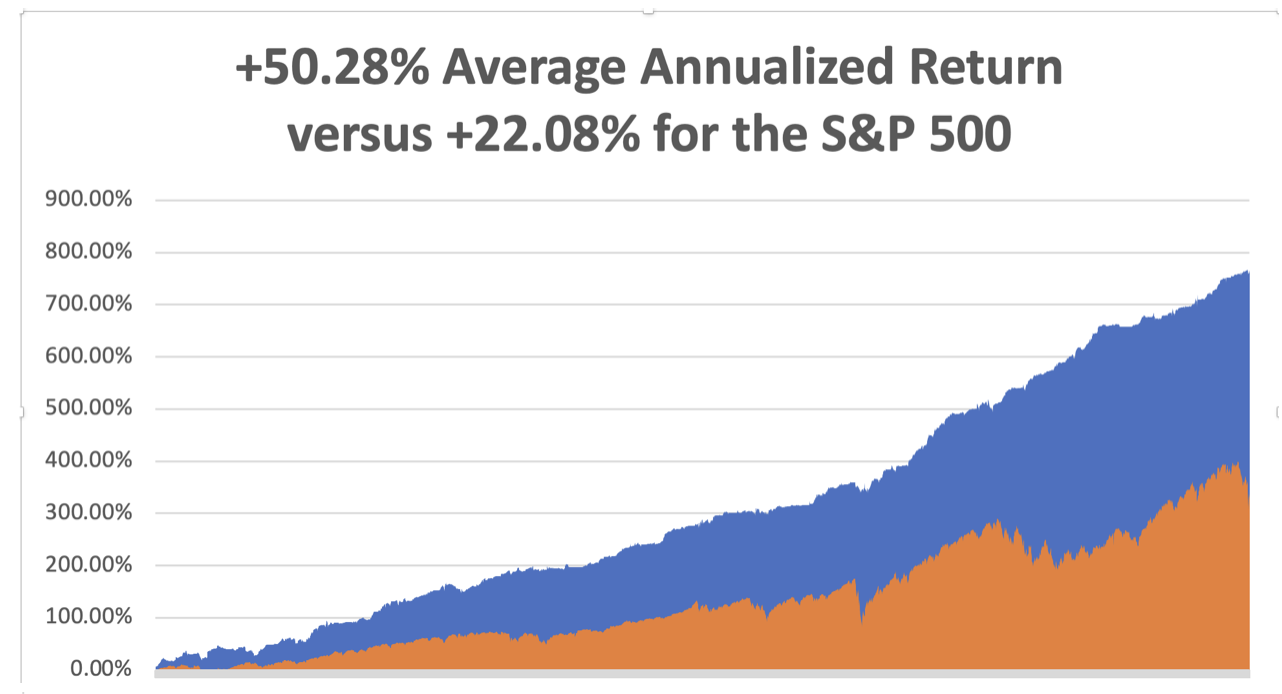
April is now up by -1.13%so far due to the explosion in implied volatilities in our hedged positions. A lot of the Friday options prices made no sense and may reflect broker efforts to increase margin requirements. That takes us to a year-to-date profit of +14.96%so far in 2025. My trailing one-year return stands at a spectacular +75.65%. That takes my average annualized return to +50.28%and my performance since inception to +765.85%, a new all-time high.
It has been another wild week in the market. I was forced out of longs in (GLD) and (TLT) thanks to panic-inspired out-of-the-blue freefall. I managed to hang on to my longs in (COST), (NVDA), and (NFLX) because they were so far in the money. I used a 25% rally in the leveraged long Bitcoin play (MSTR) to add a short. I also used a run by the Volatility Index ($VIX) to $54 to add the Proshares Short VIX Short Term Futures ETN (SVXY). Unusual times call for unusual trades.
Some 63 of my 70 round trips, or 90%, were profitable in 2023. Some 74 of 94 trades have been profitable in 2024, and several of those losses were really break-even. That is a success rate of +78.72%.
Try beating that anywhere.
My Ten-Year View – A Reassessment
We have to substantially downsize our expectations of equity returns in view of the election outcome. My new American Golden Age, or the next Roaring Twenties is now looking at multiple gale-force headwinds. The economy will completely stop decarbonizing. Technology innovation will slow. Trade wars will exact a high price. Inflation will return. The Dow Average will rise by 600% to 240,000 or more in the coming decade. The new America will be far more efficient and profitable than the old. My Dow 240,000 target has been pushed back to 2035.
On Monday, April 14, at 8:30 AM EST, the Consumer Inflation Expectations are announced.
On Tuesday, April 15, at 8:30 AM, the New York Empire State Manufacturing Index isreleased.
On Wednesday, April 16, at 1:00 PM, the Retail Sales are published.
On Thursday, April 17, at 8:30 AM, the Weekly Jobless Claims are disclosed. We also get Housing Starts and Building Permits.
On Friday, April 18, markets are closed for Good Friday.
As for me, in 1987, to celebrate obtaining my British commercial pilot’s license, I decided to fly a tiny single-engine Grumman Tiger from London to Malta and back.
It turned out to be a one-way trip.
Flying over the many French medieval castles was divine. Flying the length of the Italian coast at 500 feet was fabulous, except for the engine failure over the American air base at Naples.
But I was a US citizen, wore a New York Yankees baseball cap, and seemed an alright guy, so the Air Force fixed me up for free and sent me on my way. Fortunately, I spotted the heavy cable connecting Sicily with the mainland well in advance.
I had trouble finding Malta and was running low on fuel. So I tuned into a local radio station and homed in on that.
It was on the way home that the trouble started.
I stopped by Palermo in Sicily to see where my grandfather came from and to search for the caves where my great-grandmother lived during the waning days of WWII. Little did I know that Palermo had the worst windshear airport in Europe.
My next leg home took me over 200 miles of the Mediterranean to Sardinia.
I got about 50 feet into the air when a 70-knot gust of wind flipped me on my side perpendicular to the runway and aimed me right at an Alitalia passenger jet with 100 passengers awaiting takeoff. I managed to level the plane right before I hit the ground.
I heard the British pilot of the Alitalia jet say on the air, “Well, that was interesting.”
Fire engines flashing lights descended upon me, but I was fine, sitting in my cockpit, admiring the tree that had suddenly sprouted through my port wing.
Then the Carabinieri arrested me for endangering the lives of 100 tourists. Two days later, the Ente Nazionale per l’Aviazione Civile held a hearing and found me innocent, as the windshear could not be foreseen. I think they really liked my hat, as most probably had distant relatives in New York City.
As for the plane, the wreckage was sent back to England by insurance syndicate Lloyds of London, where it was disassembled. Inside the starboard wing tank, they found a rag that the American mechanics in Naples had left by accident.
If I had continued my flight, the rag would have settled over my fuel intake valve, cut off my gas supply, and I would have crashed into the sea and disappeared forever. Ironically, it would have been close to where French author Antoine de St.-Exupery (The Little Prince) crashed his Lockheed P-38 Lightning in 1944.
In the end, the crash only cost me a disk in my back, which I had removed in London and led to my funny walk.
Sometimes, it is better to be lucky than smart.
Antoine de St.-Exupery on the Old 50 Franc Note
Good Luck and Good Trading,
John Thomas
CEO & Publisher
The Diary of a Mad Hedge Fund Trader
https://www.madhedgefundtrader.com/wp-content/uploads/2022/03/plane.png544844april@madhedgefundtrader.comhttps://madhedgefundtrader.com/wp-content/uploads/2019/05/cropped-mad-hedge-logo-transparent-192x192_f9578834168ba24df3eb53916a12c882.pngapril@madhedgefundtrader.com2025-04-14 09:02:222025-04-14 11:20:19The Market Outlook for the Week Ahead, or Rearranging the Deckchairs on the Titanic
Legal Disclaimer
There is a very high degree of risk involved in trading. Past results are not indicative of future returns. MadHedgeFundTrader.com and all individuals affiliated with this site assume no responsibilities for your trading and investment results. The indicators, strategies, columns, articles and all other features are for educational purposes only and should not be construed as investment advice. Information for futures trading observations are obtained from sources believed to be reliable, but we do not warrant its completeness or accuracy, or warrant any results from the use of the information. Your use of the trading observations is entirely at your own risk and it is your sole responsibility to evaluate the accuracy, completeness and usefulness of the information. You must assess the risk of any trade with your broker and make your own independent decisions regarding any securities mentioned herein. Affiliates of MadHedgeFundTrader.com may have a position or effect transactions in the securities described herein (or options thereon) and/or otherwise employ trading strategies that may be consistent or inconsistent with the provided strategies.