(THERE MAY BE LIGHT AT THE END OF THE TUNNEL AFTER A LONG “WINTER” FOR MINERS IN AUSTRALIA)
August 28, 2024
Hello everyone,
Some good news from BHP
BHP has achieved a multi-billion-dollar profit, and it was all about China.
BHP shipped most of its iron ore off to China, but a hefty amount also went to Japan.
China’s insatiable demand for iron ore (and coal) drives prices, and BHP’s profits – last year, this year, and out into the 2030s.
Because of this trade, Canberra receives a sizeable tax from BHP as do the states from royalties.In the 2023-24 year, a not too shabby $US11bn ($16bn) changed hands.
The future of BHP, and indeed, Australia, remains all about China.
Despite China’s structural problems, BHP does not see Chinese demand for iron ore slipping, or even dramatically plunging, in the future.
And to counter all the negative narratives about BHP’s health in relationship to its main trading partner, BHP is actually planning to increase its production out of the Pilbara, from 260 million tonnes a year to 305 million tonnes; and has longer-term plans to go to 330m tonnes.
BHP is also increasingly about copper; and that is also mostly about China.
Worthy of note is the fact that 50% of copper produced in the world is consumed by China, as was pointed out on Tuesday by BHP’s CFO, Vandita Pant.
Copper contributed just under $US9bn, or nearly one-third of the group’s gross profit.
Interestingly, BHP’s CEO has stated that he expects a turnaround in China’s property sector in the year ahead.
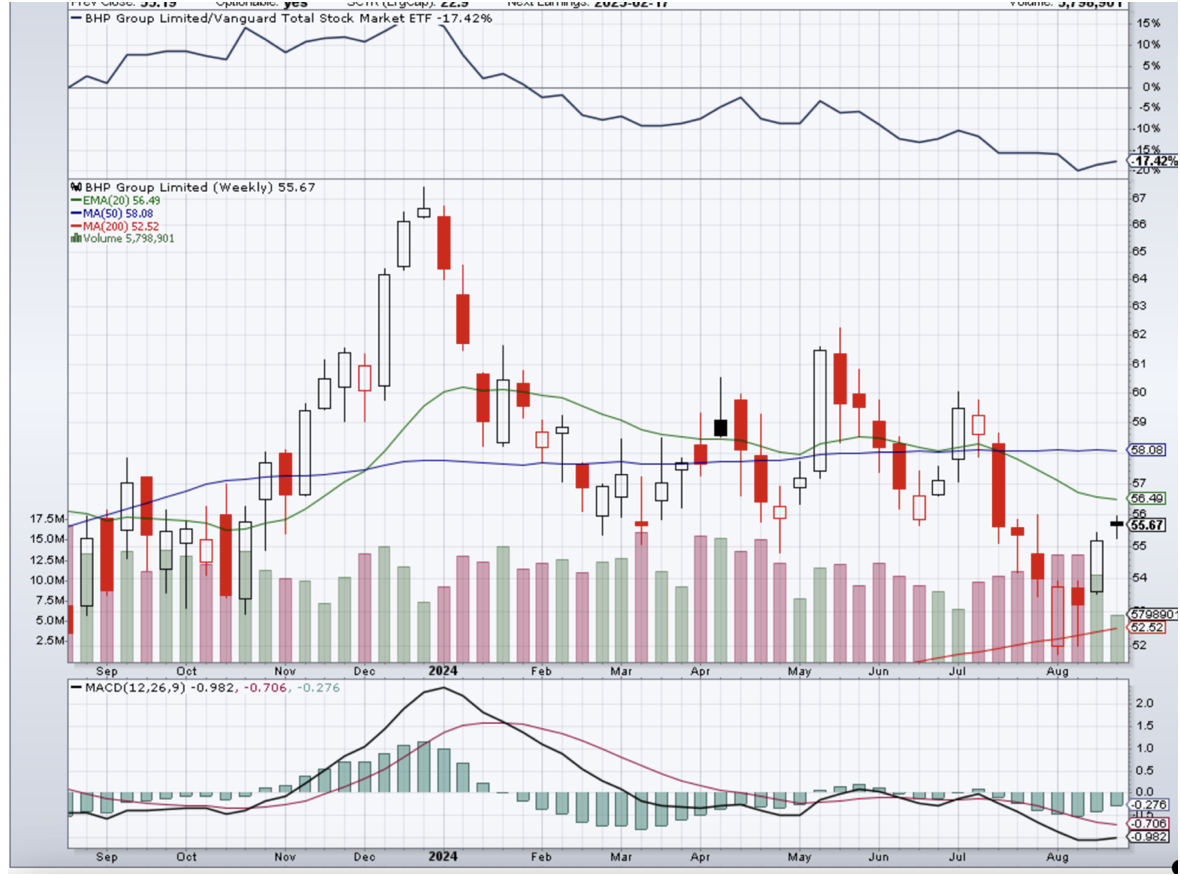
BHP WEEKLY CHART
QI CORNER
SOMETHING TO THINK ABOUT
Identity Theft is on the Rise
To protect your data, experts say freezing your credit should be a priority.
“Freezing your credit is the single most important thing you can do when you get a data breach notice,” James E. Lee, chief operating officer at the Identity Theft Resource Centre, a nonprofit working to minimize the risk of identity theft.
Freezing your credit is free and takes just minutes.
A credit freeze will limit access to your credit report and prevent the opening of new accounts in your name, either by you or other parties.
A credit freeze will last until you remove it.
To freeze your credit, you need to complete the process at all three major credit reporting agencies – Equifax, Experian, and TransUnion.Set up free online accounts with each agency.You can request a freeze by phone, mail, or online.
Monitor your free credit report to check the latest activity.
Other tips to keep your personal data secure.
Use complex and unique passwords for each website.
Use two-factor authentication or encryption.
Remove personal information on social media that can be used by identity thieves.
Set up alerts on accounts which will keep you up to date on the latest activity.
Earnings:Campbell Soup, Best Buy, Dollar General, Autodesk, Ulta Beauty, Lululemon Athletica
Friday Aug. 30
8:30 a.m. PCE Deflator (July)
8:30 a.m. Personal Consumption Expenditure (July)
Previous:2.6%
Forecast: 2.6%
8:30 a.m. Personal Income (July)
9:45 a.m. Chicago PMI (August)
10:00 a.m. Michigan Sentiment final (August)
This week is dominated by Nvidia earnings which are out Wednesday.
They will be closely watched as a guide to the direction of the whole sector, and the market as a whole.
On Aug. 5 we saw Nvidia shares fall as low as $90.69 per share amid a broader market sell-off, as well as reports of delays on its Blackwell chips.(Here, I told everyone to add weight).Now, they’ve surged more than 40%, to about $125 per share currently, as traders rushed to buy the dip.
CEO, Jensen Huang has revealed that the newest generation of its chips cost around $10 billion in research and development.Now, that is a huge barrier to entry for any competitor.
There are high expectations ahead of these results, so there is a possibility that the stock and the market could either act benignly to Nvidia’s numbers or dive.
Also noteworthy of attention this week is the July personal consumption expenditures price index (PCE).The numbers here could show that the Federal Reserve is well on its way to its 2% inflation objective, as the central bank prepares to cut rates in September – an action that Chair Jerome Powell last Friday indicated in his Jackson Hole speech.
“The time has come for policy to adjust…the direction of travel is clear, and the timing and pace of rate cuts will depend on incoming data, the evolving outlook, and the balance of risks.”
A softer inflation print implies investors can turn their attention to the labour market – next month’s job’s report, which could determine whether the Fed lowers rates by a quarter or half-percentage point in September.
Markets are currently pricing in the likelihood the key overnight lending rate will fall one percentage point by the end of the year to a range 4.25% - 4.5%.
Wall Street is bullish.But the journey from now until the end of the year may be fraught with turbulence, and high drama.Don’t forget we are in a seasonally weak period for stocks, and we are also heading into the U.S. presidential election.Add to that the ongoing geopolitical risks around the globe.
By and large, Wall Street is still shrugging its shoulders at world events and mapping out its own path.
But black swans are always lurking: what if the Fed back peddles on a 50pt rate cut, and what if the conflicts around the world escalate?And what if we are blindsided by something that is totally out of left field?
As I highlighted in an earlier post from a piece entitled – think backwards: think what can go wrong and then take steps to shore up your world against sudden shocks.Even more importantly, check your behaviour, and know what action to take after a shock takes place.
MARKET UPDATE
S&P500
We are still in an uptrend, but exhaustion is approaching.In the short term, the market’s strong rally from its 5,119 corrective Wave 4 low of October 5 is nearing completion and could well peak in the short term.
Then we are at a juncture.Either the market will correct to a Wave ii of Wave 5, enabling this final fifth wave advance to subdivide and extend considerably further over coming weeks/months before the bull market is exhausted, or it will mark the completion of Wave 5 itself, ushering in a bear market.
I am inclined to favour the former and am looking for the market to reach our H & S target of 5,735 or even rally towards 6,000 before exhaustion.
GOLD
The yellow metal continues in an uptrend after it showed a sustained break through the $2,500 level.
Support = $2,470/$2,500
Targets = mid $2,500’s and then on to $2,670.
BITCOIN
It’s possible to interpret a completed corrective structure here, which should enable the resumption of the coin’s uptrend.
Support= around $62,700/$61,500
Next Resistance = around $69,300
QI CORNER
PSYCHOLOGY CORNER
If It Fits, Take It
Take every setup that fits your system when it crosses your path.No amount of over-analysis will tell whether it really will work or not, but as long as it fits your setup, it’s good to take.When we over-scrutinize well-fitting setups, we create tension and anxiety.Take every opportunity that fits and allows you to trade in harmony with the market and put your faith in your setup, not your overly critical mind.
Know When to Cash Out
Regardless of whether you have a great analysis of what you think the market is going to do, you must develop a clear plan for exiting a trade a winner.Without a clear trigger, many traders will hold on, expecting (and hoping) the market will move in the direction their analysis indicated.The problem is the market doesn’t always go in the way well-thought-out analysis said it would.Have a trigger in place to take your profits rather than let the market deliver a clear exit sign.
HISTORY CORNER
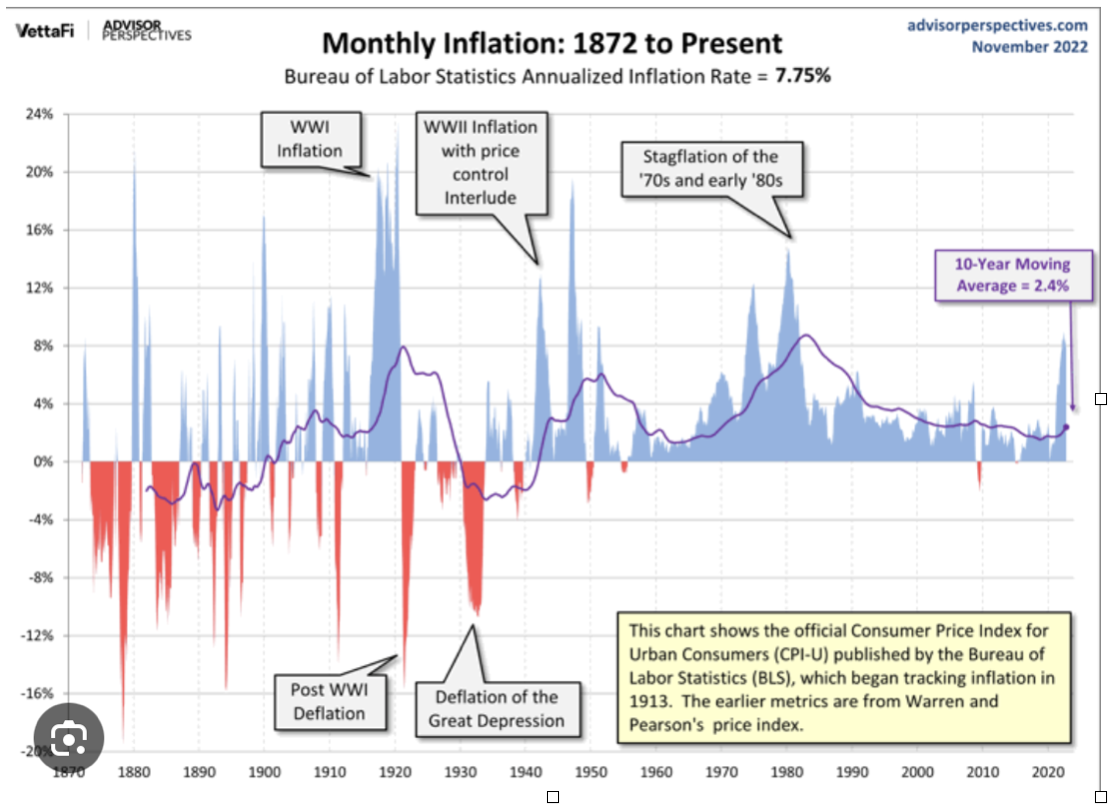
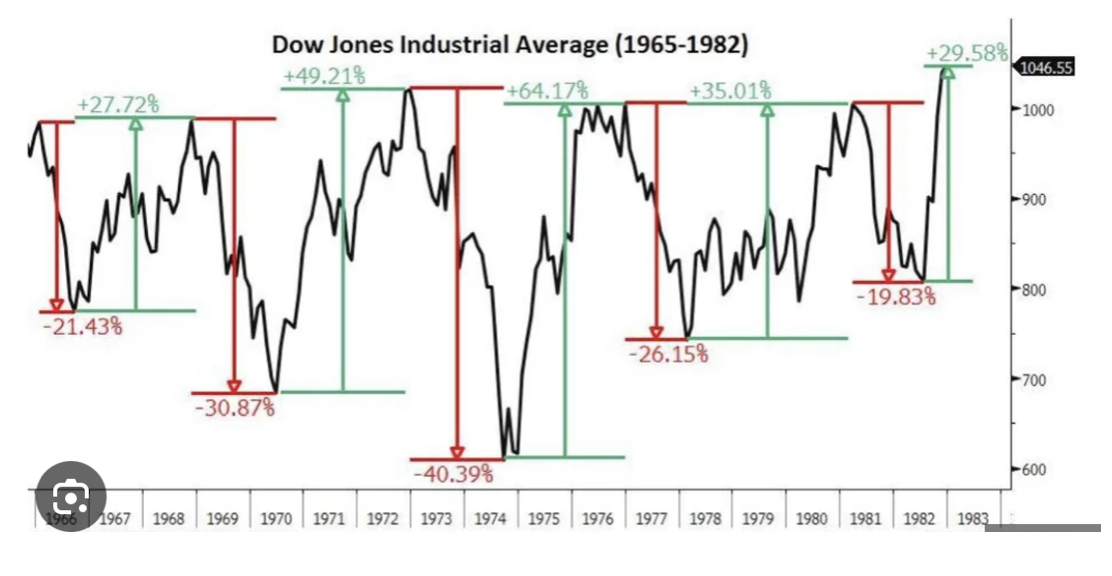
A period of Great Inflation lasted from 1965-1982.
Over the nearly two decades it lasted, the global monetary system established during World War II was abandoned, there were four economic recessions, two severe energy shortages, and the unprecedented peacetime implementation of wage and price controls.Siegel saw it as “the greatest failure of American macroeconomic policy in the postwar period.”
But out of failure can also come change, and that became evident in macroeconomic theory, and the rules that today guide the monetary policies of the Federal Reserve and other central banks around the world.If the Great Inflation was a consequence of a great failure of American macroeconomic policy, its conquest should be counted as a triumph.
SOMETHING TO THINK ABOUT
“He who buys what he does not need steals from himself.” – Swedish Proverb
According to a new report, some 100,000 people could lose their jobs in Australia over the next 12 months.
The unemployment rate, currently at 4.2% could peak at 4.5%, according to the report.
This is slightly higher than the 4.4% peak in unemployment tipped by the Reserve Bank of Australia (RBA) by June 2025.
It attributes the stagnation of jobs and economic growth to the RBA’s interest rate hikes aimed at cutting inflation back to a rate of 2-3%.
David Rumbens, Deloitte Access Economics partner explained to SBS News that the labour market has continued to generate jobs so far in 2024, but not at a high enough rate to absorb all the additional job seekers that have come onto the labour market.
He further highlighted the probability that the slowdown would mean about 100,000 more people would be unemployed.
He explained that “high interest rates are taking money out of the economy that’s affecting consumer spending.”
Even though business investment is low, and business insolvencies are going up, Rumbens argued that the economic dip was not at recessionary levels, even though a lot of sectors would see it as a recession.
Consumer-facing sectors such as construction, retail, and hospitality are usually the hardest hit by an economic slowdown.
However, the focus on homebuilding and infrastructure should keep construction workers in high demand.Deloitte is forecasting a 2% expansion in the blue-collar workforce – 74,300 workers – this financial year.
In the same period, the group forecasts a dip in white-collar jobs of 0.4% or 23,599, as businesses “look to kickstart activity without increasing headcount.”
Australians are being squeezed…
According to the Australian Bureau of Statistics, almost a million people are now working two jobs or more to keep up with the cost of living.
Money.com.au warned the average Aussie needs to earn $107,730 a year to weather the cost-of-living crisis, with the figure even worse for homeowners at $120,294 a year to absorb rising interest rates too.
Mortgage repayment costs have jumped by $12,564 a year for a loan that averaged $555,600 in mid-2021, according to money.com.au expert Sean Collery, with average owner occupier home loan rates rising from 2.84 per cent to 6.03 per cent in the past few years.
Research shows that teachers and accountants, are among other professionals working two or more jobs to keep up with expenses.
Queensland teacher, Sebastian Kath, says the “cost of housing in Queensland is astronomical.”He is considering looking overseas “for better value for my money.”
(THE PLUNGE IN IRON ORE PRICES IS BAD NEWS FOR AUSTRALIA, BUT GOOD NEWS FOR THE REST OF THE WORLD)
August 21, 2024
Hello everyone,
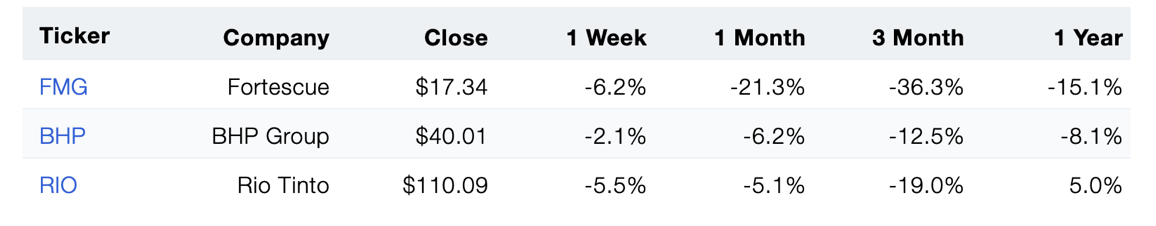
Iron ore prices have halved since their peak in January. Share prices have had a 20% haircut consequently.That’s bad news for BHP and Rio Tinto and their shareholders.
“Twiggy” Forrest’s Fortescue Metals (FMG) is down an eye-watering 43%, as it is particularly sensitive to the rise and fall of the China-driven iron ore price.
And to top it all off for “Twiggy”, Fortescue’s iron ore is apparently below par in quality when compared with BHP and Rio’s (and Brazil’s Vale).
Obviously, when China is booming and iron ore is in demand, all is good in Fortescue’s world, as the price that this company gets starts to approach the BHP/Rio price.
When the opposite happens, however, its price falls further and faster, and the drop in price comes straight off Fortescue’s profit.
Right now, BHP and Rio are also feeling the pain.
It’s unfortunate for Australia that our entire economic prosperity appears to be built on China.
China drives both the prices of and the volumes of coal and gas that Australia sells into the global market, regardless of whether it buys or doesn’t buy directly from us.It’s a similar story with iron ore.
So, what we need to understand is that if their prices really plunged, and stayed down for any extended period, the Aussie dollar would most likely collapse and Australia’s economy would become a junk heap.
For the rest of the world, that price collapse would be good news.Lower iron ore and energy prices would feed into lower prices for everything across the world.
The new narrative landscape would arguably include near-zero inflation, much lower interest rates, and booming economies.
BHP is now trying to backpedal, to some extent. After going long iron ore and China, by selling out of fossil fuels, BHP is endeavoring to diversify into other commodities.
Rio has invested heavily in Africa, for its iron ore exposure.
The giant Simandou iron ore project in Guinea, set to be the world’s largest and highest-grade new iron ore mine, will commence production by the end of 2025 and will add annual output of around 120 million metric tons of high-quality iron ore after it reaches full capacity.
So, when might we see the bottom in iron ore prices?
Morgan Stanley expects a “rebound in one to two months due to an efficient supply response from marginal units.”
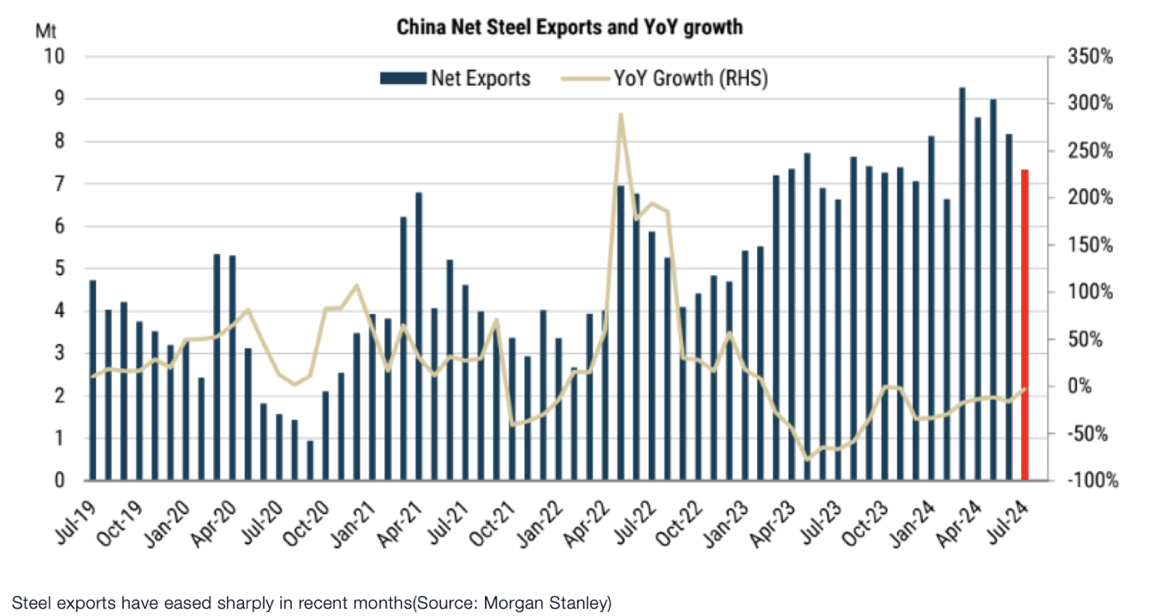
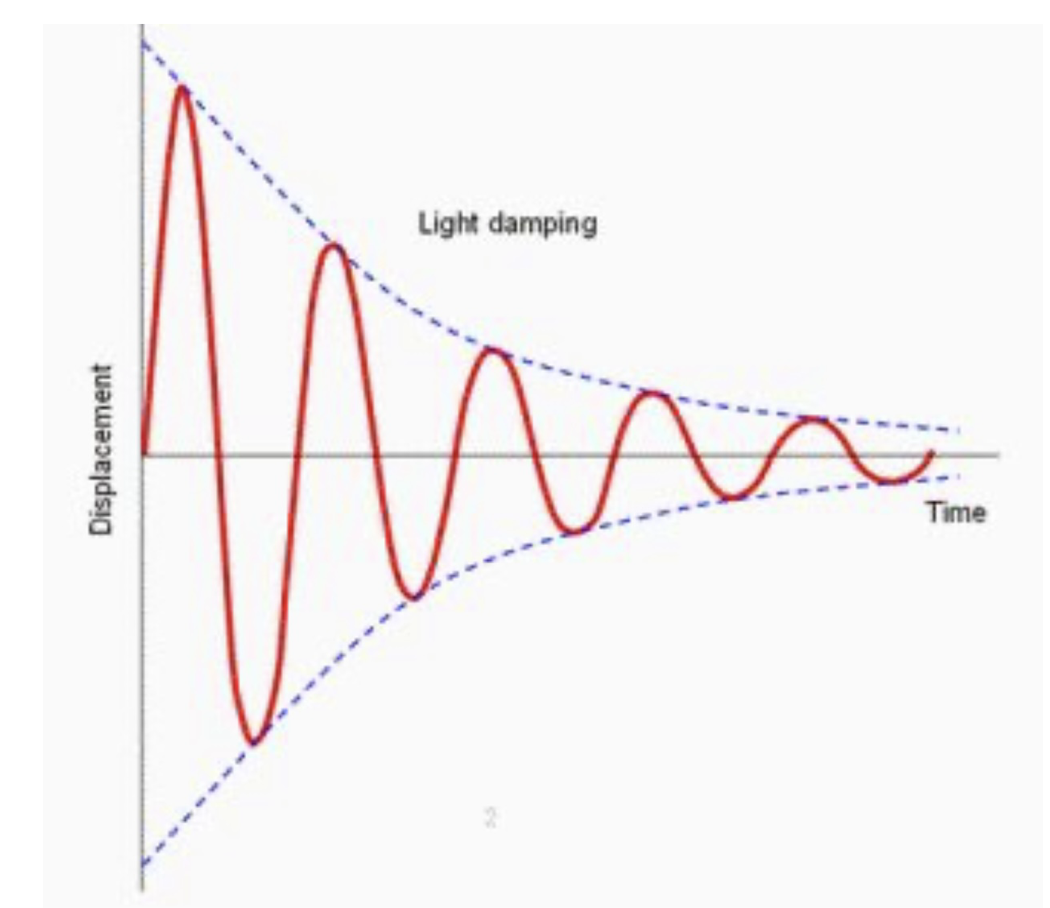
News flow and sentiment influence iron ore prices, so it is not surprising to see that remarks from some of China’s top steel makers have put the market on edge.As cited in the Financial Times, Hu Wangming, chair of China Baowu Steel Group argued that the steel industry “winter” was likely to be “longer, colder and more difficult than we expected.”Furthermore, he warned that current steel market conditions may be more severe than the downturns experienced in 2008 and 2015.
Adding to the angst is recent Chinese economic data, which shows:
New construction fell 20% year-on-year in July, only a slight improvement from June’s 22% fall.
Property investment in China fell 10% in the first seven months of the year.
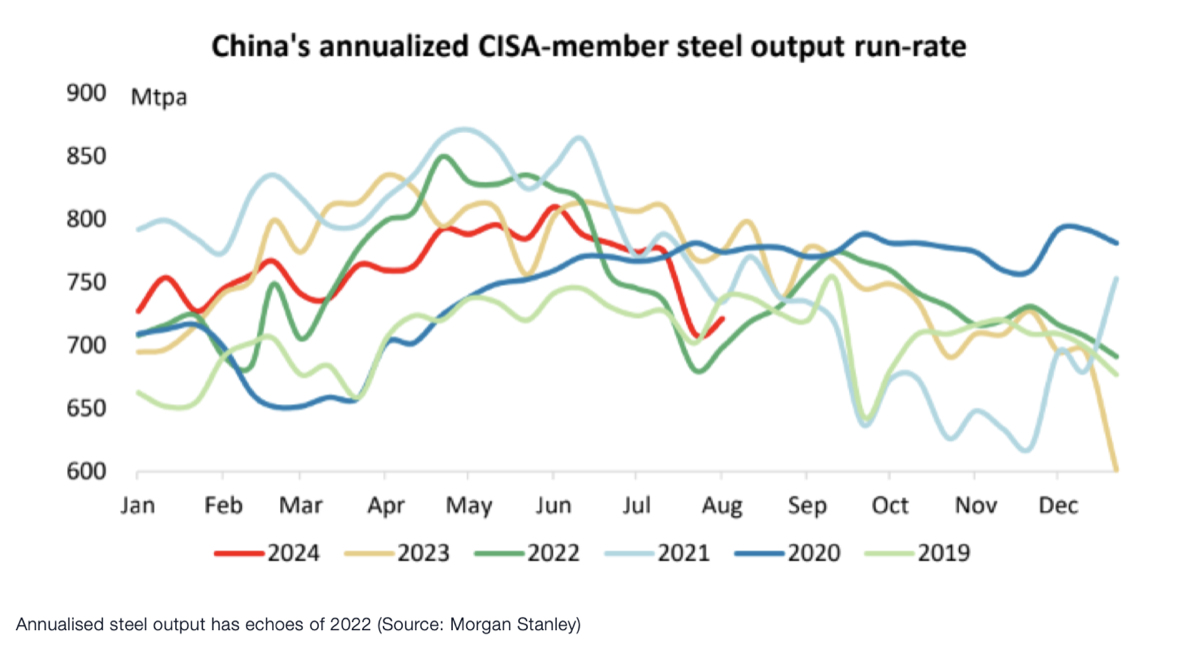
China’s steel exports fell 10% month-on-month in July, marking a slowing in the annualized run-rate to 88 million tonnes, down from 110 million tonnes earlier this year.
July crude steel output is down 9.5% month-on-month and 9% year-on-year.
China’s portside iron ore inventory is sitting around a one-and-a-half-year high.
Worst case scenario?
A more severe economic slowdown in China was exacerbated by decelerating growth in other regions.
As we approach the December quarter we should be watching the monthly World Steel production data and the 10-day CISA (China Iron & Steel Association) steel output series.
QI CORNER
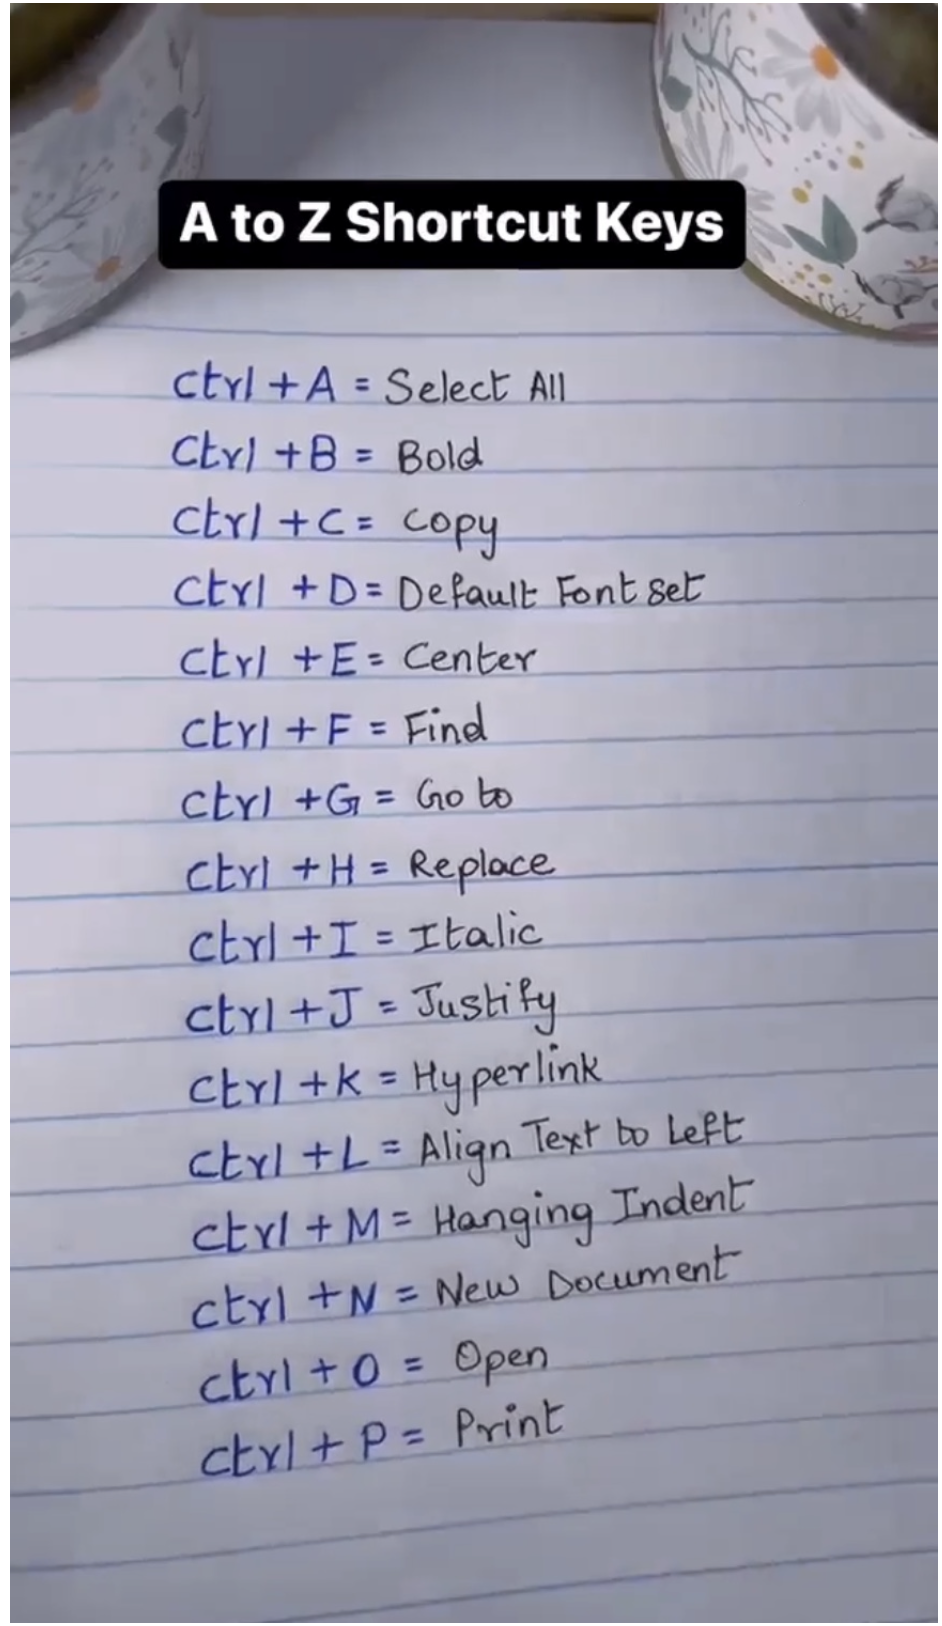
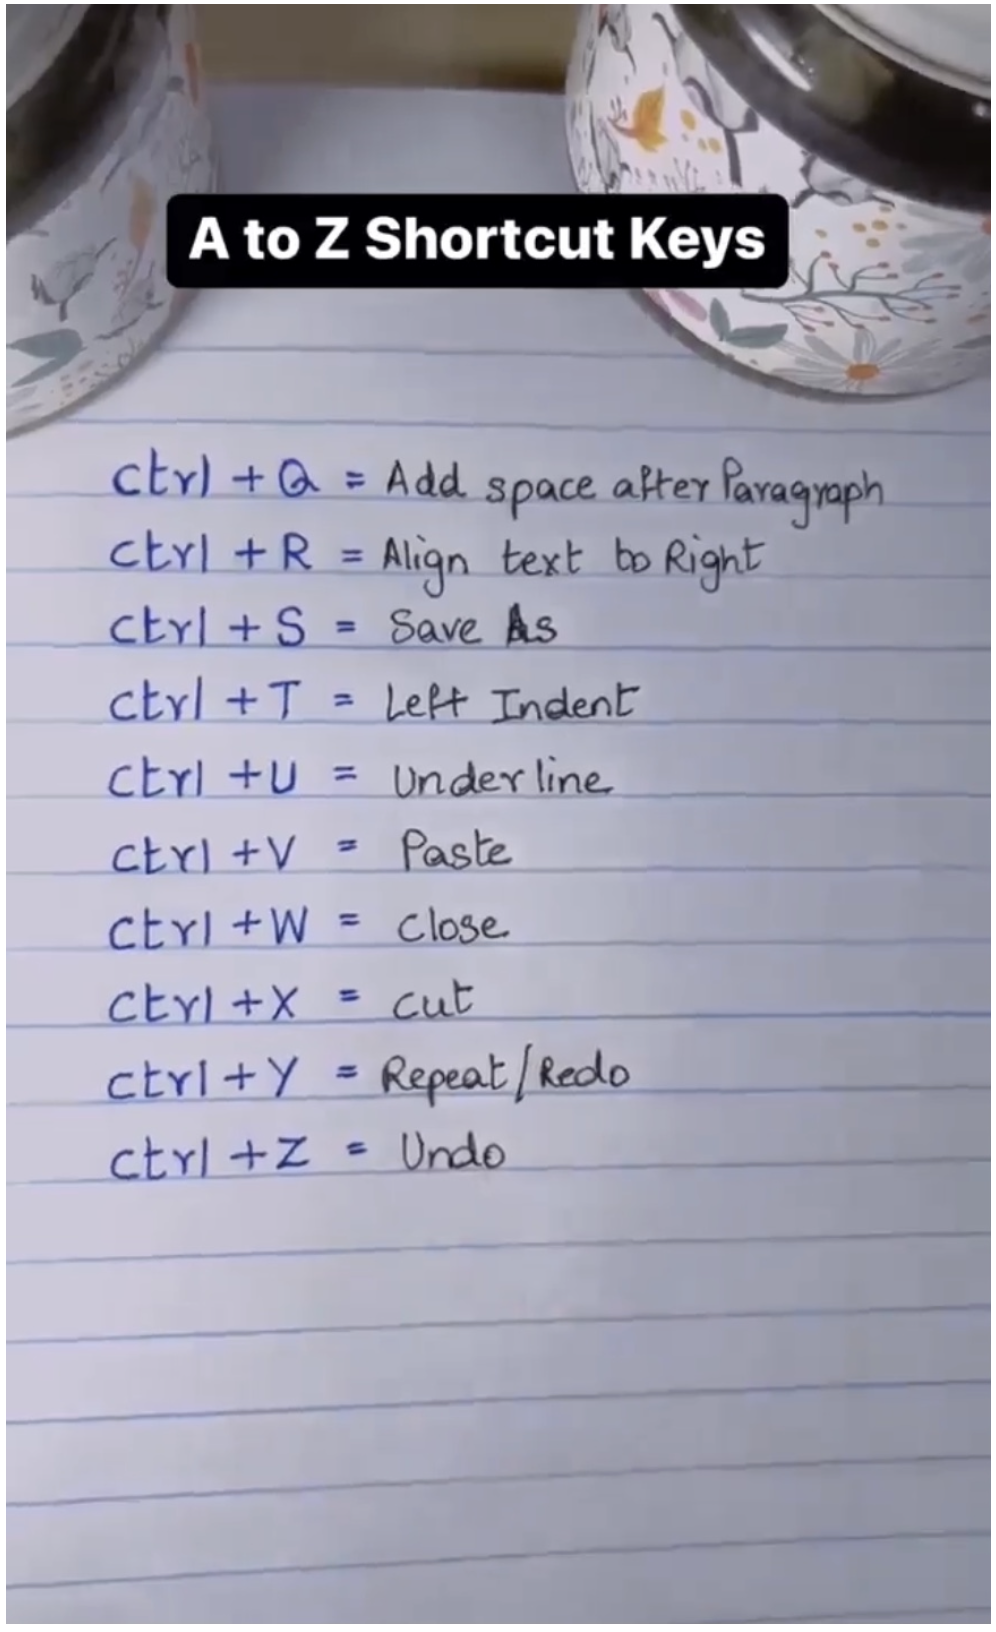
EMPOWERING PRODUCTIVITY
Proving that everything does not have to be about numbers; letters can be very useful too.
11 a.m. Kansas City Fed Manufacturing Index (August)
7:30 p.m. Japan Inflation Rate
Previous: 2.8%
Forecast: 2.9%
Earnings:Intuit, Ross Stores
Friday Aug 23
8:00 a.m. Building Permits (July)
10 a.m. New Home Sales (July)
Later this week, we will be tuned into Jerome Powell’s speech at the Jackson Hole symposium.This speech comes just a few weeks after the July Fed meeting where he gave investors some confidence that a September rate cut was on the table. This confidence was built on “coded statements” from Powell, that appeared to say a lot, without saying anything decisive.
To further confuse investors about the Fed’s actions going forward, we were whipsawed by the Aug 2 non-farm payrolls data, and then the retail sales report and softer inflation data last week.
This week investors will also be able to examine the behaviour of the consumer as we have earnings results from retail chains, including Lowe’s and Target.
We can also pore over weekly continuing and initial unemployment claims data to gauge the temperature of the labour market.
Outside the U.S., attention will focus on inflation metrics, with significant data releases from Canada and Japan.
Goldman Sachs urges investors to “keep the faith” that the U.S. will avoid a recession…
My advice: be ready to take advantage of any volatility going forward. Scale into sold-off stocks and gradually build your positions.
MARKET UPDATE
S&P 500
The market rejected the recent low a couple of weeks ago very quickly.Is that the low?We can never be certain.If it is, then we have made an Elliott Wave 4 pattern low, which should now be followed by the market running up to new highs in the mid-5,700’s or toward 6000.(But don’t expect a straight lineup). Only once this Wave 5 is over, will the bullish sequence from the October 2022 low of 3,492 be complete.And this then leaves the market vulnerable to its biggest corrective sell-off since this bottom.The market will tell us where the top is in its Wave structure over the coming weeks/months.
GOLD
Gold has pierced the $2,500 level, and now seems set to rally to the mid $2,500’s and then $2,670.Support lies around $2,480-$2,450.
BITCOIN
Bitcoin is still undergoing a complex corrective structure.Support is still found in that band between $40k and $50k.We are looking for a sustained break above $60,000 to encourage advance toward the $70,000 level, enroute to the key $73,794 resistance.
QI CORNER
Elon Musk, Albert Einstein, Charlie Munger and many others are big believers in INVERSION THINKING.
What is it exactly?
Let’s throw some light on it by looking at some extracts from Alex Penunuri on X.
Inversion thinking is a problem-solving technique where you tackle problems backward.Instead of focusing on success, you identify WHAT leads to FAILURE and AVOID those actions.This leads to a faster & easier decision-making process.
Elon Musk is a big advocate of inversion thinking.He often uses it to avoid pitfalls in his ventures.He identifies potential failures early & steers his projects away from common mistakes.
It’s also a tool Charlie Munger regularly used.“Avoiding stupidity is easier than seeking brilliance” – he believed.Rather than trying to win, avoid losing.
Why is inversion thinking so powerful?As humans, we’re better at seeing threats than seeing opportunities.By inverting your thinking, you turn complex problems into obvious solutions.
Another benefit of inversion thinking is its ability to relieve anxiety. When facing a difficult problem, it’s hard to see the way out.Inversion lets you see situations from a different angle.
Another example:Building a relationship.What behaviours will ruin a relationship? Judgement, Lack of communication, No respecting the other person.By inverting the question, you can easily see how to avoid a bad relationship.
What about the business context…What behaviours would ruin a business?Having a bad product.Not promoting your stuff.Giving customers a poor experience.It’s hard to see how to grow a business, easy to see how you can destroy one.
How can you apply Inversion Thinking in your life:
1/ Find the problem
2/ Identify the desired outcome
3/ Invert it by asking what would prevent that goal from happening
Mad Hedge came out of the first crash of 2024 with decent positive returns in July and August.
We have covered exactly 2/3 of the crash losses right here.
Market has become ultra-sensitive to every economic data point.
Expect one more pullback unless every data point from here is perfect.
US Dollar gets dumped and could stay weak for years, while the Japanese yen puts on a spectacular show up and down.
Technology stocks will recover after a correction lasting months.
Energy gets dumped on recession fears if the Fed acts too slowly.
Buy stocks and bonds on dips, ALL sectors.
WHAT I DID RIGHT – NEVER STOP TRADING
(Seven Trade Alerts were executed on August 5)
John went into the meltdown with nine short positions in July-August, which covered most of his losses.
He only ran positions into very short August 16 option expiration, limiting damage.
Limited losses by stopping out of out-of-the-money losers quickly in (CAT), (BRK/B), and (AMZN).
Super aggressive when the Volatility Index ($VIX) hit $65, a two-year high.
He went hyper-conservative by adding four technology positions very deep 20% in-the-money in (NVDA), (META), (TSLA), and (MSFT).
He used the first 1,000-point rally to add a short position for every long, neutralizing the portfolio at the middle of the recent range and taking in a lot of extra income.
WHAT TO DO NEXT
Let the last position expire at max profit on August 16 option expiration.
Go 100% cash.
Wait for an extreme move up or down before adding new long or short positions, for the Volatility Index ($VIX) to pop above $30.
Watch for special situations, like (LRCX) where the Mad Hedge Technology Letter put out a buy on a strong earnings report.The stock immediately rocketed 25%.
Take your wife or partner out to a nice restaurant and spend the money you made.
STOCKS – IS THE BOTTOM IN?
John doesn’t think so. The valuation disparity between big tech and value is still miles wide.
$150 billion in Volatility plays were dumped on Monday.
Uncertainty reaches a maximum just before the election.A bottom for the year is coming, but not yet.
Delta loses $550 million in CrowdStrike computer crash, which lost the airline an eye-popping 7,000 flights.
No Recession here, says shipping giant Maersk, U.S. inventories are not at a level that is worrisome.
Warner Brothers wrote down $9 billion on disappearing TV business.
Super Micro (SMCI) announces 10:1 share split.
Foreign investors pull a record amount from China, $15 billion in Q2.
Buy (META) on a dip.
Buy two-year LEAPS on (CCJ)
(FCX) – double up down to $30.
Buy REITS = great yield.
BONDS – UPSIDE BREAKOUT
Market prices in 50-point basis cut for September.
Warren Buffett now owns more T-bills than the Federal Reserve. The Omaha, Nebraska-based conglomerate held $234.6 billion in short-term investments in Treasury bills at the end of the second quarter.
Cold CPI assures September interest rate cut, sends all fixed income securities soaring.
Bonds holding gains even in the face of a summer stock correction.
Buy (TLT), (JNK), (NLY), (SLRN), and REITS on dips.
FOREIGN CURRENCIES – Goodbye Yen Carry Trade
Japan’s Carry trade ends, prompted by rising interest rates that catapulted the Japanese currency by 14% in days.
For the past 30 years, hedge funds have been financing their positions through selling short the yen, which yielded zero, and investing the proceeds anywhere in the world into anything with a positive return.
They then leveraged this position times ten or more, creating a massive global market impact.
The Bank of Japan move to raise interest rates by a mere 25 basis points ended this game.
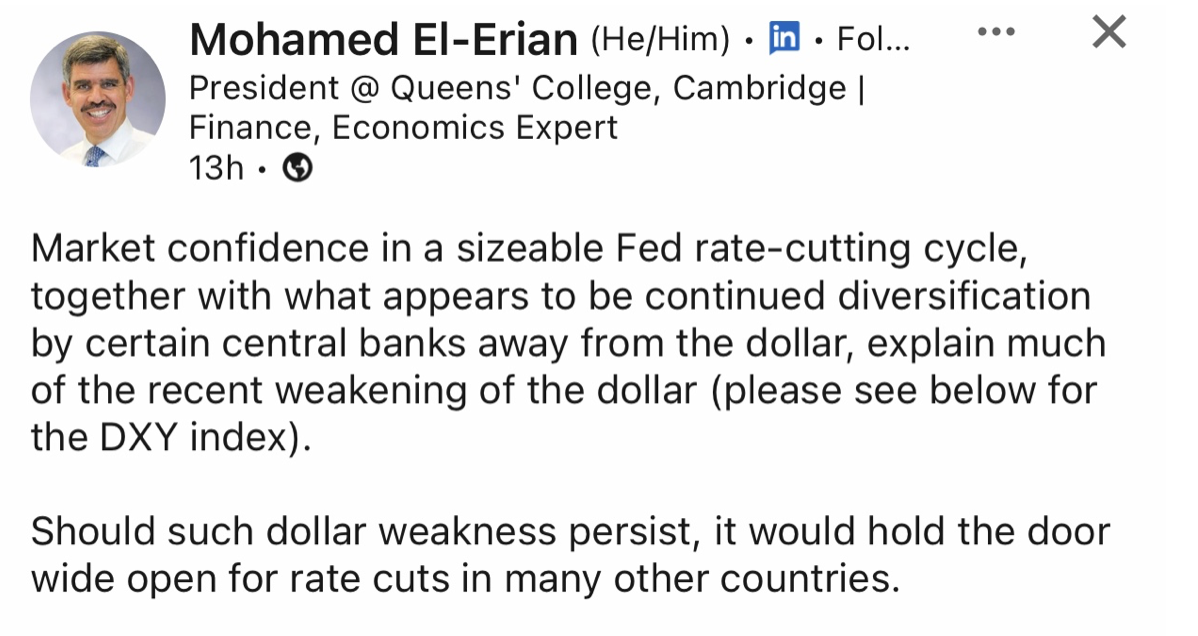
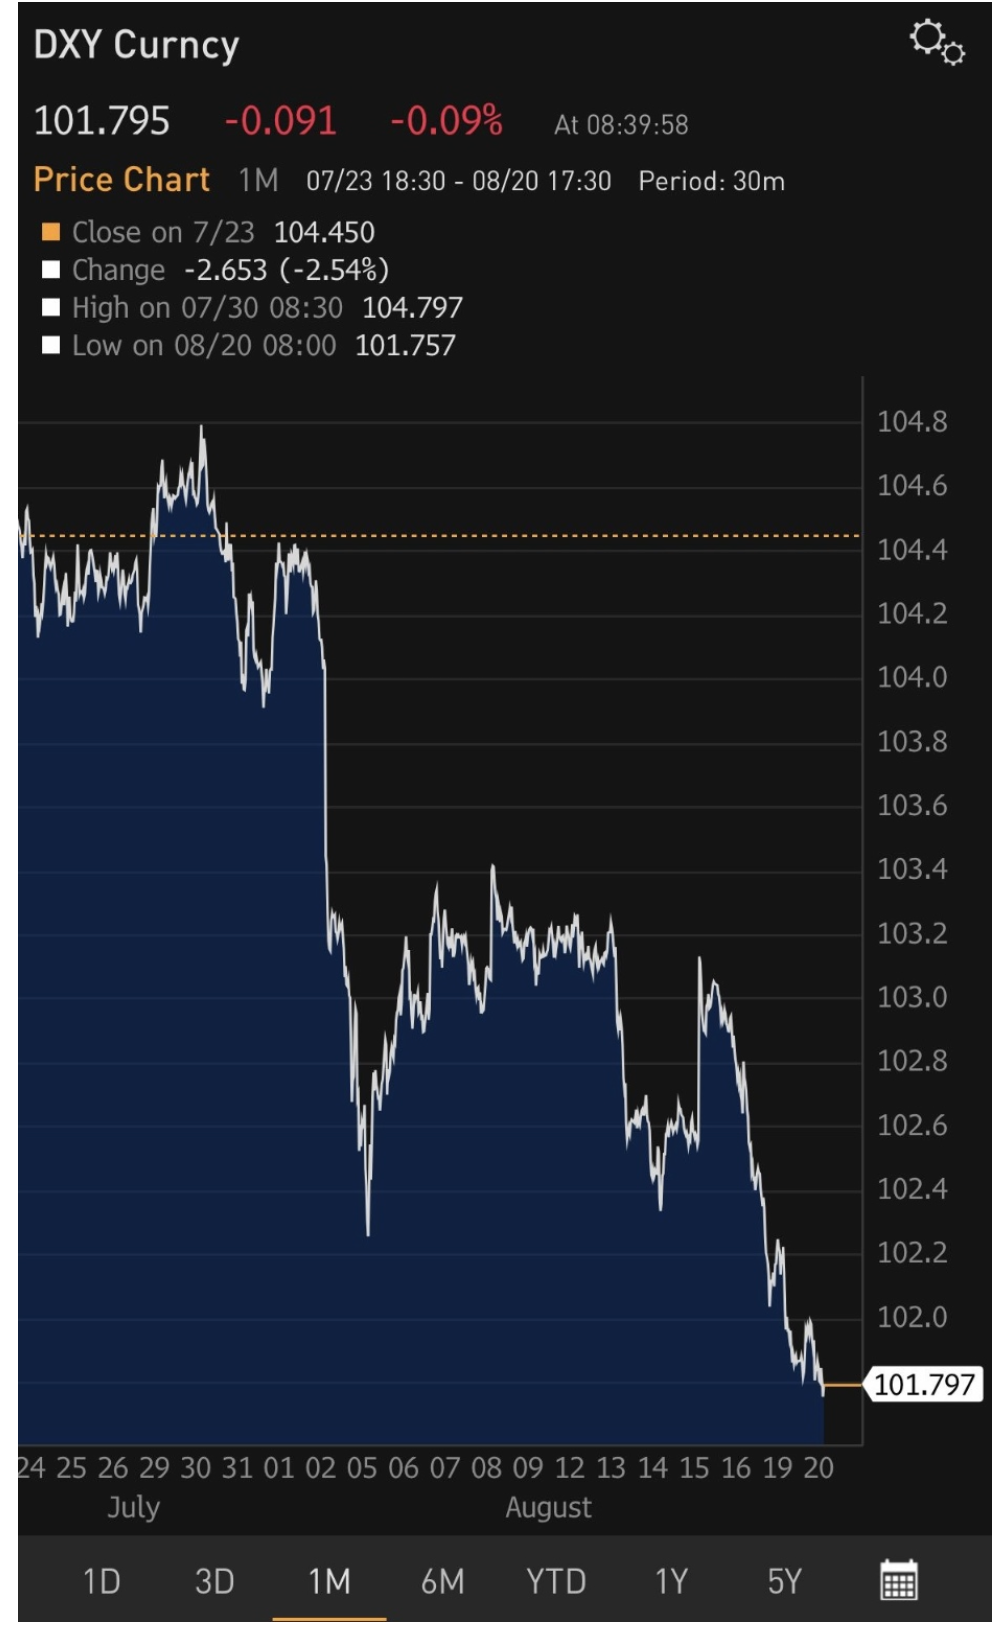
The prospect of falling interest rates means that the greenback is on the way down.
It’s all in response to the blockbuster negative CPI.
Buy (FXA), (FXE), (FXB), (FXC).
ENERGY & COMMODITIES – Recession Fears
Oil collapses to $71 a barrel, taking the rest of the commodity space down with it.
This is despite the support from multiple Middle Eastern wars.
No one wants to pay for storage during a recession, especially with the current high interest rates.
Weak Chinese economic data was the gasoline on the fire.
Replacement by EV’s and the shift out of cars into planes are big factors.
PRECIOUS METALS – New Highs
Gold - new all-time highs.
Silver takes a break from economic slowdown, and enters sideways range.
Miners have started to outperform metals for the first time in years, indicating an increase in investor leverage.
A global monetary easing is at hand.
Buy precious metals on the dip because rates have to fall eventually.
Miners are expanding their operations and ramping up production as prices for the precious metal climb to decade highs.
Buy (GLD), (SLV), and (WPM) on dips.
REAL ESTATE – A shot in the arm
A refi boom is about to begin.Mortgage rates in the high fives are now on offer.
Over 40% of existing mortgages have rates of over 6%.
It’s all driven by the monster rally in the bond market this week which took the (TLT) to $100 and ten-year US Treasury yields down to 3.65%.
Pending home sales rocketed 4.8% in June, versus 1.0% expected.The rise in housing inventory is beginning to lead to more contract signings.
Homeowners Insurance premiums rocketed by 21% last year.
Home insurers take the biggest hit in history, as the bill from climate change accelerates at an exponential rate, a $15.2 billion underwriting loss in 2023, double that in 2022.
TRADE SHEET
Stocks – buy the next big dip
Bonds – buy dips
Commodities – stand aside
Currencies – sell dollar rallies, buy currencies
Precious Metals – buy dips
Energy – avoid
Volatility – sell over $30
Real Estate – buy dips
NEXT STRATEGY WEBINAR
August 28 from Lake Tahoe, Nevada
Recording of Jacquie’s Post July 31, 2024, Zoom Meeting
(CONSUMER BEHAVIOUR AMID RECESSIONS: WHERE DOES THE MONEY GO?)
August 14, 2024
Hello everyone.
Which would you most likely give up if a recession descended upon us?
Netflix
Fast food including Chipotle, McDonalds, Burger King, Taco Bell, In-N-Out Burger, Baskin-Robbins, etc
Your favourite coffee fix
None of the above
If it was me, and I had to choose one, apart from d) it would be fast food.But then, that would be easy for me, because I don’t eat it in the first place.So, I’m cheating a little in that sense. So, my second pick would be my coffee fix.Again, easy, as I am a tea drinker and prefer to make a pot of tea in the morning or (grab a teabag if I’m in a hurry).
If we are not going to eat out, and are not getting our coffee fixes, then where would our discretionary dollars be going?
Many will find comfort in media options.And Netflix comes to mind here.
How many people have not spent a lazy day binge-watching their favourite series or rewatching old movies?
Netflix may turn out to be a stalwart stock against a backdrop of recessionary dark clouds building up on the horizon.Analysts at J.P. Morgan believe the service provides good value, even with their latest price increases.Capex is expected to come in around $ 17 billion this year, and JPM has an overweight rating on the stock.Their price target of $750 indicates around 18.5% upside potential from Monday’s close.From the beginning of this year, the stock is almost 32% higher.
Following its second-quarter earnings announcement on July 18, Netflix shares are trading only around 2% lower, compared with the S&P 500 which is down around 4% over the same period. Of note, in the second quarter, Netflix reported a 34% yearly increase in its ad-supported memberships, and total memberships topped analysts’ forecasts.JPM analysts regard subscription services like NFLX and SPOT as “being more resilient during periods of macro pressure.”
Netflix is positioned well as it targets 500M+ global (connected TV) households.
Spotify has also been a strong performer this year, with shares up 80% year to date.
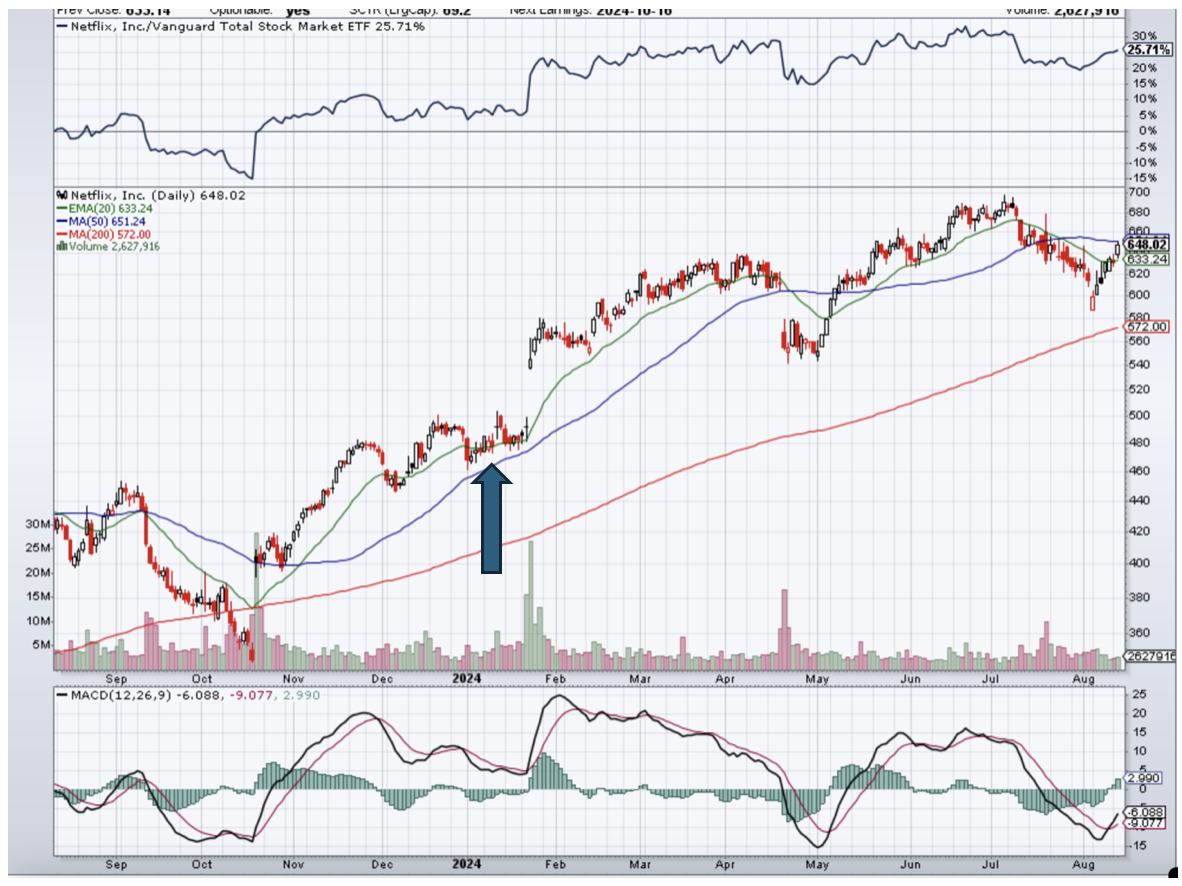
Netflix (NFLX) Daily chart
I recommended Netflix (NFLX) on January 17, 2024, when it was $480.
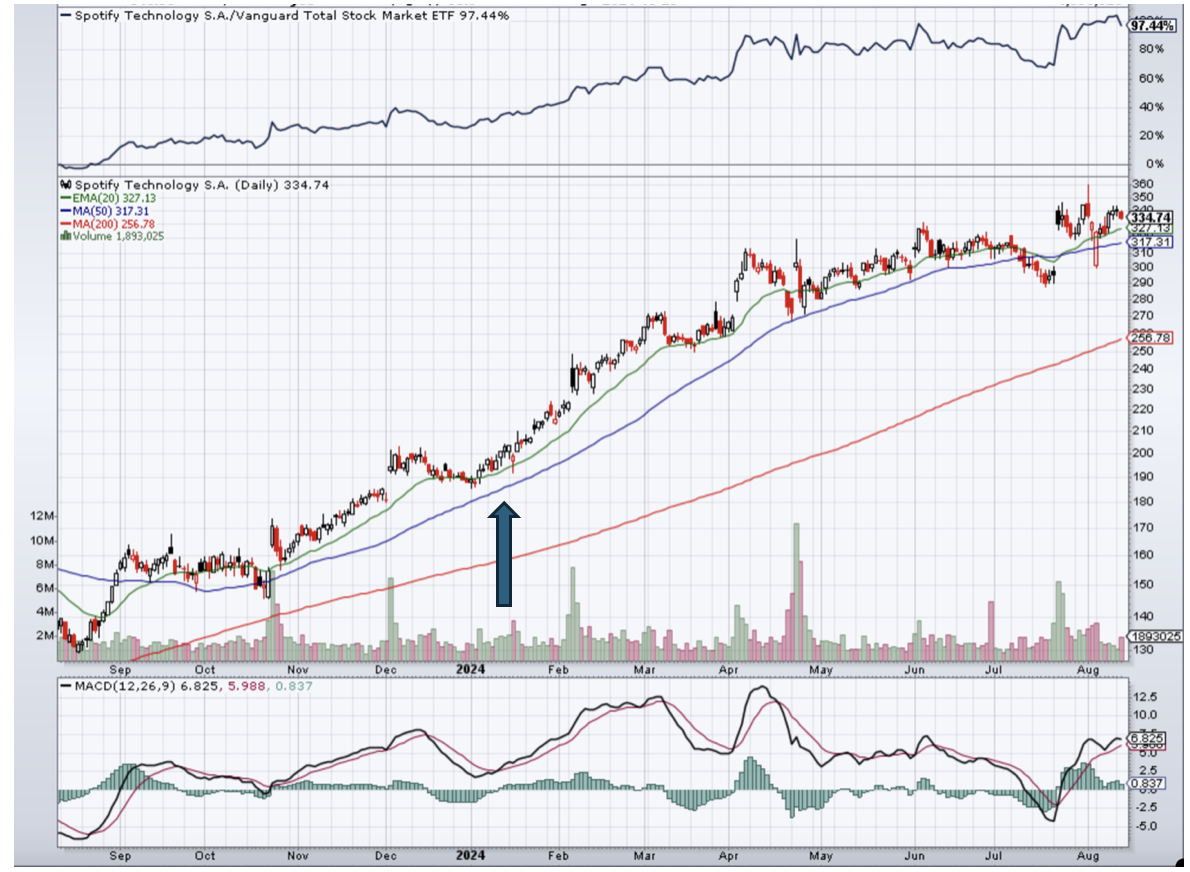
Spotify (SPOT) Daily chart
I recommended Spotify (SPOT) on January 7, 2024, when it was $193.52
I am not suggesting you buy at this time or add weight.
SOMETHING TO THINK ABOUT…
In a recent talk the Private Wealth Group of Wells Fargo Advisors offered comments on investing.Here are a few takeaways.
“What we can learn from history is that people don’t learn from history.”
“All this creates a lot of short-term thinking in the markets.They become focused on what is in the news, and money drives toward these companies and industries, it’s during this time that investment principles are forgotten.”
Their thoughts on the media are interesting.(In the 1980’s, I don’t recall any financial media channels.CNBC was founded on April 17, 1989, two years after the 1987 crash. It was originally the Consumer News and Business Channel, a joint venture between NBC and Cablevision).
Getting back to their ideas…
Tuning out the headlines to stay focused on the long term.
“People get caught up in what’s going on in the news and what the media is talking about.A lot of people are working from home.They have got the TV on.If you watch any of the financial news networks, there’s not that much news every day.They just keep talking about the same thing over and over and over again.And people hear that, and they stick with it and then it becomes real to them, and all their investing principles and history is gone by the wayside.”
Volatility in the US markets early last week moderated by Friday.Monday saw the biggest volatility shock in equities since the onset of the pandemic.Forex markets experienced similar volatility, with an initial flight to “safe haven” currencies like JPY and CHF, followed by a stabilization in USD as markets recovered.USD traders are now looking to Wednesday’s CPI inflation data release, where headline inflation is expected to dip into the 2% range for the first time since 2021. A sharp decline in this data could reignite recession fears, similar to July’s employment report, as traders worry the Fed has waited too long to begin cutting interest rates.
UK data, including employment, inflation, and GDP figures will be closely watched by traders.
MARKET UPDATE
S&P500
Upside potential ahead, but it could be choppy.We could argue that an Elliott Wave 4 has now been completed and that this could signal the resumption of an uptrend and advance on to new highs for the year.
Resistance = 5450/5470 area.If we see a break above these levels then we can see the market rallying toward 5, 570/5,670 area.
Support = 5,200/5,110.If these levels give way, risk reverts to the downside, and we will be eyeing the key 4,950 support area of April 19.
GOLD
Uptrend is in progress, but momentum has slowed.
We should be watching the support level of $2,365/$2,360 area.If this level is broken, then we may see a corrective sell-off back toward the $2,290/$2,275 area.
If the market is able to rally through the $2,500 level, then there is potential for the metal to rally to around $2,550, en route to $2,670.
BITCOIN
It is not yet certain whether Bitcoin has completed its corrective structure from its mid-March peak of $73,794 to last week’s low of $49,577.There could still be a lot of churn.It is possible that we could revisit the lows of last week (or close to it) or even around the $40,000 level before a new bull rally begins, and we move out of this corrective structure.It could be September/October before we see any significant rally in Bitcoin.
QI CORNER
PSYCHOLOGY CORNER
BE PATIENT AND DON’T OVERTRADE
If most traders would learn to sit on their hands 50 percent of the time, they would make a lot more money.”(Bill Lipschutz)
The lesson we can take away from Lipschutz’s quote is the importance of the art of patience.A very common mistake for beginner traders, eager to make a quick profit, is to overtrade.This, inevitably, always leads to increased losses.
Devise a trading strategy/plan and stick to it.Be patient and disciplined and only enter trades where your predetermined conditions have been met.In this way, you can be sure to avoid many unnecessary losses.
Bill Lipschutz, unfortunately, learned this lesson the hard way, He began his trading career as a student, after receiving an inheritance of stocks with a value of $12k.He liquidated these stocks, began trading with the funds, and managed to turn them into $250k.
However, his early success was short-lived.A poor trading decision caused him to lose it all.But he did not give up.This is another lesson we can take from Lipschutz.He continued trading and upon graduation, he joined the Foreign Exchange Department at Salomon Brothers, where he went on to earn an average of $300 million a year for the firm.He is now the Director of Portfolio Management at Heathersage Capital Management, which he co-founded.
(DON’T GET TOO COMFY – MORE CHOP & CHURN IS ON THE HORIZON)
August 9, 2024
Hello everyone.
ARE WE THERE YET?
Historically, it is rare for markets to put in correction lows in August.September and October are more likely to see an eventual bottom.So, be ready for equity market volatility in September.
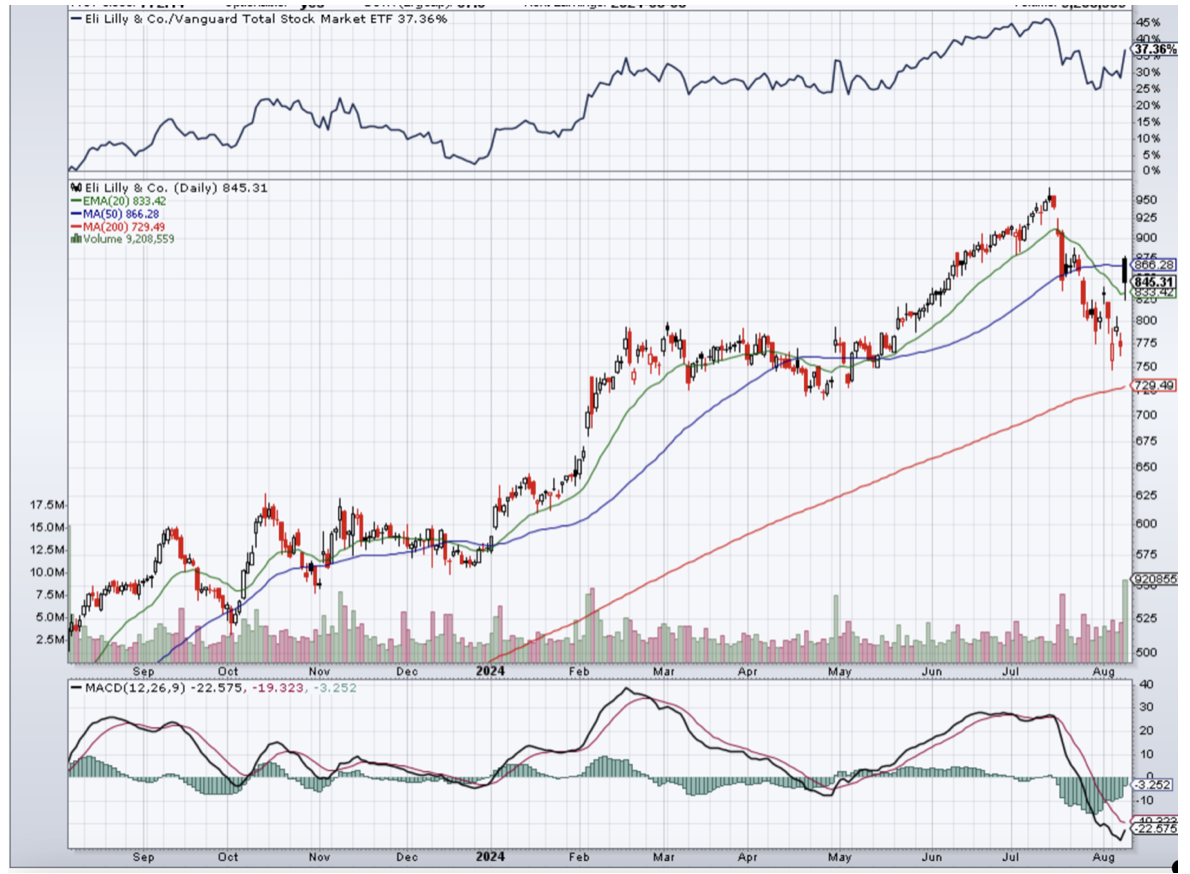
ELI LILLY(LLY)
Eli Lilly reported impressive second quarter earnings.Mounjaro, a prescription medication for Type 2 diabetes, and Zepbound, a prescription medicine for weight loss are two drugs by Eli Lilly seeing incredible demand.In its first full quarter in the U.S. market, Zepbound brought in $517.4 million in revenue.In the second quarter, it generated $1.24 billion in U.S. revenue.
Obesity affects nearly 42% of adults in the U.S. according to the latest data from the Centres for Disease Control and Prevention.
The demand for weight loss drugs in on the rise around the world.The global market for obesity medication is expected to hit $105 billion in 2030, according to Morgan Stanley’s research.That’s up from the firm’s forecast in September of $77 billion.
Drug manufacturers like Eli Lilly and Novo Nordisk, the pharmaceutical company that makes Ozempic and Wegovy, are racing to meet that demand.Both companies are investing billions to build new manufacturing plants to boost supply of the popular medications.
Eli Lilly was founded in 1876 and became a publicly traded company on the New York Stock Exchange in 1952.
$1000 invested in Eli Lilly 10 years ago would now be worth $13,143, an estimated percentage increase of 1,214%.
The lesson here is don’t try and attempt to use a company’s short-term performance to predict how well or how poorly it may do in the future.There will always be market fluctuations.The key is to stay the course and let the growth narrative unfold over time.
This is an item of interest, not a suggestion to buy (LLY) right now.But (LLY) is an excellent stock to hold for the long term.
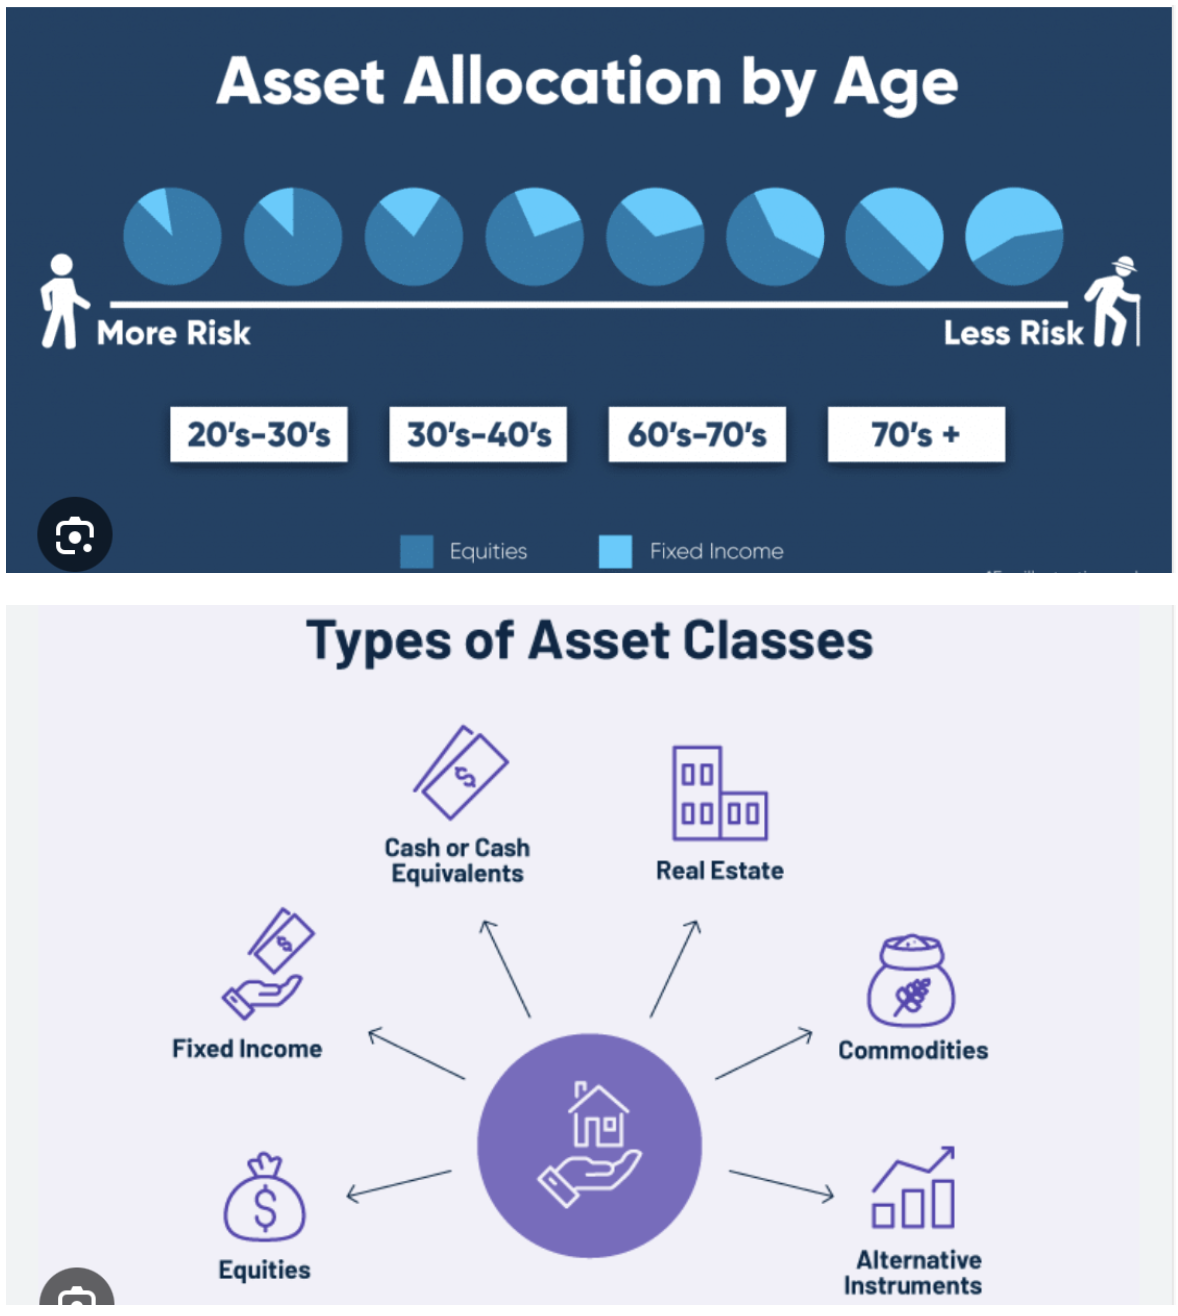
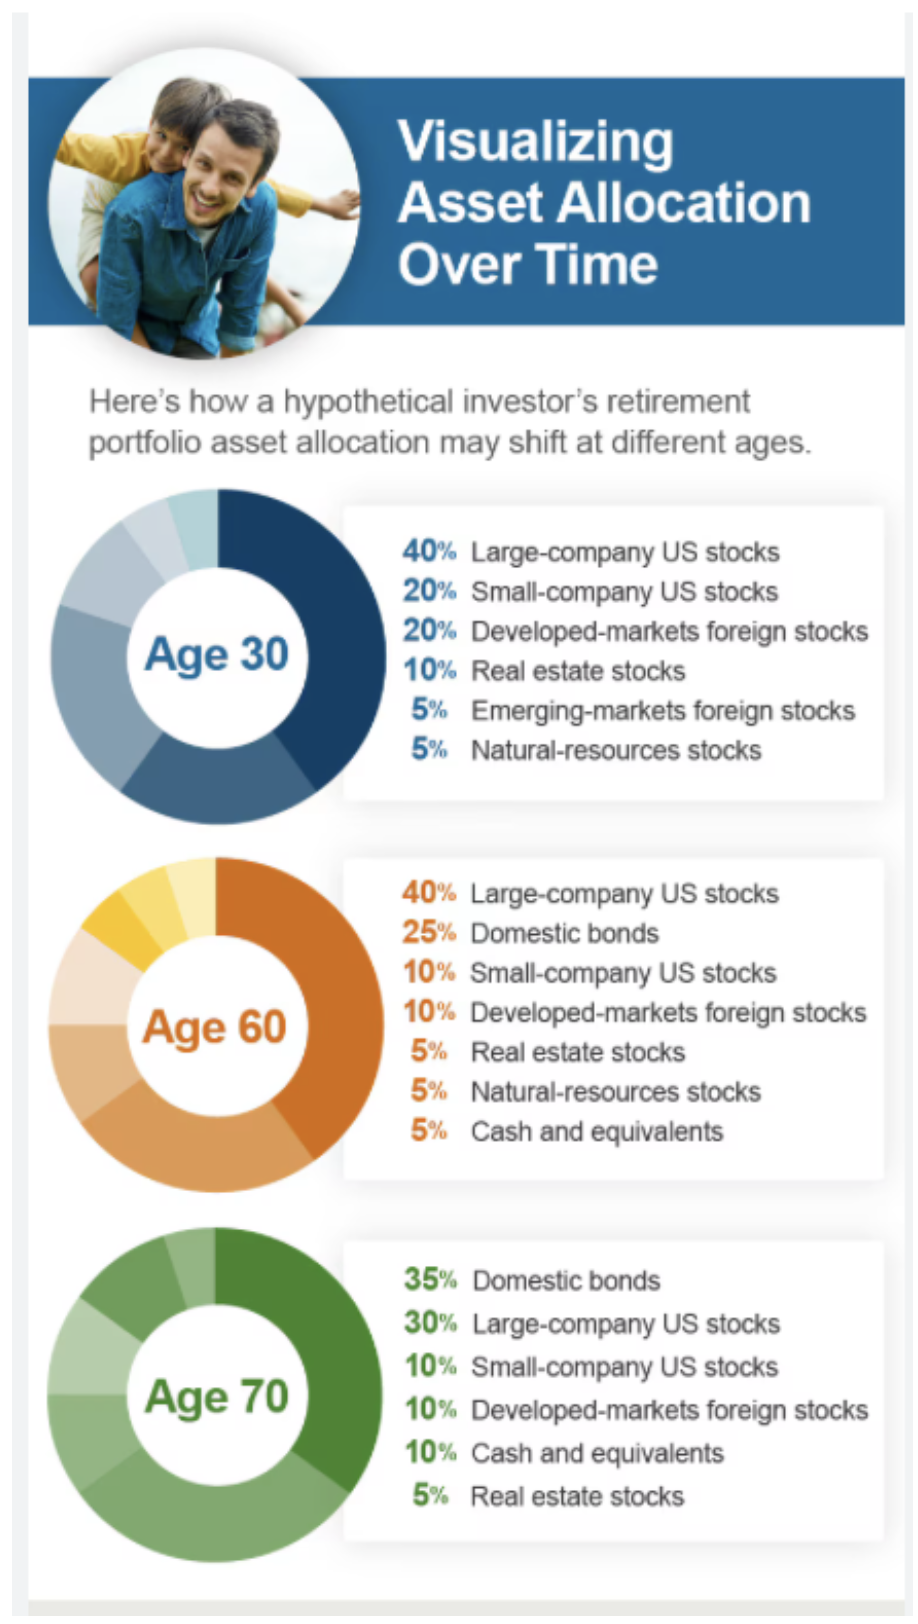
WHAT SHOULD MY PORTFOLIO LOOK LIKE?
An illustration of asset classes and allocations by age.
It is different for everyone.
So, one example does not fit all.
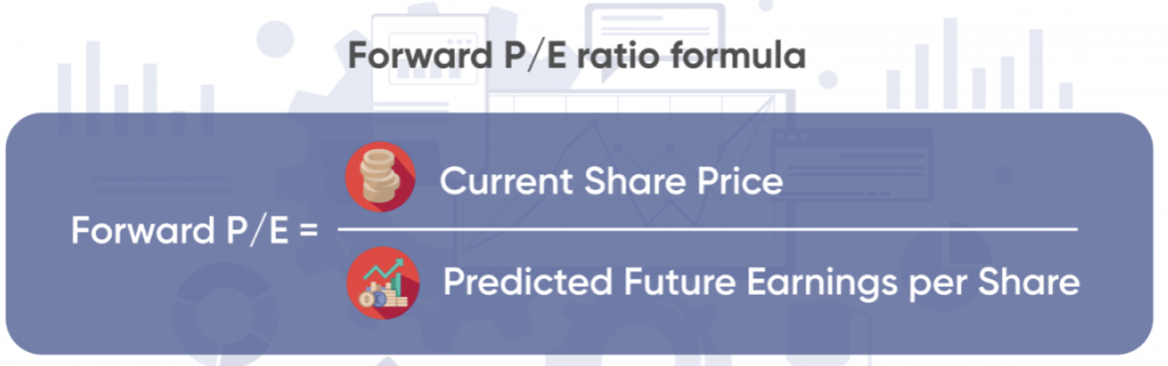
WHAT IS… FORWARD PRICE/ EARNINGS RATIO?
The forward price/earnings ratio is a measurement of value.It is found by dividing a stock’s most recent price by next year’s earnings per share estimate for the entire year.If that estimate is unavailable, then the estimate for the full current fiscal year is used.
For a better understanding of what forward price-to-earnings means, let’s look at an example.Let’s say a company’s current stock price is $25.Analysts estimate an EPS of $1.50 for the next quarter.Its forward P/E ratio would be 25/1.5=16.
Difference between forward P/E and trailing P/E
The main difference between standard P/E and the forward price-to-earnings definition is that the former uses actual EPS that has already been reported by a company, whereas the latter uses the EPS estimate.
The standard P/E is used to evaluate whether a company is overvalued or undervalued, whereas forward P/E ratio determines future estimated value.
Let’s look at an example.If the current price of a stock is $8 with the EPS of $1, and its earnings are expected to double in the next year to $2, the forward P/E ratio will be 4x, or half of the company’s value when it earned $1.
If the forward P/E is lower than the current P/E, analysts expect earnings to increase.On the other hand, when the forward P/E is higher than the current P/E ratio, analysts expect earnings to decrease.
(STAY COOL IN THE FACE OF A TURBULENT MARKET & START LOOKING FOR OPPORTUNITIES)
August 7, 2024
Hello everyone,
The market has been throwing a little tantrum over the last few days, and we all know why.
Unwinding of the yen carry-trade
Economic market data
The Fed turning up to the party with no rate cuts.Late again Mr Powell…
AI over-exuberance
Today, Tuesday, we saw some calmer waters, but the stinger is that more volatility may be yet to come.We are waiting for a signal that the bottom is formed in this correction.
YEN CARRY TRADE
What an epic unwinding of the yen carry trade.Are we done or is there more to come?
A few investment bank analysts are indicating more unwinding is yet to happen.
What is the Yen carry trade?
Investors borrow from low-interest economies like Japan to invest in higher-yielding assets elsewhere.The strategy hit turbulence when the Bank of Japan raised interest rates last week, prompting a surge in the yen and a rush for the exits by some investors.This move led to significant losses in global stock markets, with Japan’s Nikkei suffering its worst day since 1987.
HIGHER INFLATION IN THE YEARS AHEAD
It won’t matter who wins the Presidential election in November in relation to the markets.Both parties favour large deficits despite a strong economy.The federal debt is now at $34.5 trillion, or about $11 trillion higher than where it stood in March 2020.As a portion of the total U.S. economy, it is now more than 120%.Debt has soared under Biden after Trump’s aggressive spending response to the pandemic increased the levels.
HEADLINES CORNER
Gov. Tim Walz gets the nod to be Democratic running mate beside Harris.
Reserve Bank of Australia keeps rates steady at 4.35%.
WHERE TO ADD WEIGHT (Scale in over time)
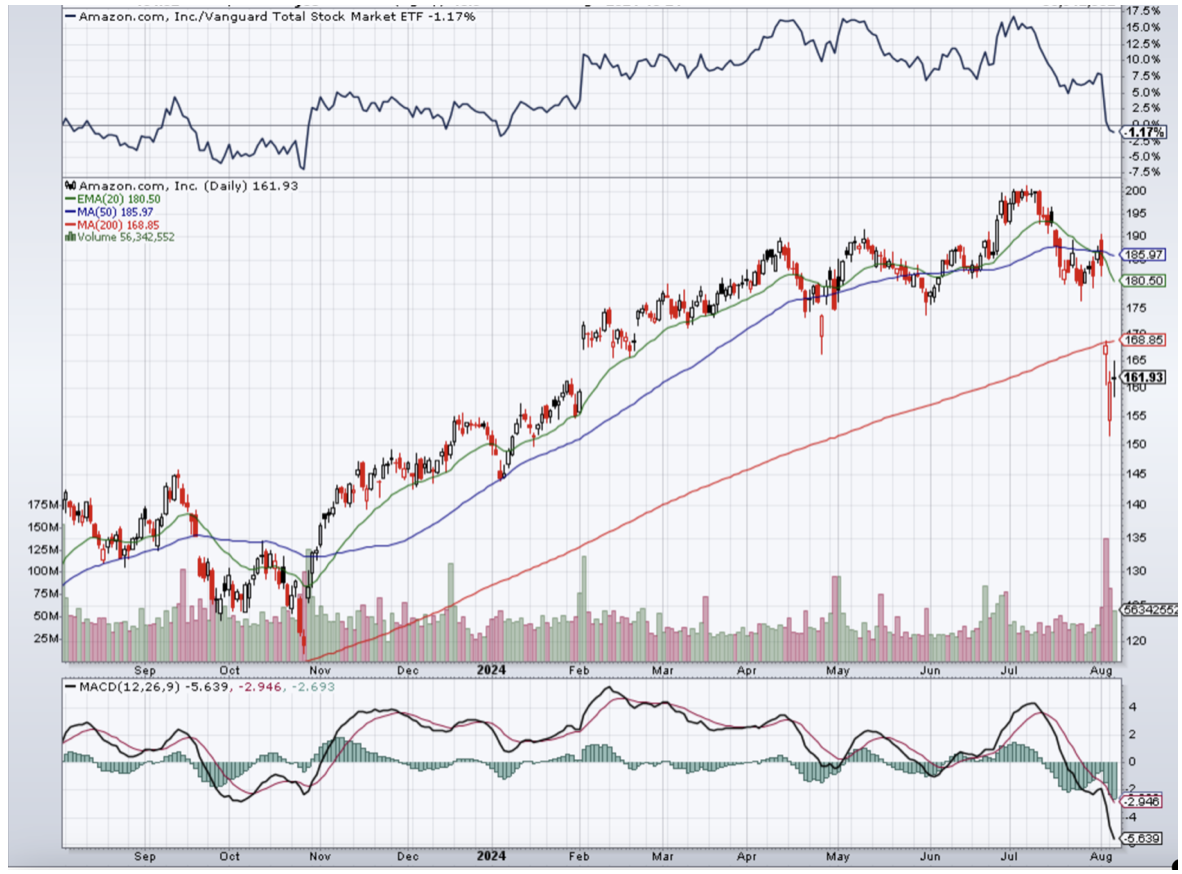
Amazon
Stock trades at just under 30 times expected earnings for the next 12 months.
E-commerce business continues growing & remains competitive.
Grew advertising revenue 20% in the second quarter.
Cloud sales rose 19%, driven by artificial intelligence products.
Spending should remain in check in relation to revenue growth, so profit margins should expand.
Wall Street expects EPS to grow about 37% annually through 2026 from this year. (FactSet)
Amazon Daily Chart
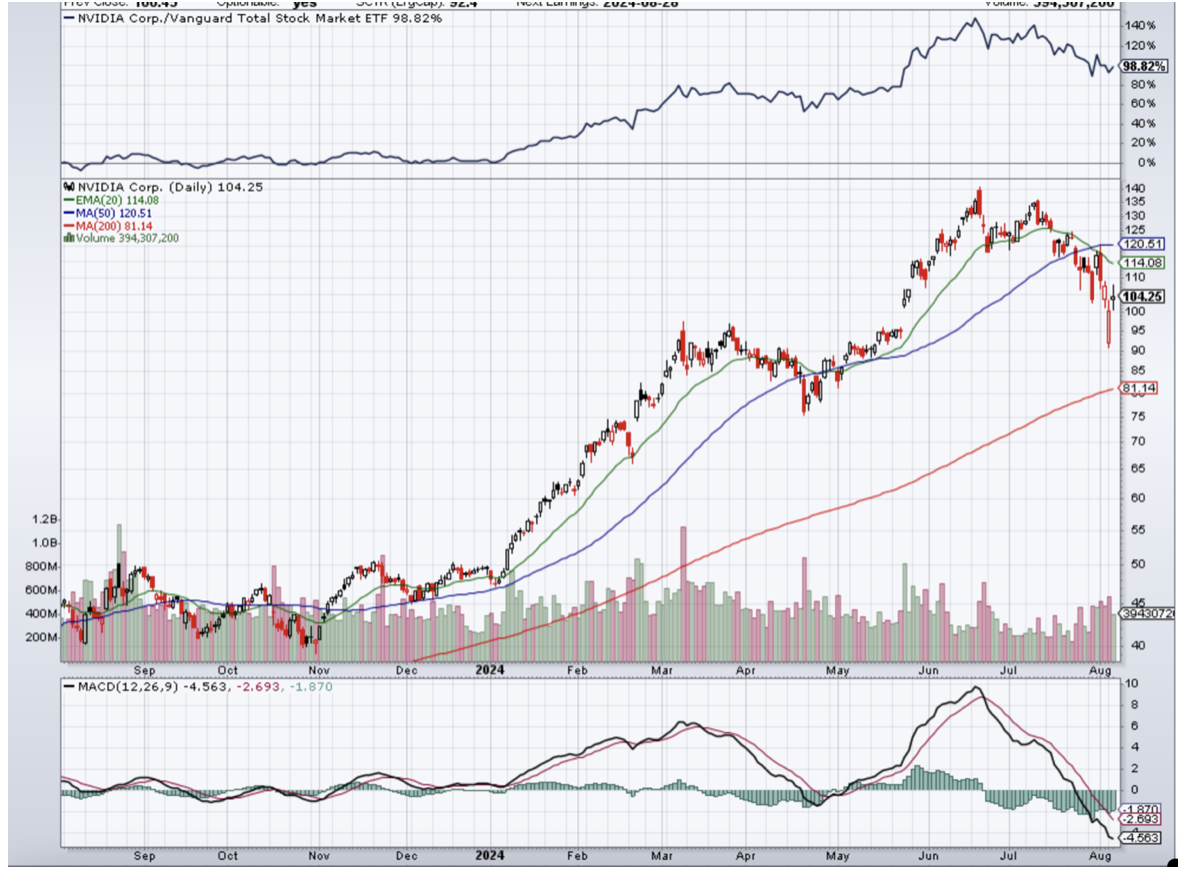
Nvidia
Analysts expect stock to reach over $100 billion in revenue this year.
Total sales of $115 billion for 2024 appear realistic.
Earnings per share (EPS) estimate of $2.59 has not changed.
Considering all the above, NVDA could be on track to grow to the expected $3.66 next year.
Stock trades at 28 times expected 2025 earnings per share.
Nvidia Daily Chart
CRYPTO CORNER
If you have been watching this area, you saw that Bitcoin dropped below $50k briefly on Monday to around the $48k area.All these corrective selloffs are scale in days, if you are interested in Bitcoin and the crypto space.With institutional adoption only increasing and political parties shifting their stance toward crypto indicating a warmer embrace of the asset, this could be an opportune time to add exposure to bitcoin ahead of what could be excellent returns over the coming year and beyond.
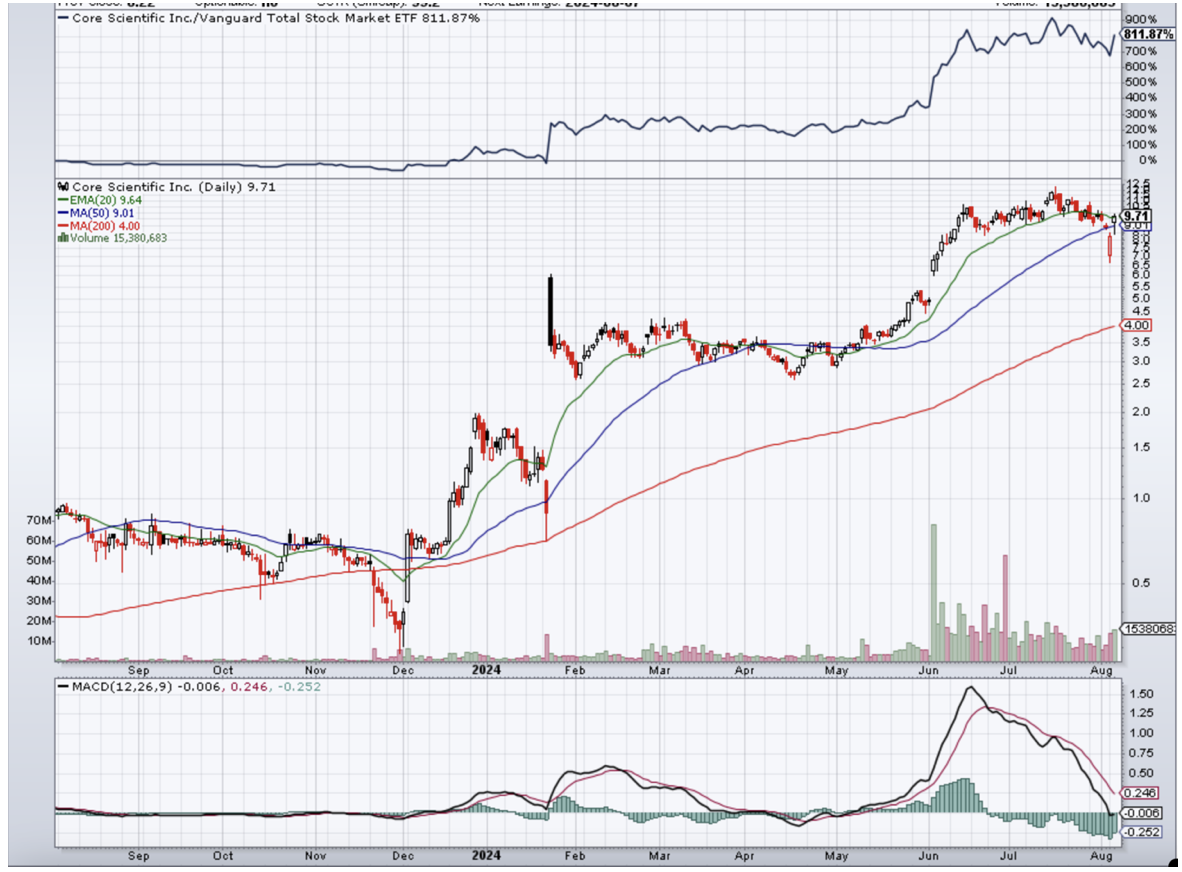
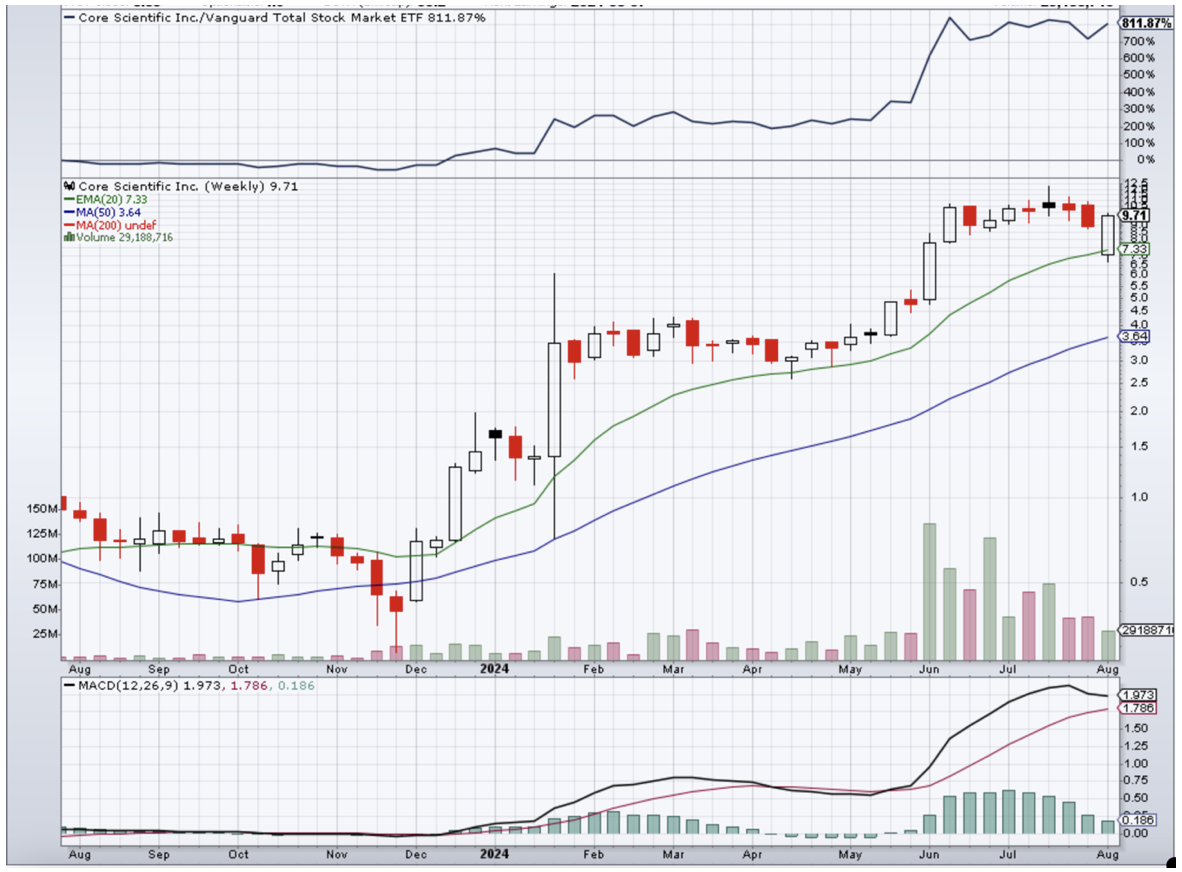
For those who are interested in Bitcoin miners, there are about a half dozen recommended by analysts.Of these, there is just one I would give my attention to.Core Scientific (CORZ). ($9.71)
Core Scientific turned down an offer from the cloud AI startup CoreWeave to acquire them for $5.75 per share. It is believed that the bid is higher now and that the deal will increase considerably in the coming months. Some analysts, including Cantor Fitzgerald, have a $20 price target on the stock, implying about 143% upside.(Note: our only crypto exposure is MicroStrategy).
There is a very high degree of risk involved in trading. Past results are not indicative of future returns. MadHedgeFundTrader.com and all individuals affiliated with this site assume no responsibilities for your trading and investment results. The indicators, strategies, columns, articles and all other features are for educational purposes only and should not be construed as investment advice. Information for futures trading observations are obtained from sources believed to be reliable, but we do not warrant its completeness or accuracy, or warrant any results from the use of the information. Your use of the trading observations is entirely at your own risk and it is your sole responsibility to evaluate the accuracy, completeness and usefulness of the information. You must assess the risk of any trade with your broker and make your own independent decisions regarding any securities mentioned herein. Affiliates of MadHedgeFundTrader.com may have a position or effect transactions in the securities described herein (or options thereon) and/or otherwise employ trading strategies that may be consistent or inconsistent with the provided strategies.