Markets suffered a jolt early in the week after the January inflation report showed stubborn inflation is a thorn in the side for the Fed.So, the question is not only when the Fed will cut rates, but by how much.March is definitely off the table, as is May.We were all expecting June to be the month we could see the Fed cutting, but let’s not write it in ink yet.
So, markets are off their highs.Will that pullback continue?In the short term – I believe so.
The Chinese New Year is celebrated from the 10th to the 24th of February, and we are in the Year of the Wooden Dragon.
U.S. dollar – there is more upside ahead for the dollar.Therefore, we will see further downside in the Euro, Aussie dollar, Kiwi and the metals.
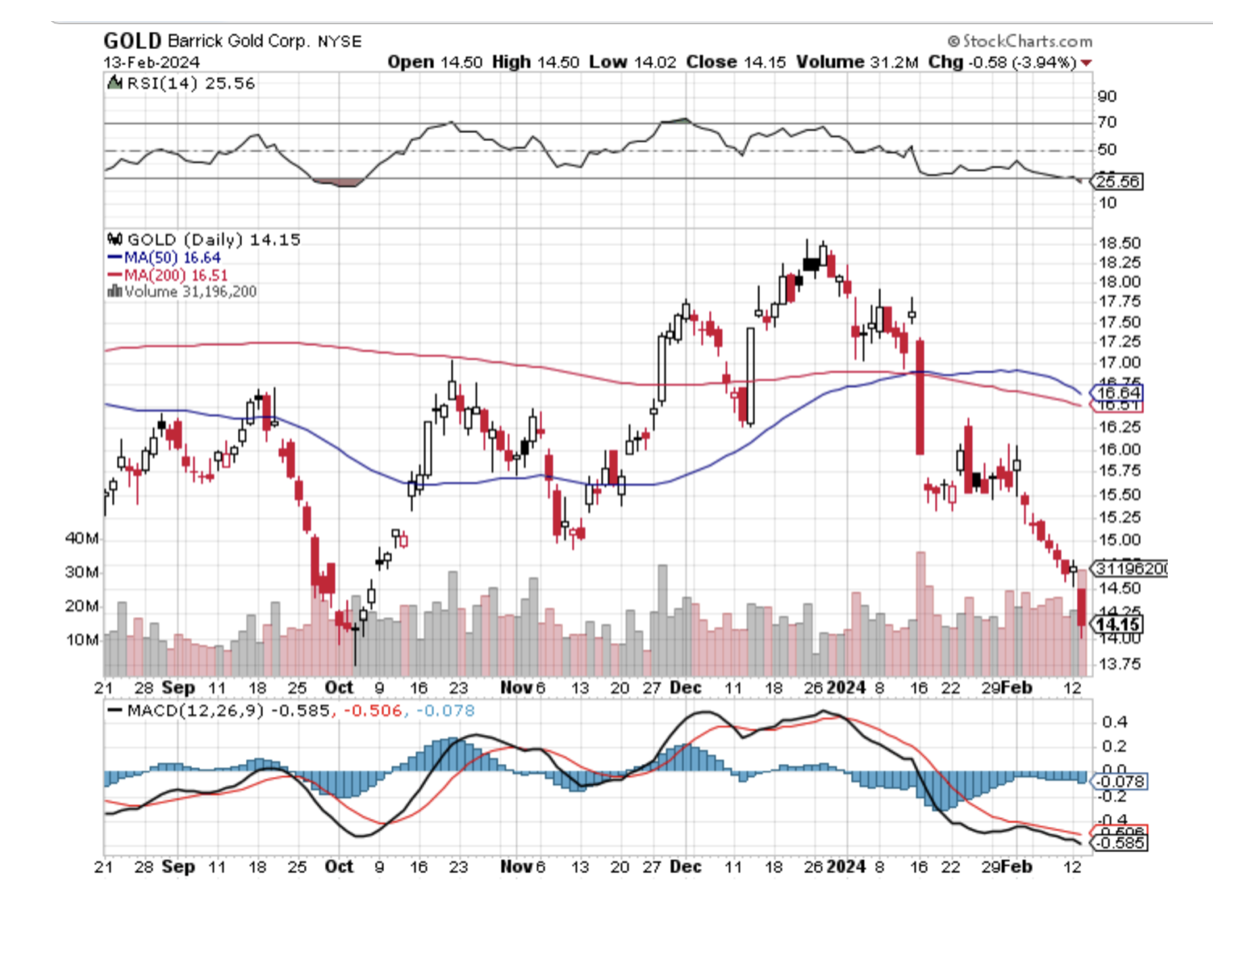
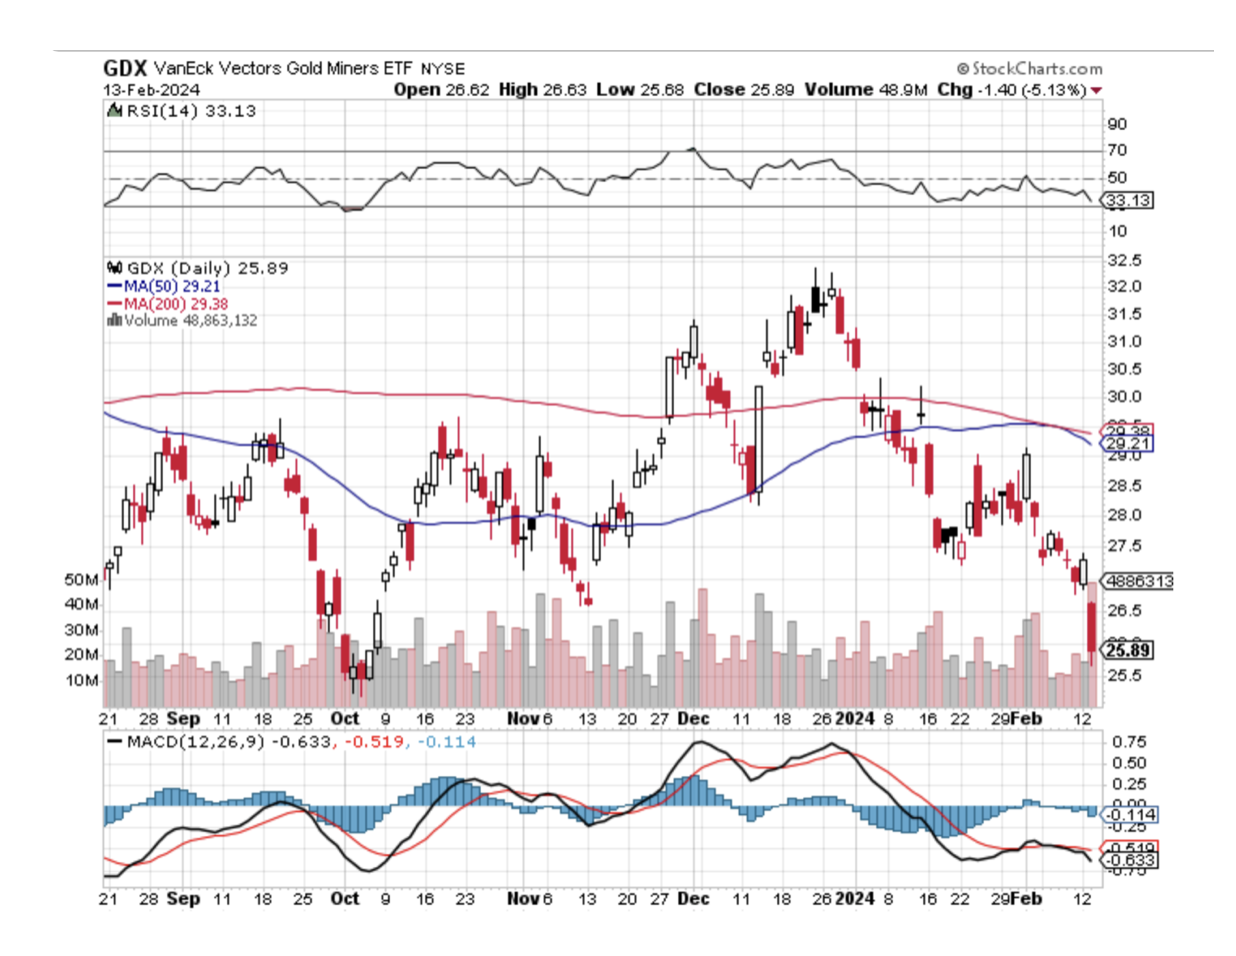
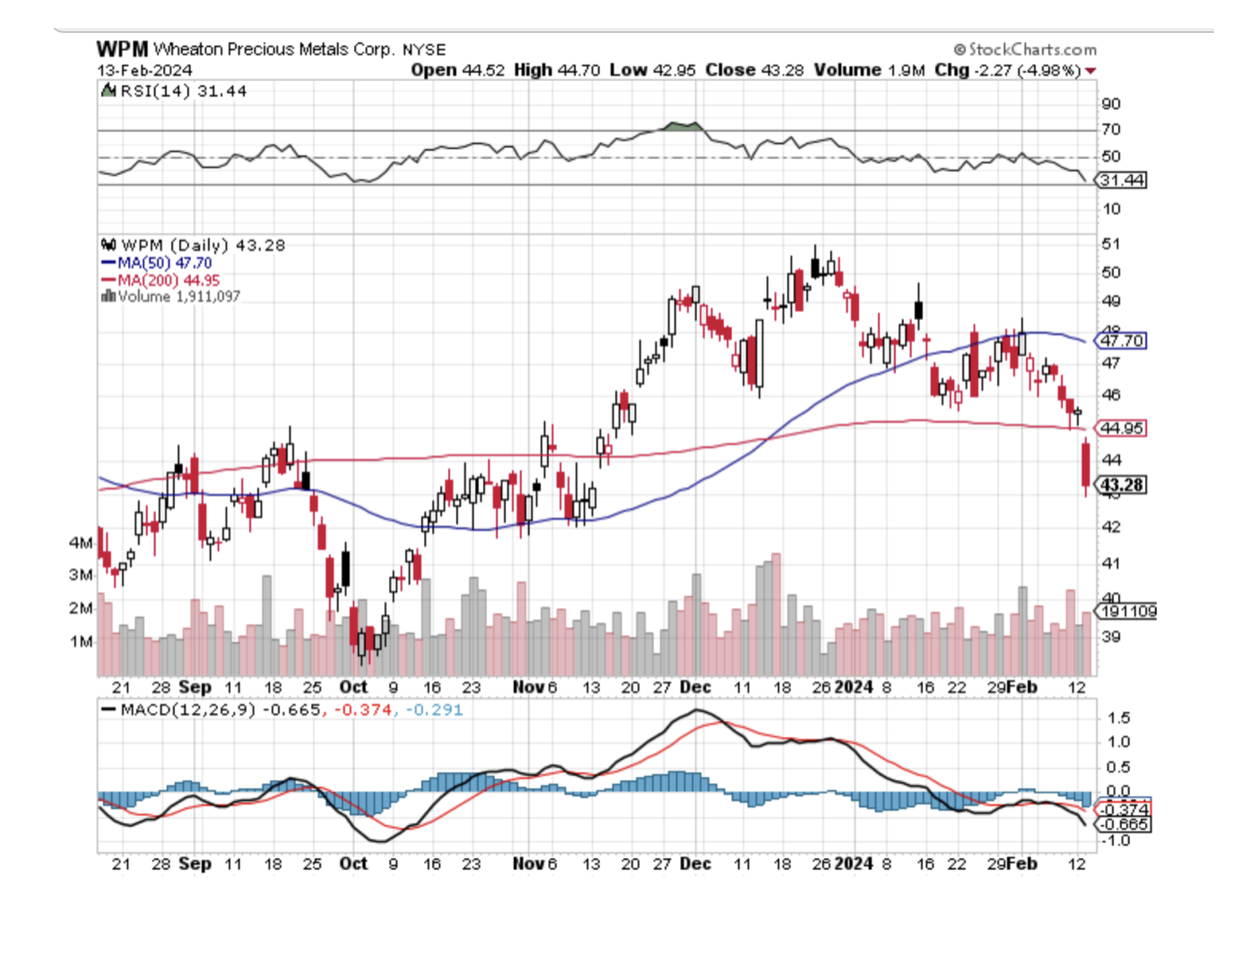
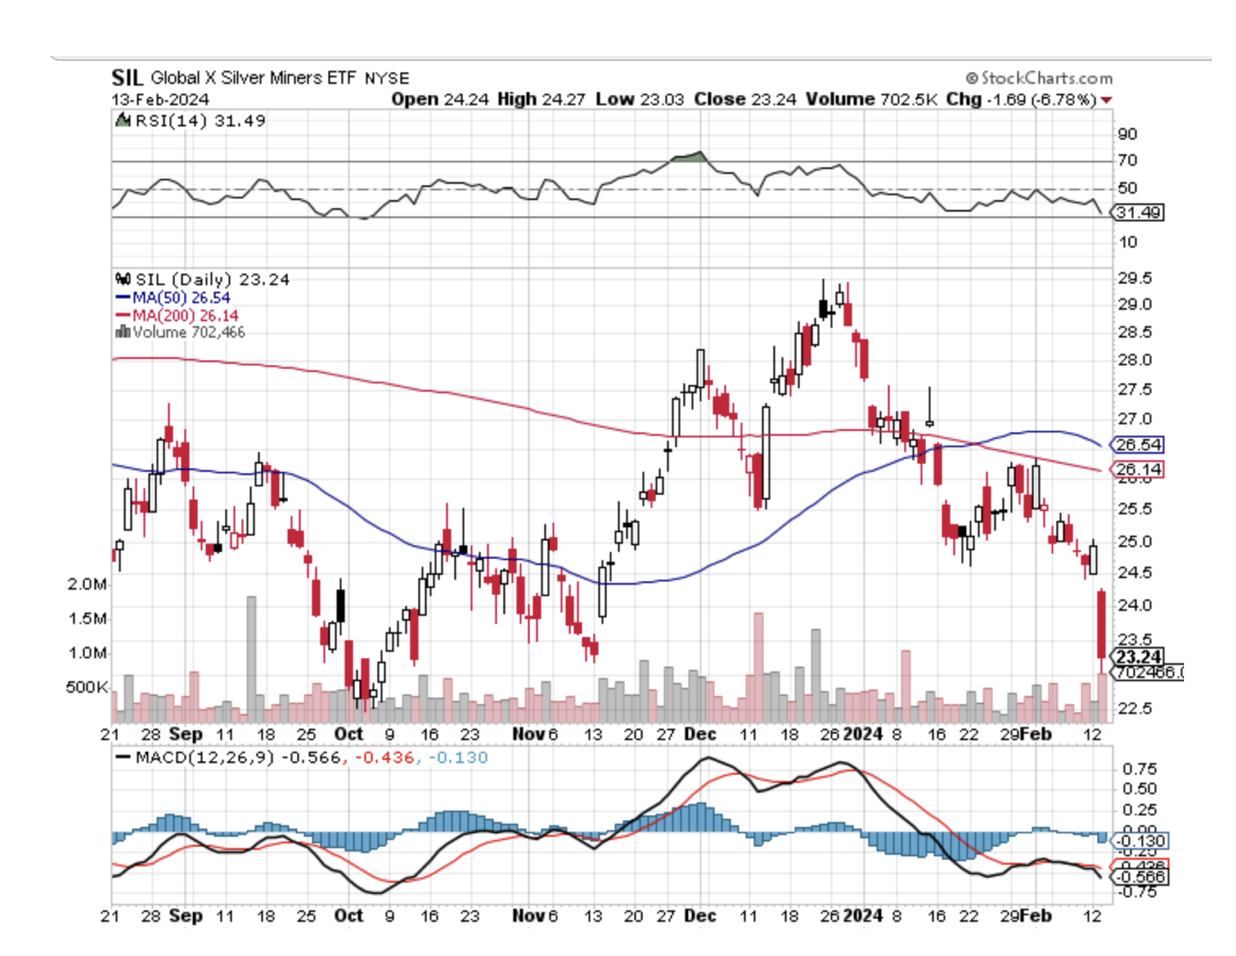
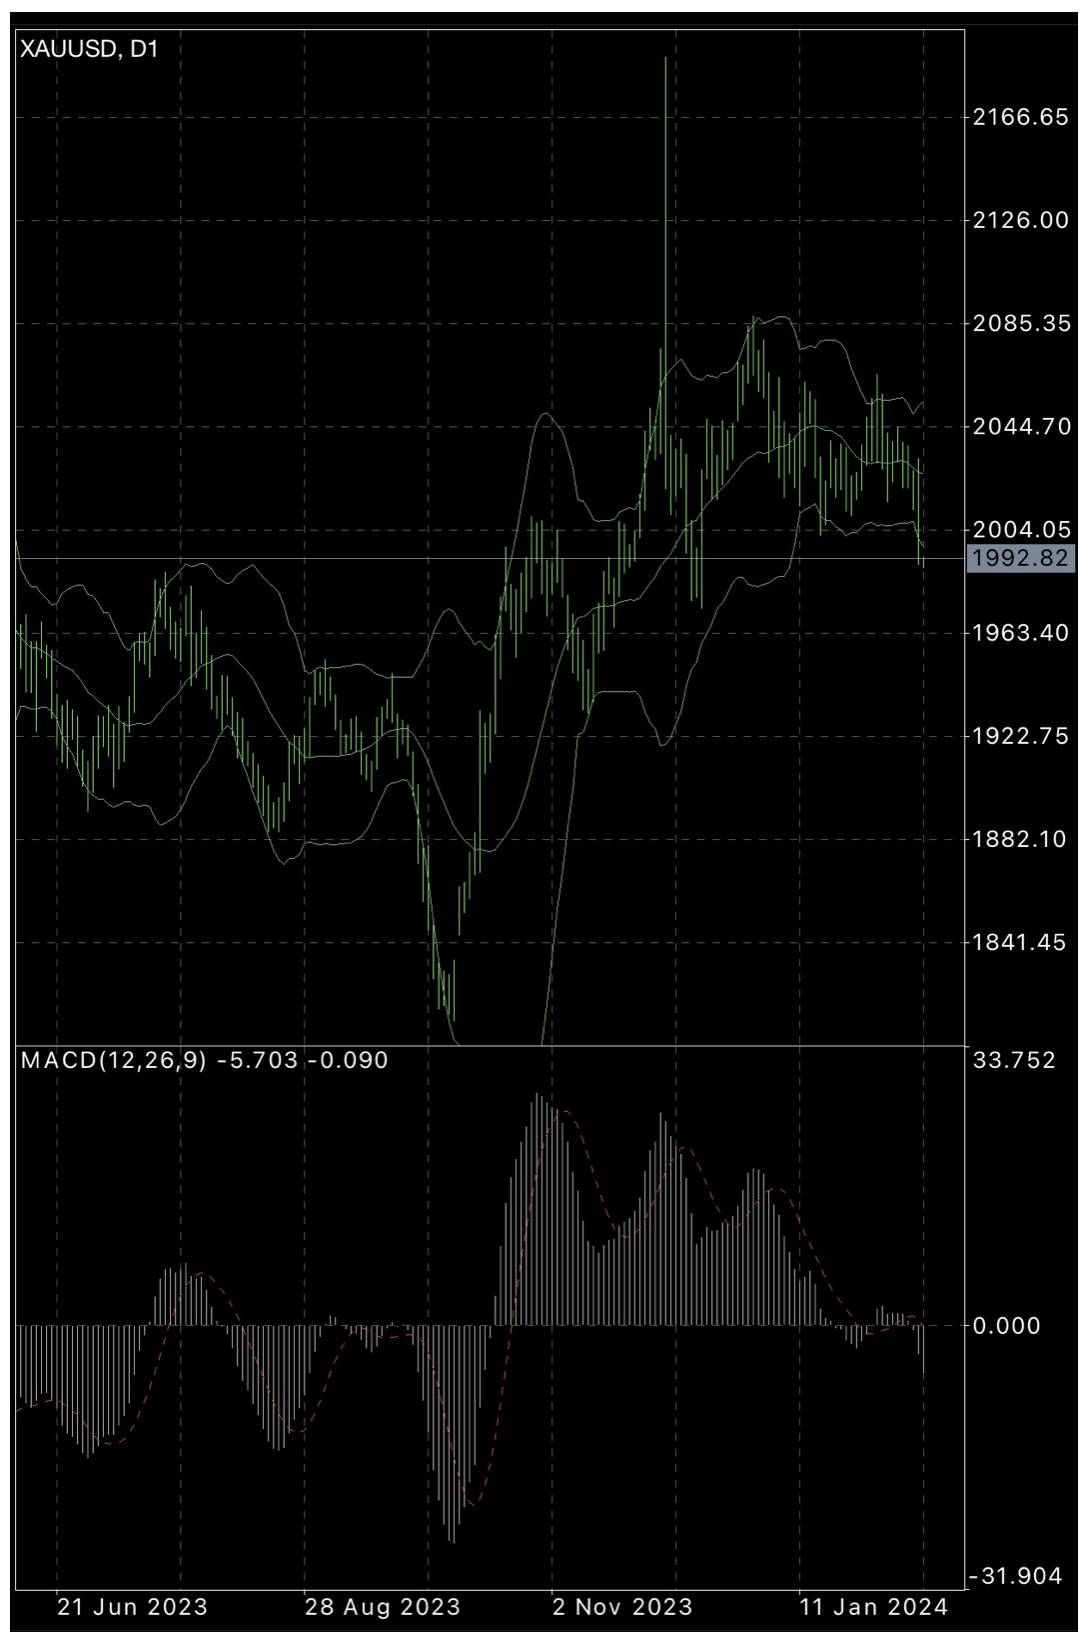
Gold – as the dollar moves up gold will continue to correct.This is the time to be accumulating positions in Gold.Keep averaging into stocks (GOLD), (GDX), (WPM), (SIL), (SLV) and building more out-of-the-money LEAPS positions in GOLD and other stock positions.
Spot gold 1951 – 1965 is a very good purchasing area in gold.Keep buying all the way down to this zone in Gold.
After these lows we are headed up to new highs.
Daily gold spot chart
Look for targets in gold at levels 2191, 2370 and 2547.
Gold defends against inflation and market corrections.
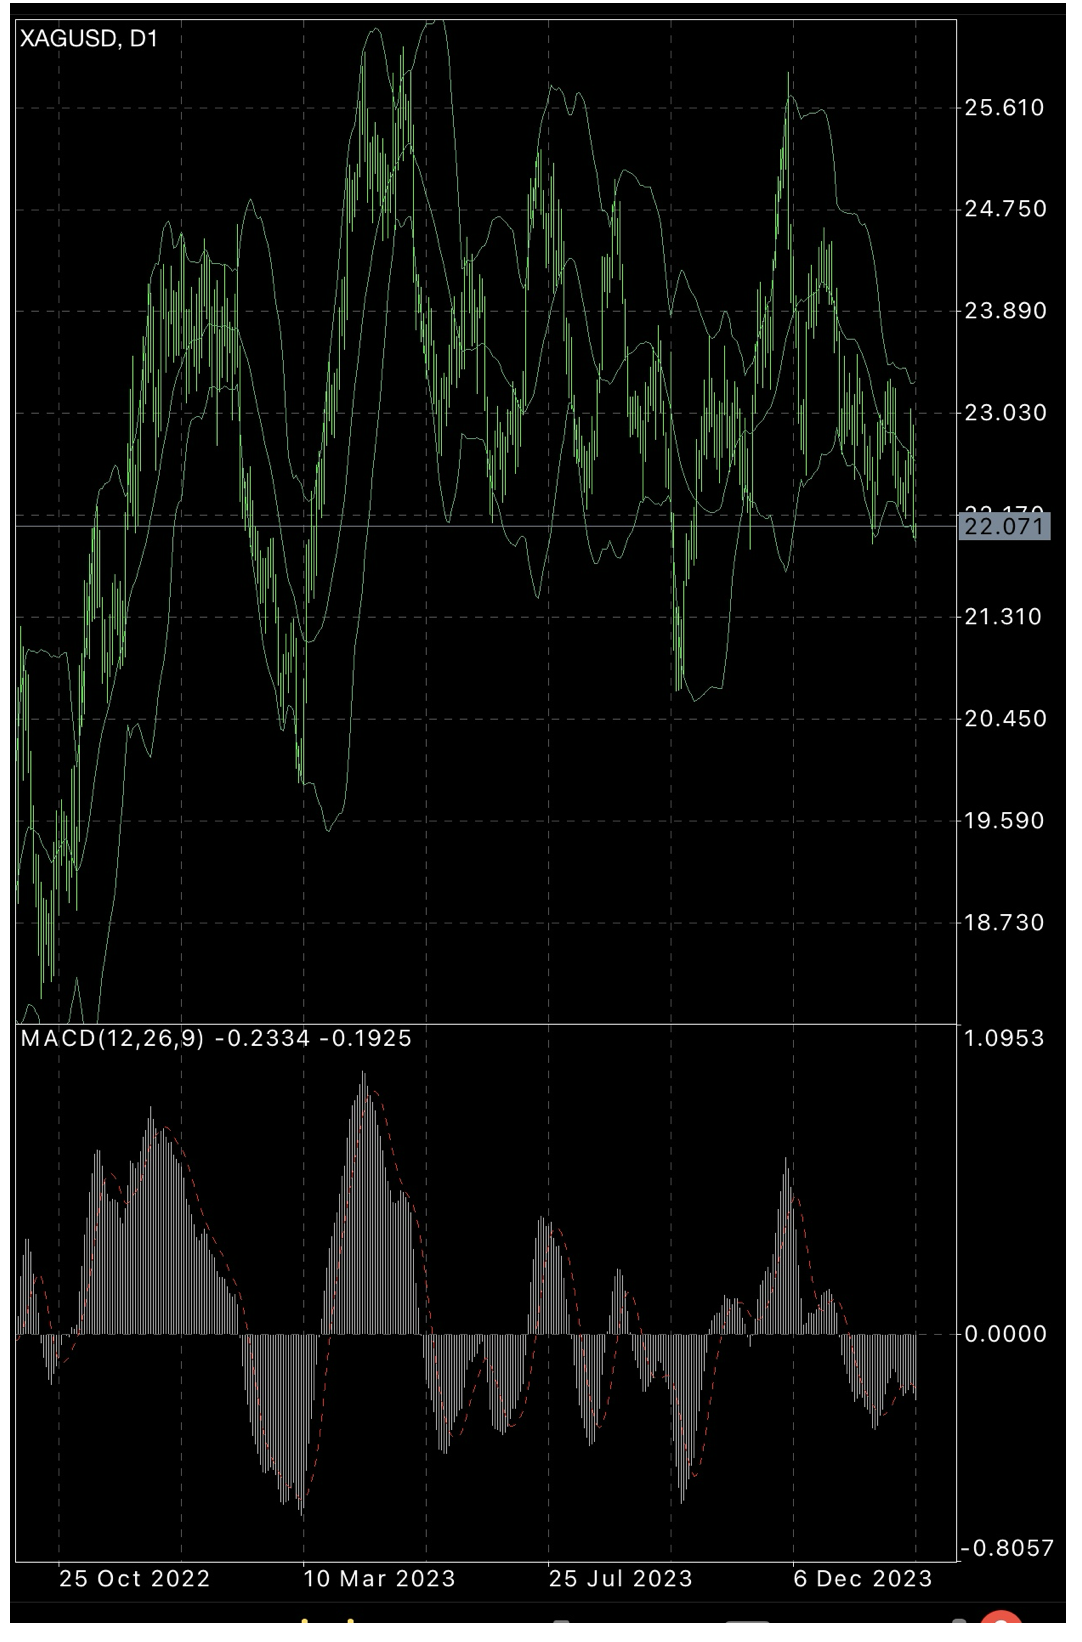
Silver – like gold, expect more weakness.Spot silver 2068 – 2100 = strong buy territory.
Daily spot silver chart
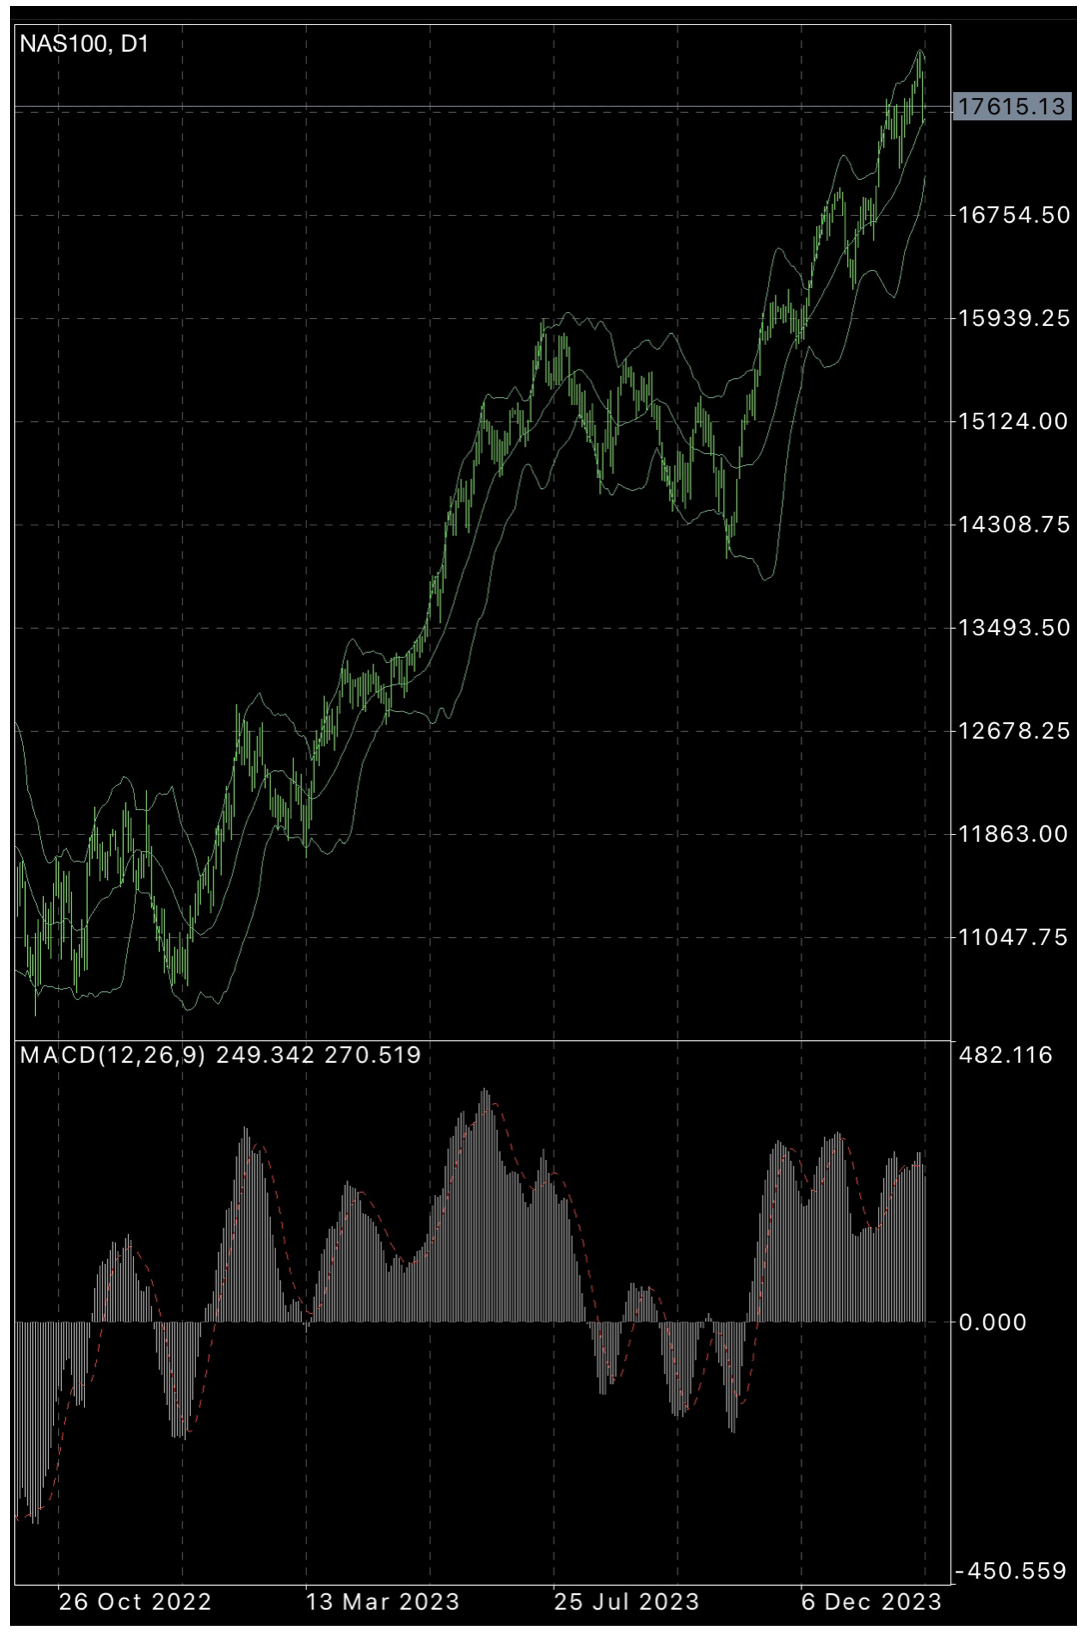
Nasdaq – we hit 18,000 and almost immediately the market turned on its heel.
Next support levels are 17407 and 17140.Strong support line at 16774.
Nasdaq 100 Daily chart
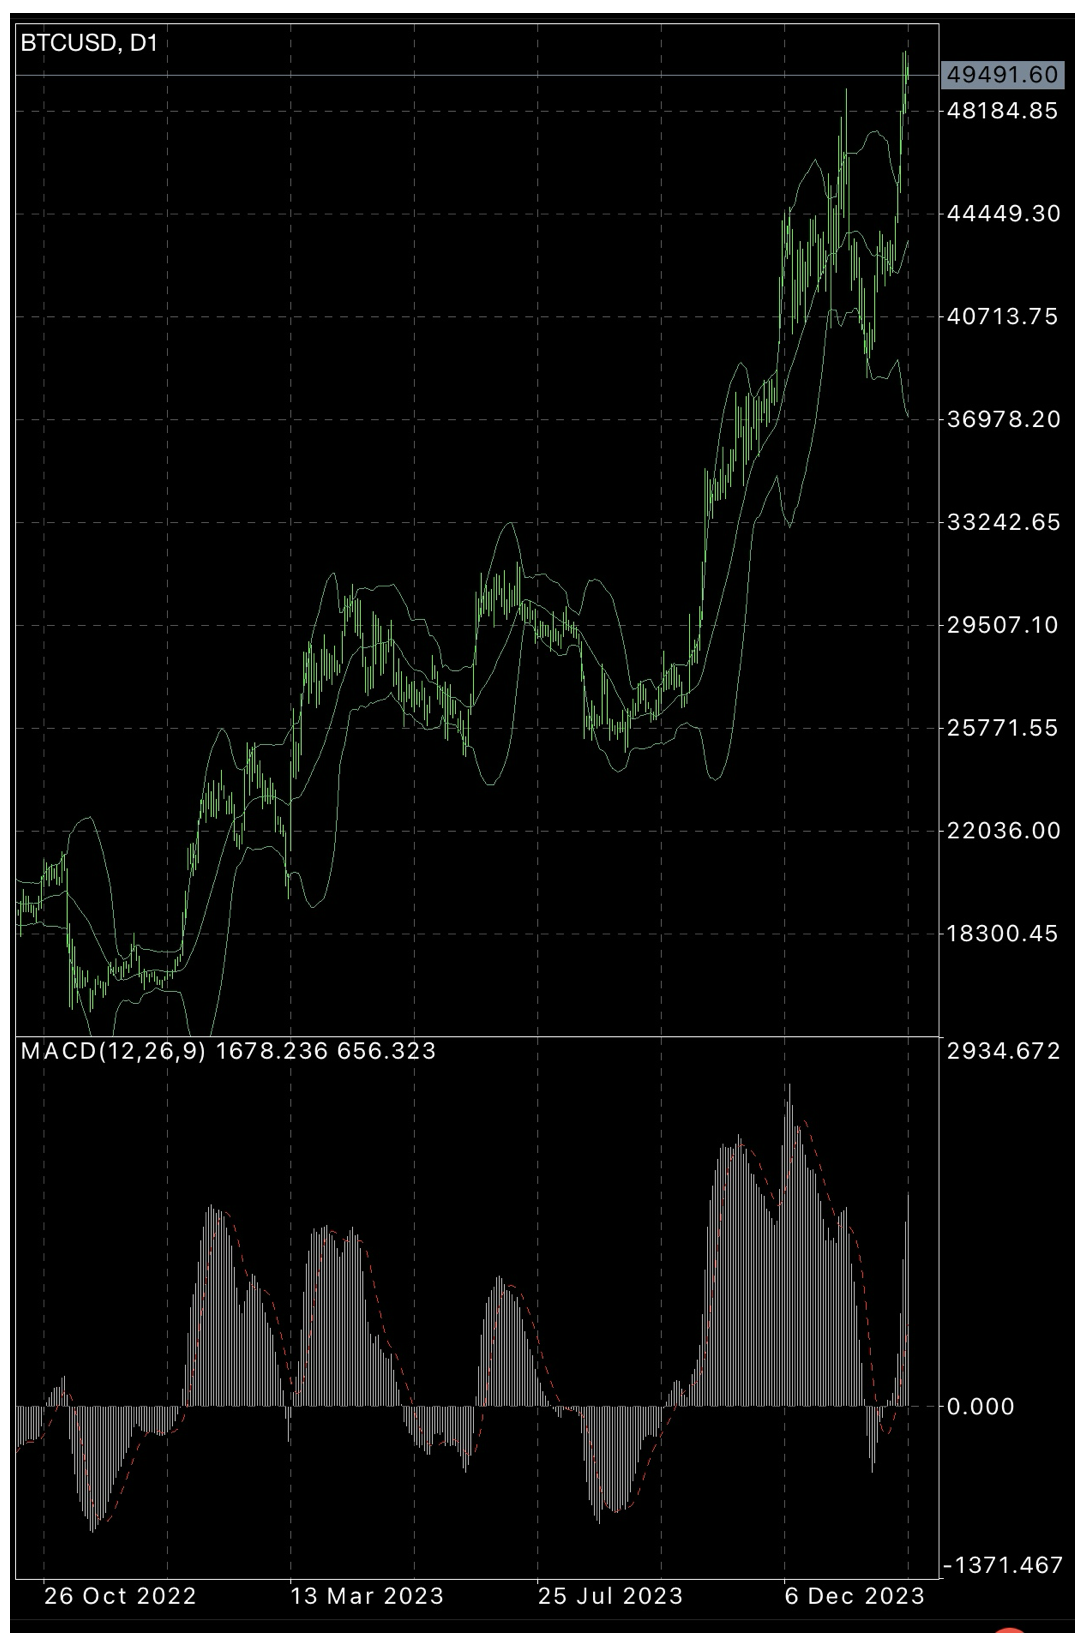
Bitcoin – target is $57,885.$40,000 offers strong support.
The S&P500 has hit 5000.The question now is do we consolidate here or just march higher?
My advice:Watch for volatility and a possible very healthy correction after the Chinese New Year festivities close.
Going forward, better-than-expected earnings results as well as signs of easing inflation, a strong labor market, and a more resilient economy point to a rosier outlook than many anticipated going into 2024.Therefore, when we have a market weakness, look at it as an opportunity to add exposure if you haven’t already.
More big earnings results in the week ahead include Arista Networks, as well as Marriott International, Occidental Petroleum, Deere, and Applied Materials.
Wall Street gets more inflation data, and investors expect it will continue to confirm the recent downward trend.Last Friday, stocks rose after December’s inflation reading was revised even lower than previously reported.
Gold – we are in corrective consolidation awaiting a breakout.
Bitcoin – uptrend in progress.Heading towards $57,000.The bigger picture remains bullish, with the potential to advance to extend toward the Key $69,000 resistance and beyond.
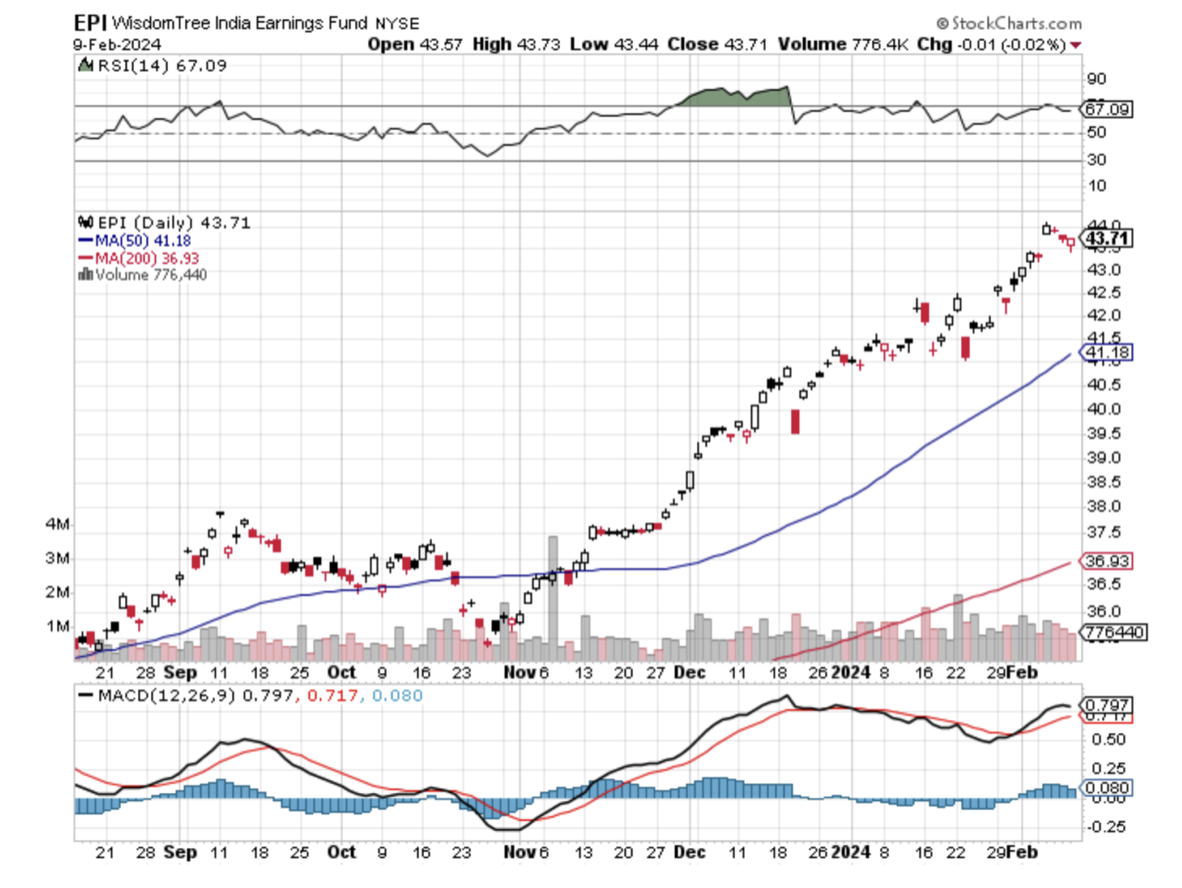
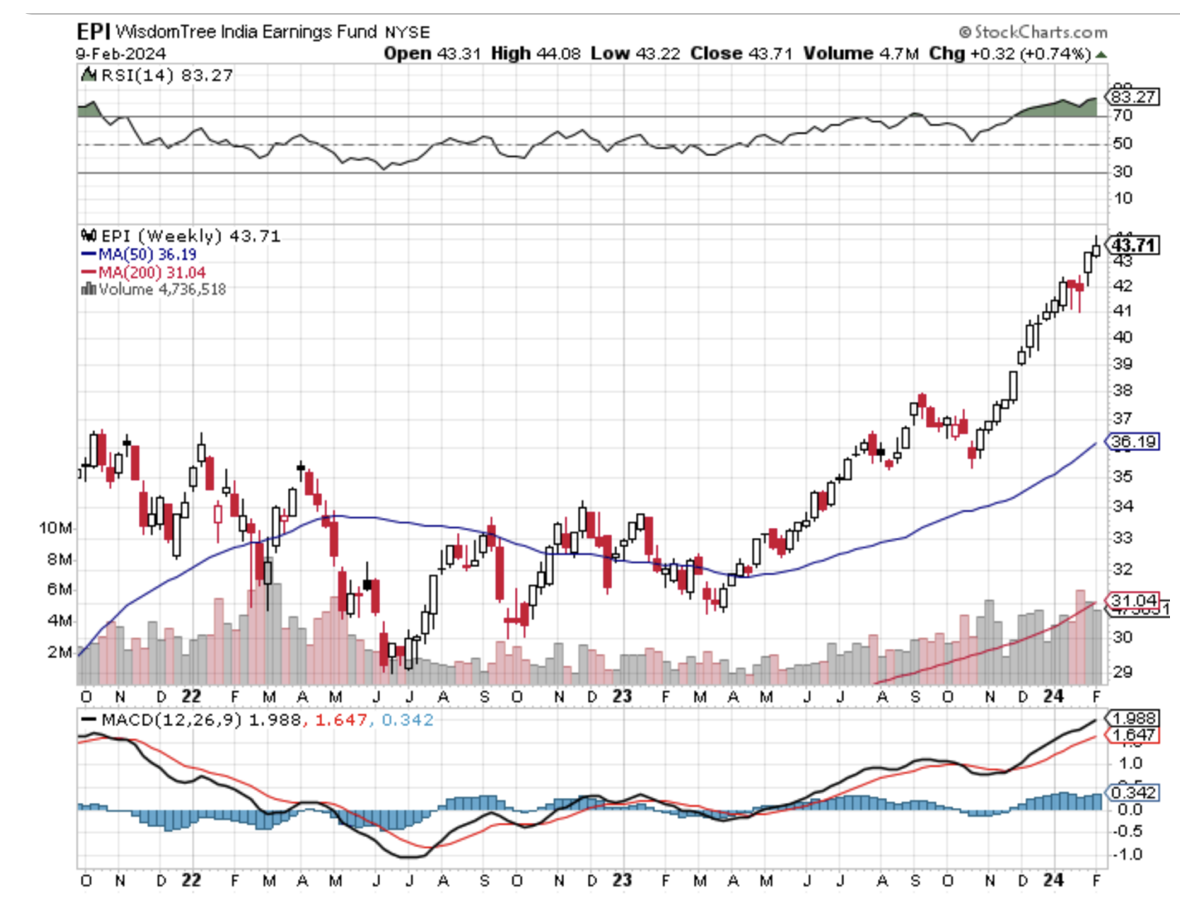
If we focus on emerging markets, India seems to come out on top for investors looking for long-term growth. And one ETF appears to have done a great job at capturing those returns compared to its peers.
I’m talking about the Wisdom Tree India Earnings ETF (EPI).It has nailed a total return of 6.6% through Feb. 8, according to FactSet, and is up 18.7% over the past three months.
That makes it the best performing of the five biggest India ETFs with the iShares MSCI India ETF (INDA) and the Franklin FTSE India ETF (FLIN) both up less than 4% year to date.The Wisdom Tree fund is also beating the S&P 500 which is up less than 5% over the same period.
The Wisdom Tree fund has been a long-term winner as well, with an average annualized return of roughly 12% over the past decade.
Jeremey Schwartz, Wisdom Tree's global chief investment officer explains that EPI is based on an index that weights stocks by their total net income, which keeps investors from overpaying for growth.
What makes India particularly attractive is its population profile, which is indicative of a long-term growth story.
EPI’s outperformance could also be explained by its broader collection of stocks.The fund has more than 400 holdings, including some smaller-cap companies, significantly more than some of its key competitors. Schwartz points out that most of the large-cap indexes for India today hold 50, 75, or 100 stocks.EPI is out in front with 400. The fund holds $2.5 billion in assets.
Something to note is that the fund itself has an expense ratio of 0.85%.The iShares INDA ETF has a 0.65% expense ratio and Franklin Templeton (FLIN) comes in lowest at 0.19%.
The one risk to my hyper-bullish scenario is that the economy doesn’t land at all and overheats forcing the FED to RAISE rates.
Focus remains on AI 5 with spectacular earnings announced last week.
All economic data is globally slowing, except for the U.S. with the only good economy in the world.
Saudi Arabia forced to cut oil production goals because of weak China demand.
Domestic plays have gone silent awaiting actual rate cuts.
Buy stocks and bonds but only after substantial dips.
Commodities and industrials are a second half play, we will keep rotating back and forth all year with tech.
The Trader’s Dilemma
The choice is now between 5 stocks that have gone up for 31/2 months, or a dozen interest rate sectors that may be dead money for four months.
Avoid the frustration trade, the one you should have done on October 26, look for the next one.
Wait for the ideal AI entry point, no matter how long it takes.
A big chunk of 2024 performance was pulled forward into 2023 and you made that money.
The sole exception is energy, which is driven by demand from the Chinese economy.
With markets at all-time highs 90-day T-bills are still yielding 5.43%.
The Global Economy – Beginning
Nonfarm Payroll Report comes in hot at 353,000.
The headline unemployment rate held at 3.7%.
The Fed turns dovish, with all members expecting the next move to be a rate cut.
Job openings hit a three-month high, while fewer Americans quit their jobs.
IMF upgrades Global Growth Forecast on the strength of the US by 0.2% to 3.1%
Chinese fiscal stimulus and a strong performance by large emerging market economies all contributed to the slightly brighter picture.
U.S. GDP rocketed by 2.5% in 2023, cementing its position as the strongest major economy in the world.Q4 came in at a hot 3.3%
Stocks – New Highs!
SPY breaks to new high on strong consumer sentiment.
Big tech continues to dominate.
Market will continue to revalue all AI plays.
Biden to Announce Massive Chip Subsidies, to head off a coming shortage driven by AI.
Bull move could continue into February as investors are under-invested, or even short.
Regional Banks get another Scare, as New York Community Bank drops by half.
Domestic plays have gone back to sleep on rising rates.
The flip-flop continues between tech and domestics.
Bonds – Back to Life
U.S. Treasury borrowing to hit $760 billion in Q1, some $55 billion less than expected.
Q2 then drops to only $202 billion.
Bonds rallied on the good news.
U.S. Budget funded only until March 8.
Bonds could be the Big Trade of 2024.
Markets are discounting three cuts starting in May 2024 more likely.
Junk bond ETFs (JNK) and (HYG) are holding up extremely well with a 6.50% yield and 18-month high.
John is looking for an $18 - $28 point gain in 2024 with interest.
Buy (TLT) on the dip.
Foreign Currencies – US$ back in charge
Foreign currencies give up 2024 gains because of the return of higher U.S. interest rates.
A dollar rally could last a couple of months, so a new currency entry point is approaching.
However, eventual falling interest rates guarantee a falling dollar for 2024.
Bank of Japan eases grip on bond yields, ending its unlimited buying operation to keep interest rates down.
China markets dive, on news that the central bank was forced into the currency markets to support the yuan.
(FXA) to rally on coming bull markets in commodities.
Buy (FXY) on dips.
Energy & Commodities – Saudi Arabia Cuts
Saudi Arabia cuts oil production target – cratering prices and destroying the entire energy sector.
Lack of demand, especially from China, is the reason.
New U.S. output is fuel on the fire.
Production will be throttled back a million barrels to 12 million barrels a day as a long-term goal.
Freeport McMoran kills it, with an earnings upside blowout, taking the stock up 5%.
Political problems in Chile and Peru are an issue, which generates 40% of the world’s copper.
Electrification of the U.S. economy will continue to be a driving theme.
China in free fall is destroying the oil market, the world’s largest energy consumer. There is a “BUY” setting up here in energy when the global economy reaccelerates on a lower interest rates world.Watch (XOM) and (OXY).
Precious Metals – Begging for a Breakout
Gold trending sideways awaiting decisive breakdown in interest rates.
Gold needs a return of falling interest rates to resume rally.
Miners are lagging gold performance but will play catch up.
Investors are picking up gold as a hedge for 2024 volatility.
Gold headed for $3000 by 2025 but backing off first from new all-time highs.
Silver is the better play with a higher beta.
Russia and China are also stockpiling gold to sidestep international sanctions.
Real Estate – Gearing up for Spring.
S&P Case Shiller Falls in November for the first time in nine months.
This was back when mortgage rates were peaking at 8.0%.
New Home Sales recover on a falling interest rate push, up 8.0% to 664,000.
Sales increased 4.4% on a year-on-year basis in December.
DR Horton misses in a rare sign of weakness in the new home building industry taking the shares down 10%.This industry has a gale force demographic tailwind.
Tight supply and still-strong demand have kept pressure on home prices.
Do you live in Buffalo, New York? If so, you have the good fortune to occupy the hottest housing market in 2023.
The stock market has started the year in a positive mode with big tech rallying strongly.The S&P 500 is up around 4% year to date after a 24% rise in 2023.
What could sour the mood?
Political tensions, still-high inflation levels, and uncertainty about when the U.S. Federal Reserve will cut interest rates.
All these factors have raised questions about which sectors – and stocks – will outperform looking ahead.
Let’s concentrate on three, I believe will perform well this year.
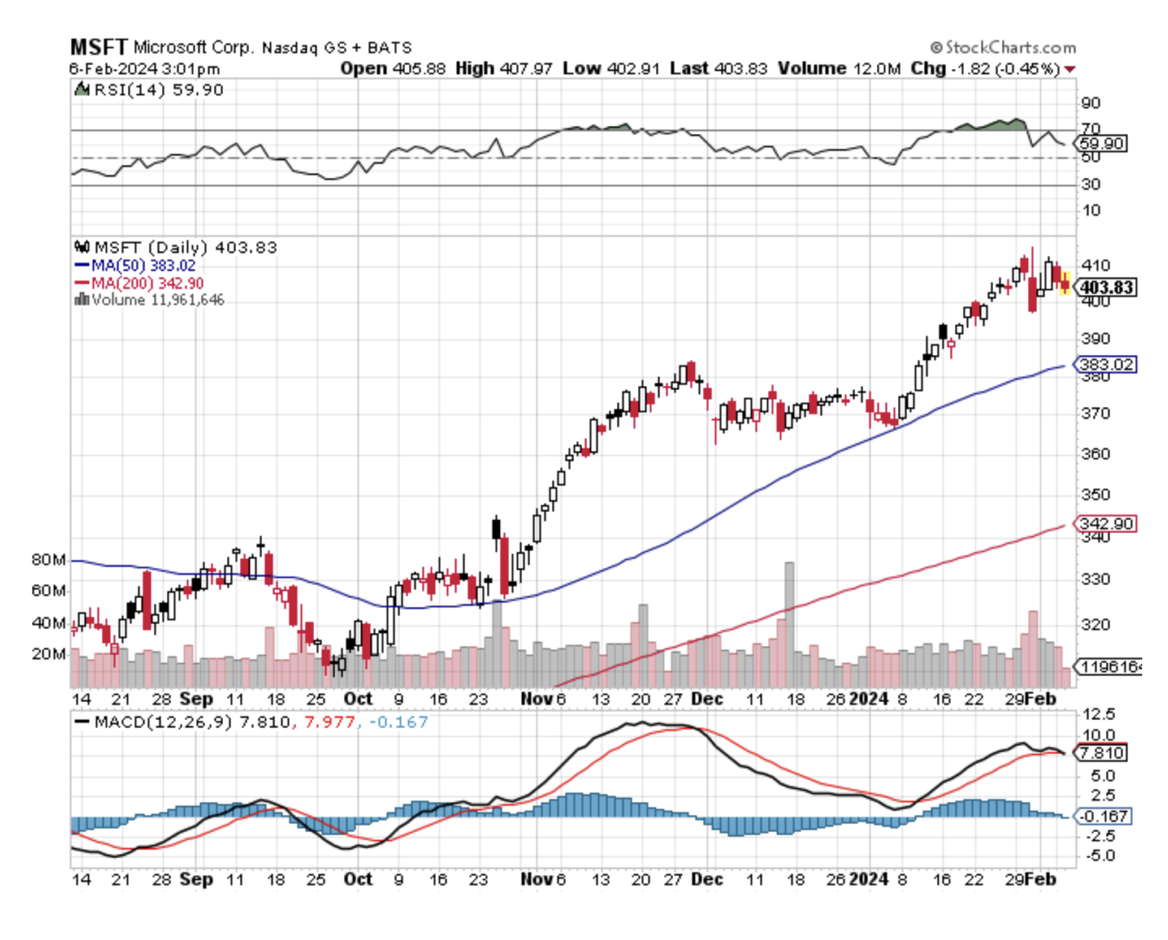
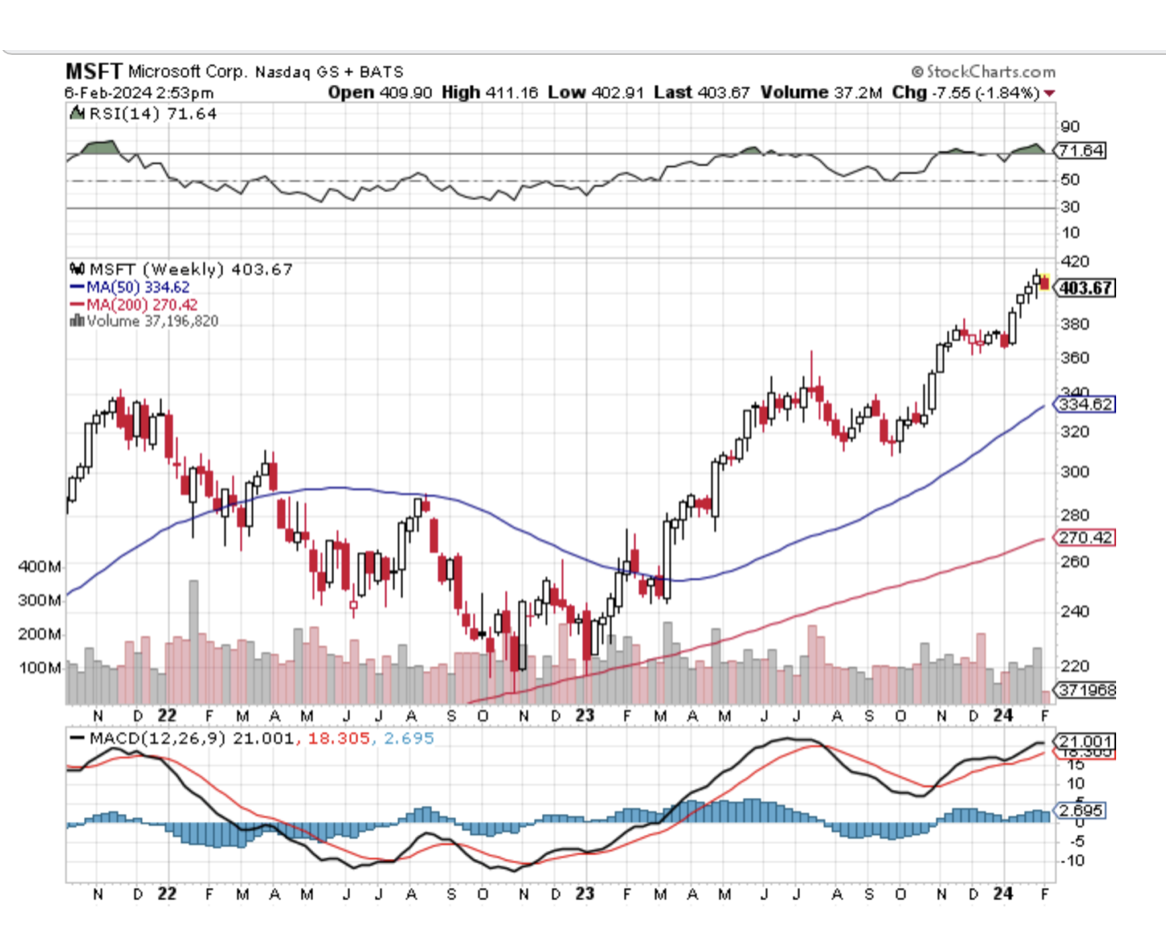
1/ Microsoft (Stock Price as of 02/06/24 - $403.66)
This company has a focus on cloud computing and mobile technology.Microsoft’s Windows operating system dominates the PC market globally at around 90%.Robust revenue from other segments like Azure, Office 365, and Dynamic CRM are contributing to revenue.
Last week, Microsoft reported a 17.6% year-over-year increase in its revenue for its quarter ending Dec. 31.
Microsoft has a huge diversity in software applications making it a key player in digital transition.It has a strong presence in cloud infrastructure and ties with Open AI making it well placed to meet the rising demand for generative AI.
Over the last 12 months, shares in Microsoft are up almost 60%.Of 52 analysts covering the stock, 48 give it a buy or overweight rating at an average price of $460.37, according to FactSet data.This gives it an upside potential of almost 12%.
My Recommendation: Buy the stock on dips.Average in.
Option Recommendation:One-year LEAPS out of the money.
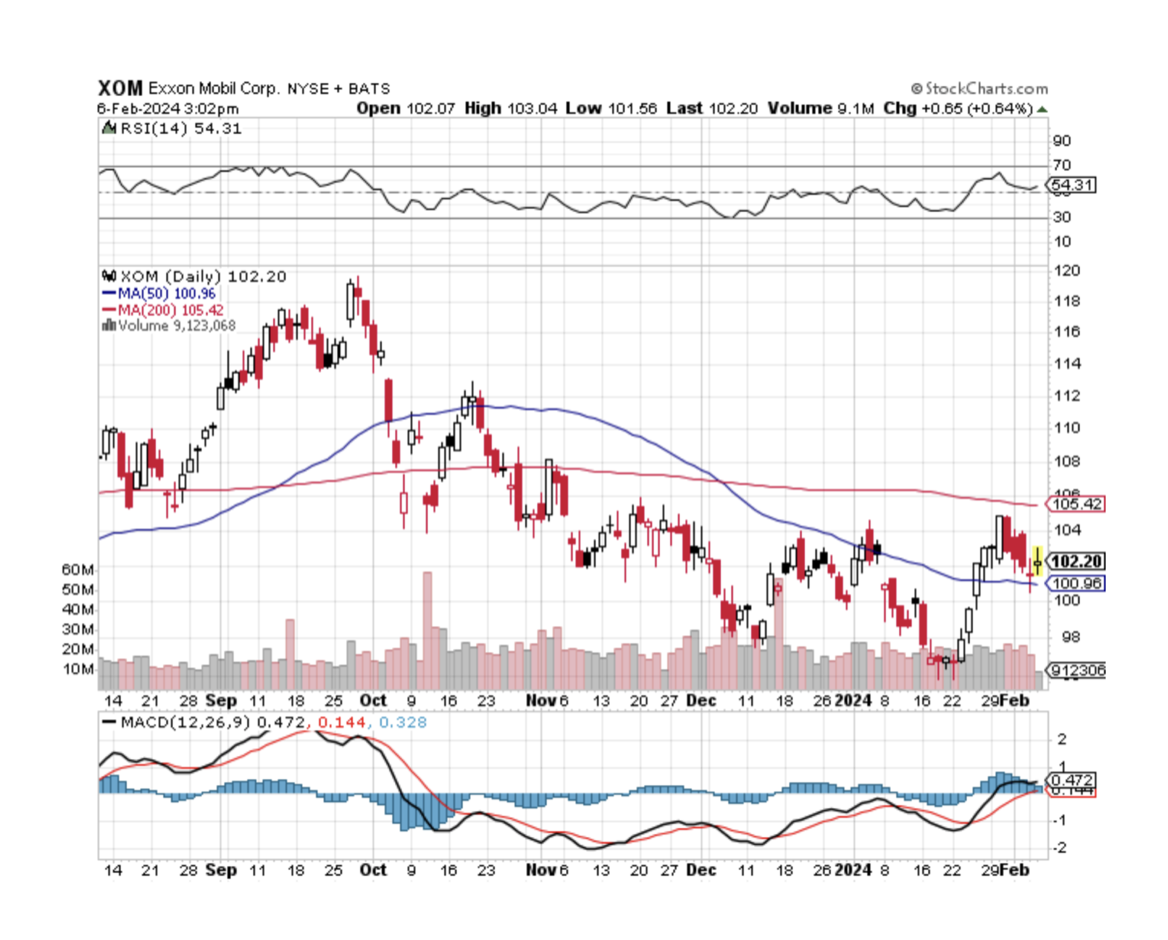
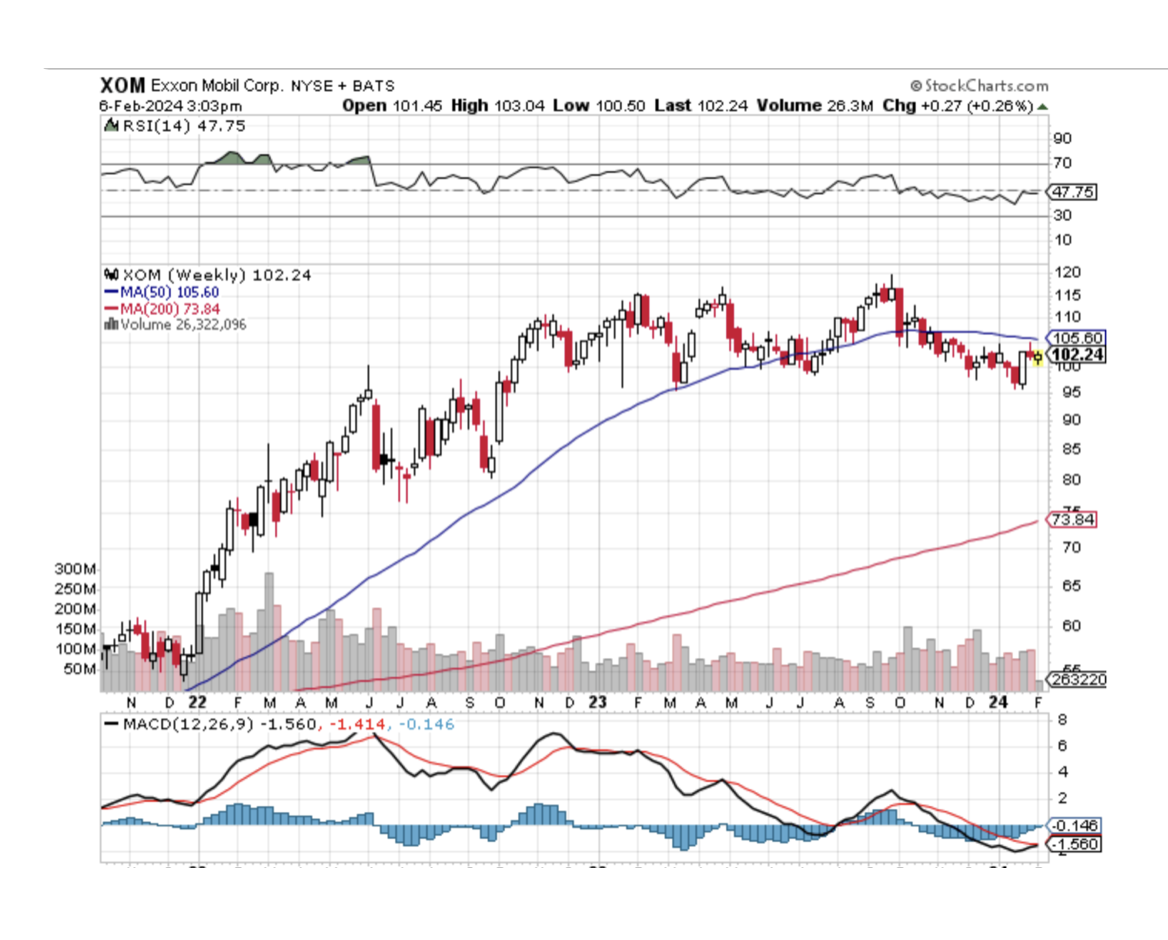
2/ ExxonMobil
Despite the mixed sentiment on the energy sector presently, amid ongoing geopolitical uncertainties and fluctuating oil prices, I am optimistic about this stock for the long term.
Last week, the stock reported quarterly earnings that beat analysts’ expectations, but profit fell compared to a year before on lower oil prices.
Let’s scan the long-term horizon for this stock.
# Long-term potential from low-carbon investments.
# Strong balance sheet supporting higher capital returns.
A key catalyst is in the pipeline for Exxon with its acquisition of Pioneer Natural Resources valued at almost $60 billion.The deal is expected to close by mid-2024.
Production volume in the Permian Basin located in West Texas and New Mexico is tipped to more than double to 1.3 million barrels of oil equivalent per day once the deal closes.
Other opportunities include growth prospects from the company’s discoveries in Guyana between 2025 and 2026.
Over the last 12 months shares in ExxonMobil are down over 8%.
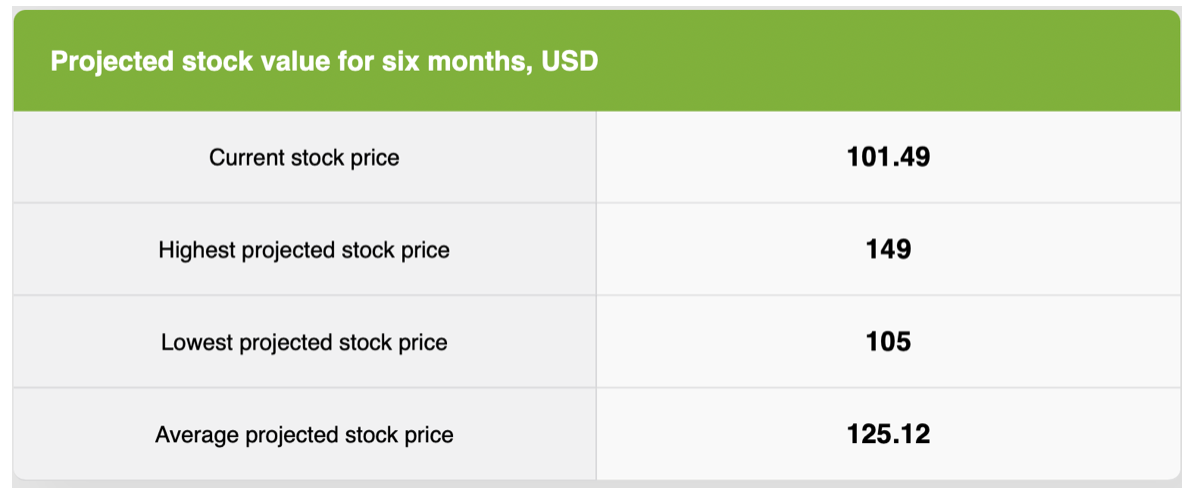
Of 29 analysts covering the company, 19 have a buy or overweight rating on the stock at an average price target of $124.94, giving it an upside potential of around 22.5%, according to FactSet data.
My Recommendation:Buy small parcels in this stock now.Average in.
For those who trade Options: One-year LEAPS out of the money.You could look at 105/110 or even 110/115.Expiration: January 17, 2025.
You can buy the stock or do the option or do both.
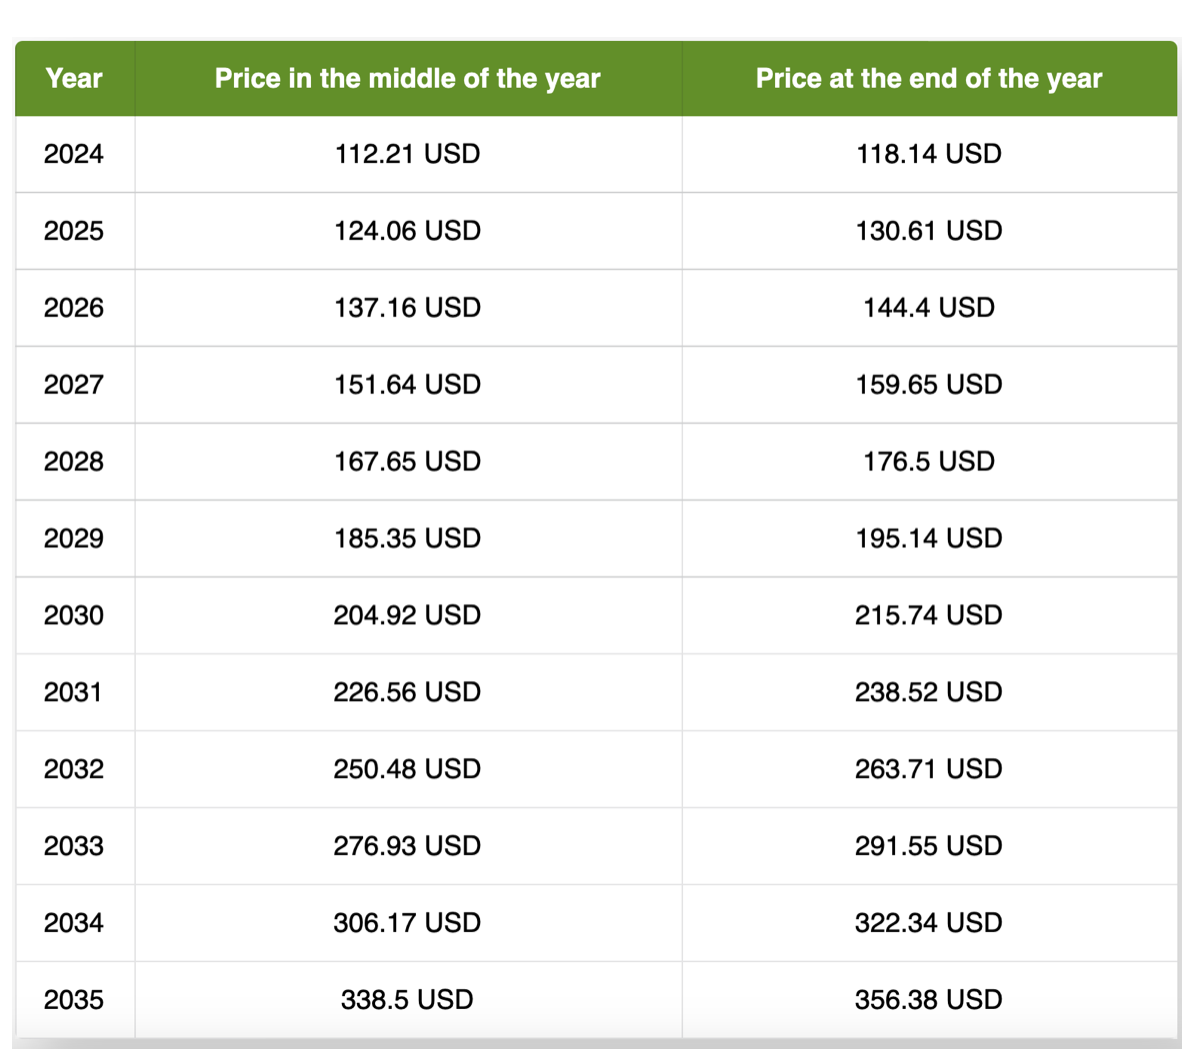
Analyst Price Projections for ExxonMobil
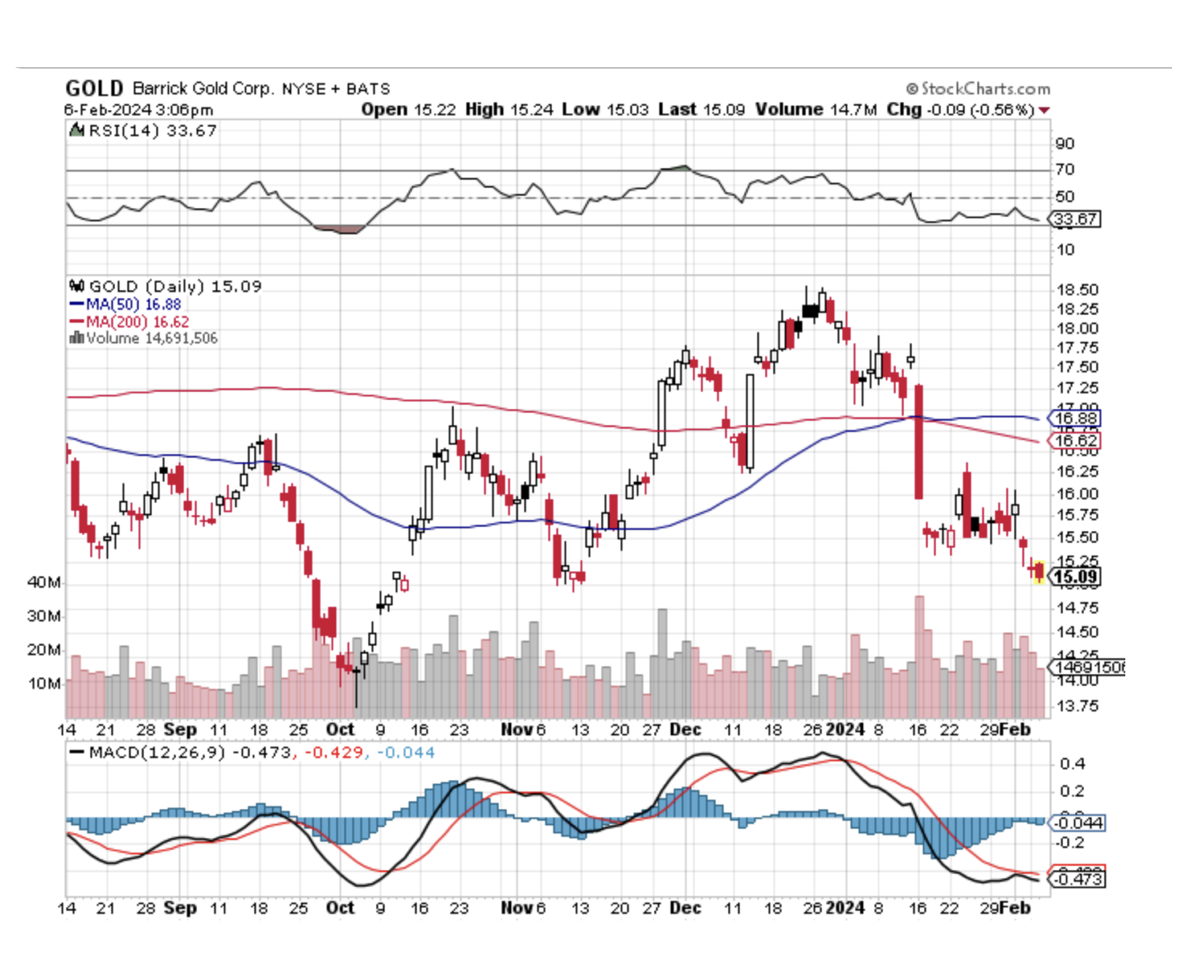
Barrick Gold (Stock Price as of 02/06/24 - $15.09)
Beyond tech and energy, metals get a big tick also, and I favor Canadian miner Barrick Gold here.
There is a positive outlook on gold due to geopolitical uncertainties, making it a reliable safe haven investment during economic challenges.Spot gold prices are up around 7.5% over the last 12 months.
Kevin Teng, CEO of Wrise Wealth Management Singapore argues that despite the lag in performance among gold miners compared to the rising gold prices since 2023, Barrick Gold, being one of the largest gold miners, is poised to benefit from the expected price recovery.
Teng goes on to explain that he is expecting a “sequential improvement” in the company’s output following the expansion in its production of copper production to 240,000 metric tons from the current 150,000 metric tons in its Lumwana copper mine in Zambia. A similar boost in production levels is also expected at its Reko Diq copper-gold project in Pakistan.
So, it is apparent that Barrick Gold’s expansion plans collectively position it for potential growth in the coming year.
Shares in Barrick Gold are down over 15% over the last 12 months.
Of 23 analysts covering the company, 16 have a buy or overweight rating on the stock at an average price target of 29 Canadian dollars ($21.52), giving it an upside potential of almost 40%.
My recommendation:Buy the stock in small parcels.In other words, average in.
If you trade options, I suggest one-year LEAPS.You could look at the 15/17 January 17, 2025, Bull call spread LEAPS.
You can just buy the stock or just do the option.Some people buy the stock and do the option.It’s your choice as are the number of shares or options you purchase.
(THE SECTORS FAMILY OFFICES ARE FAVOURING in 2024)
February 5, 2024
Hello everyone,
Welcome to another big week of earnings.Media and consumer names feature this week.
Disney, McDonalds, and Uber Technologies are among the 94 S&P 500 companies due to report this week.230 S&P500 companies have already reported their 4th quarter numbers.Of those, 75% have exceeded expectations. (All times: Eastern)
Monday, Feb 5, 2024
9:45 a.m. PMI Composite
9:45 a.m. Markit PMI Services
10 a.m. ISM Services PMI
Australia Interest Rate Decision
Previous: 4.35%
Time: 10:30 pm ET
Earnings: McDonald's, Simon Property Group, Estee Lauder Companies, Tyson Foods, On Semiconductor, Caterpillar
Tuesday, Feb 6, 2024
Euro Area Retail Sales
Previous: -0.3%
Time: 5:00 am ET
Earnings: Chipotle Mexican Grill, Prudential Financial, Fortinet, Enphase Energy, Eli Lilly, GE Healthcare Technologies, Ford Motor.
Earnings:Motorola Solutions, Expedia Group, Ralph Lauren, T. Rowe Price Group, ConocoPhillips, The Hershey Co., Philip Morris International, Tapestry.
Friday, Feb 9, 2024
Canada Unemployment Rate
Previous: 5.8%
Time: 8:30 am ET
Earnings: PepsiCo
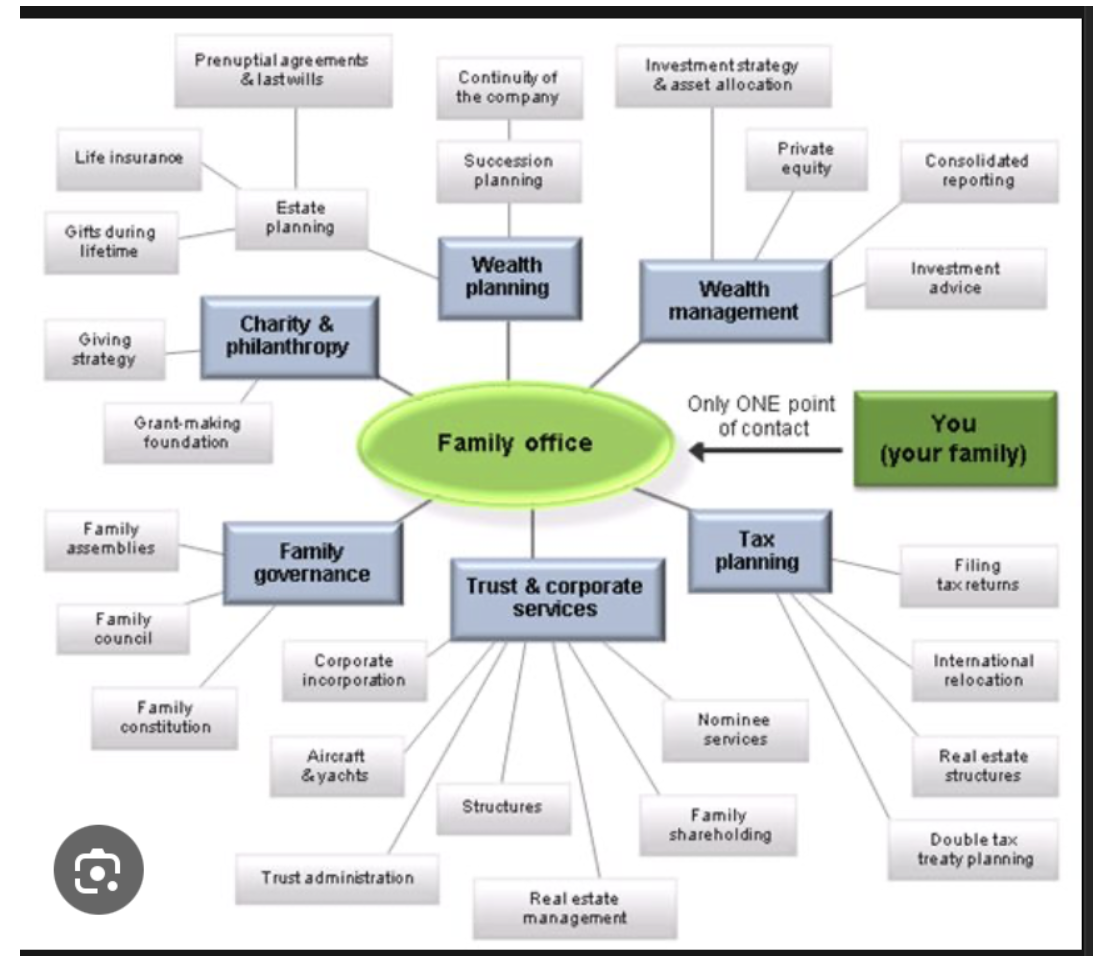
An ever-increasing number of wealthy individuals has contributed to a boom in family offices in the last few years.
In the United States, in the last three years alone billionaires are 46% richer than they were in 2020.
Studies show that the ultra-high net worth population overall declined in Asia last year, but rose in India, while Europe and America recorded smaller declines.The combined net worth of Asia’s super-rich population was at $12.13 trillion, above Europe’s $11.73 trillion.
Family offices typically cater or investors with $100 million or more in net worth.According to a 2023 study by KPMG, 26% of family offices most commonly manage between $251 million and $500 million in assets, while 65 manage over $5 billion.A 2022 report citing various estimates said that family offices were managing more than $6 trillion in wealth.
So how are family offices allocating right now and in the next few years – in the face of major global shifts?
UBS notes that the current trend among family offices is a return to fixed income as a diversifier, although stocks in developed markets remain the most important asset class.
Currently, UBS states, that the most favored diversification strategy globally is high-quality short-duration fixed income.The bank also states that family offices are planning to buy more developed market bonds over the next five years.
The table here shows how family offices are planning to change their asset allocations in the next five years, according to UBS’s 2023 survey.
Citi points out that most family offices have started to shift toward higher-risk asset allocations, which is in line with Citi going overweight on stocks in December for the first time since 2020, as it expects earnings growth to broaden across sectors.
One type of fixed income that family offices are positive on right now is U.S. investment grade credit of long duration and high quality.
There is also more hedging in portfolios now than two years ago, with clients using macro trading strategies tied to geopolitical uncertainty.
What type of assets are family offices looking to buy in the next few years?
Japan stocks are one area.The ‘Japan thesis’ is built around resurgent inflation, and resulting wage growth, which has created better purchasing power for Japanese corporates.Also, better corporate governance.
Japan’s stocks had a bull run last year, and it’s continuing into this year, touching new 33-year highs.
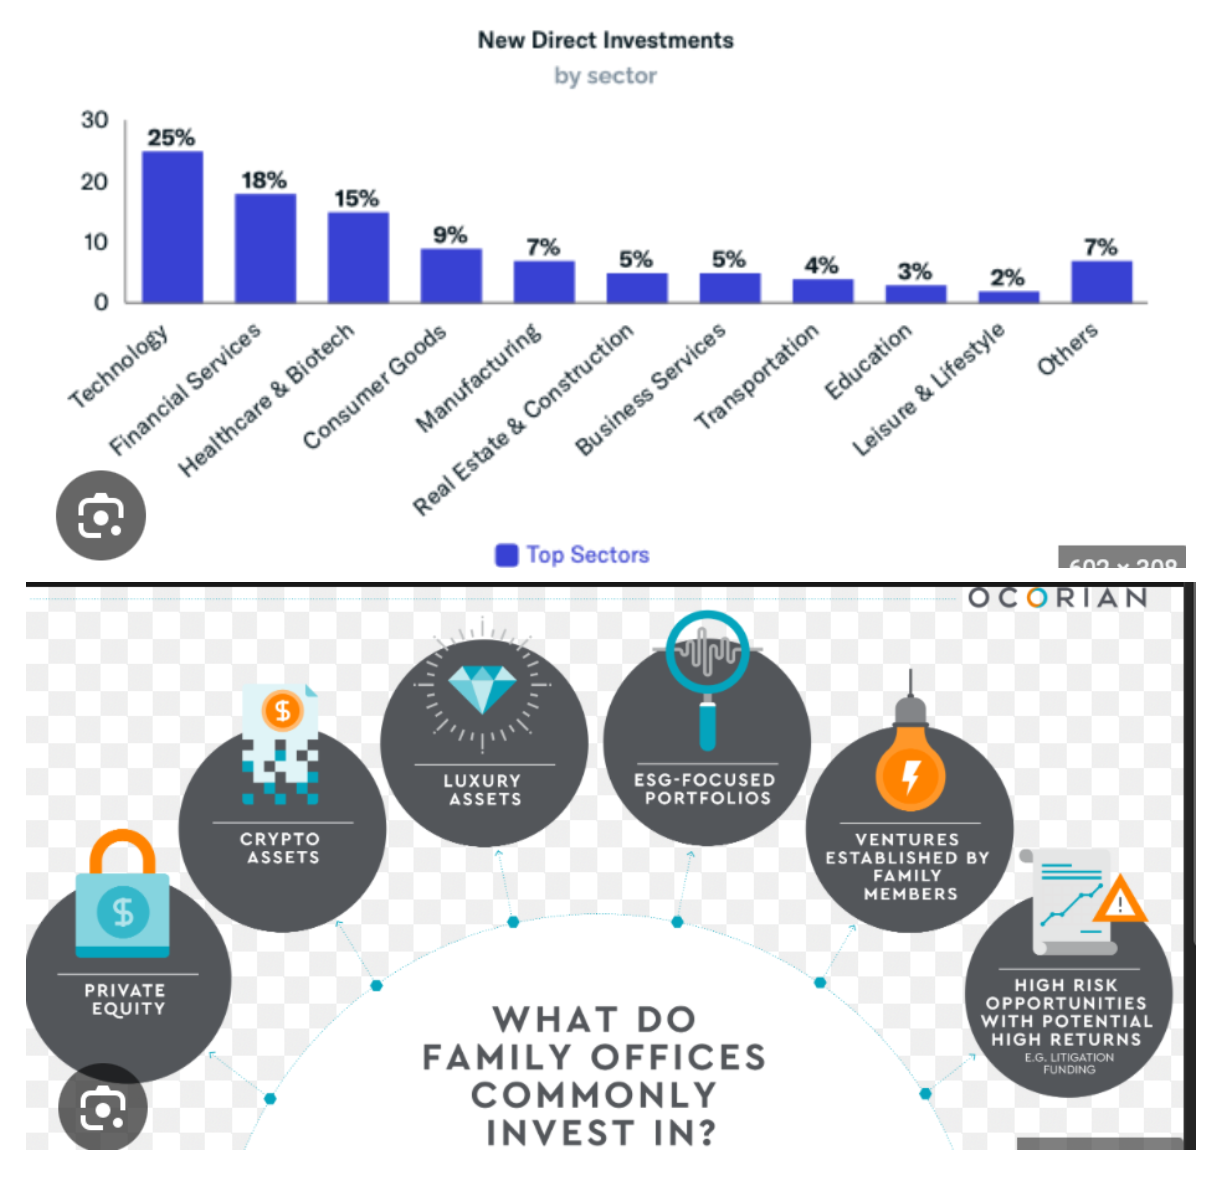
According to Citi, other themes that family offices are bullish on include health care and longevity, the energy transition, and generative artificial intelligence.
Overall, Citi says, that tech led the way as 63% of family offices stated it as their preferred sector to invest in, with real estate coming in second (42%), and health care in third position at 40%.
Providers are showing that alternative assets are also becoming more popular with family offices, such as private equity, private debt, and infrastructure.Private equity is a play on lower interest rates, given so much of the returns from this asset segment are driven by cost and availability of debt.UBS explains that family offices are primarily investing in private equity through funds, which deliver diversification and the ability to enter markets where the family office does not have in-house expertise.
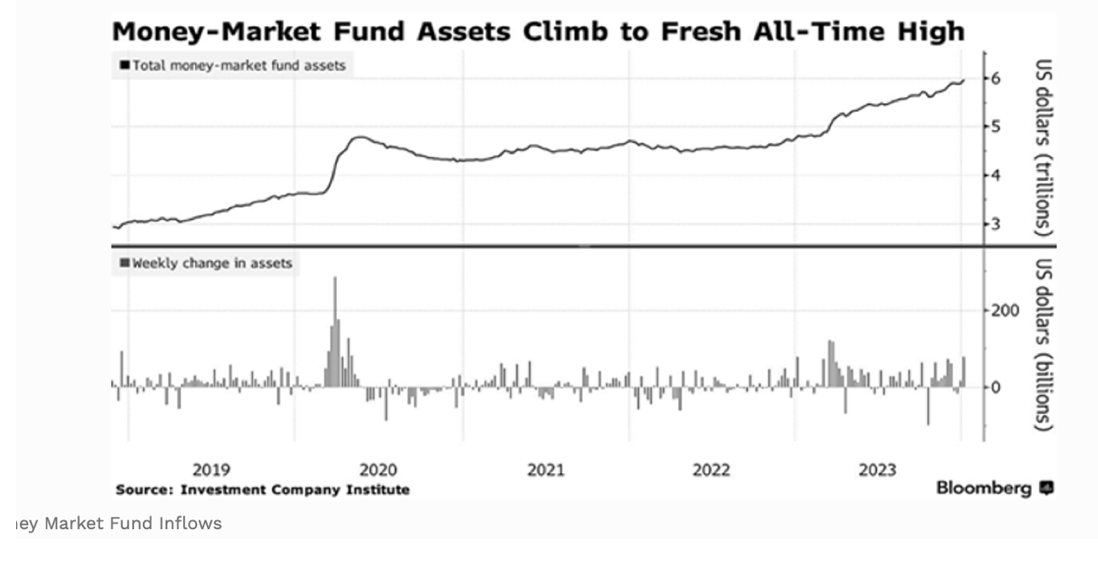
Markets are largely expecting the U.S. Federal Reserve to start cutting rates this year, after a protracted period of hiking.
The 2022 sell-off and rapid rise in interest rates in 2023 caused money-market balances to soar, doubling from where they were just five years ago – a far bigger increase than the historical trend.Investors didn’t necessarily want their money to grow but rather keep it safe.
That’s a lot of cash.
And the likelihood that much of that cash will flow into stocks, given the market’s more optimistic mood these days, is why we’re unlikely to see a sharp pullback soon, as counterintuitive as that seems given the markets’ big move of late.Although, I hasten to add that the Magnificent Seven are definitely overstretched.
$6 trillion on the sidelines is a big deal.This pot of money is looking for a home in stocks, bonds, and real estate.Having that much dry powder means there is room left for stocks to fly a little higher before we can call this a bubble.
So, what’s the best way for us to profit in a market like this, other than scaling into stocks on down days and buying LEAPS?
One option is investing in a mutual fund.This type of fund is one that many companies offer to workers in their 401 (k) plans.The problem here is that many of those funds perform poorly.And there is a kickback play taking place on the employers’ side as the latter receive benefits from the high fees charged by the fund managers that run them. I believe it’s called keeping the status quo.Here is an example.
Clearbridge Sustainability Leaders Fund (CBSLX) This fund has an environmental, social, and governance mandate (ESG) that has weighed on its returns, even though it holds many S&P500 standouts, like Apple (AAPL) and Microsoft (MSFT).
Another popular option is an index fund, like the SPDR S&P 500 ETF Trust (SPY), which holds the entire S&P500 and tracks the index.Buffett has often advised investors and anyone willing to listen to buy an index fund – not necessarily the one above – and just keep adding to it on dips.
But how much does it yield?
Only 1.4%.You would need $7.1 million invested to receive $100,000 in passive income from this fund.But it’s a solid fund and over time it will increase in value.
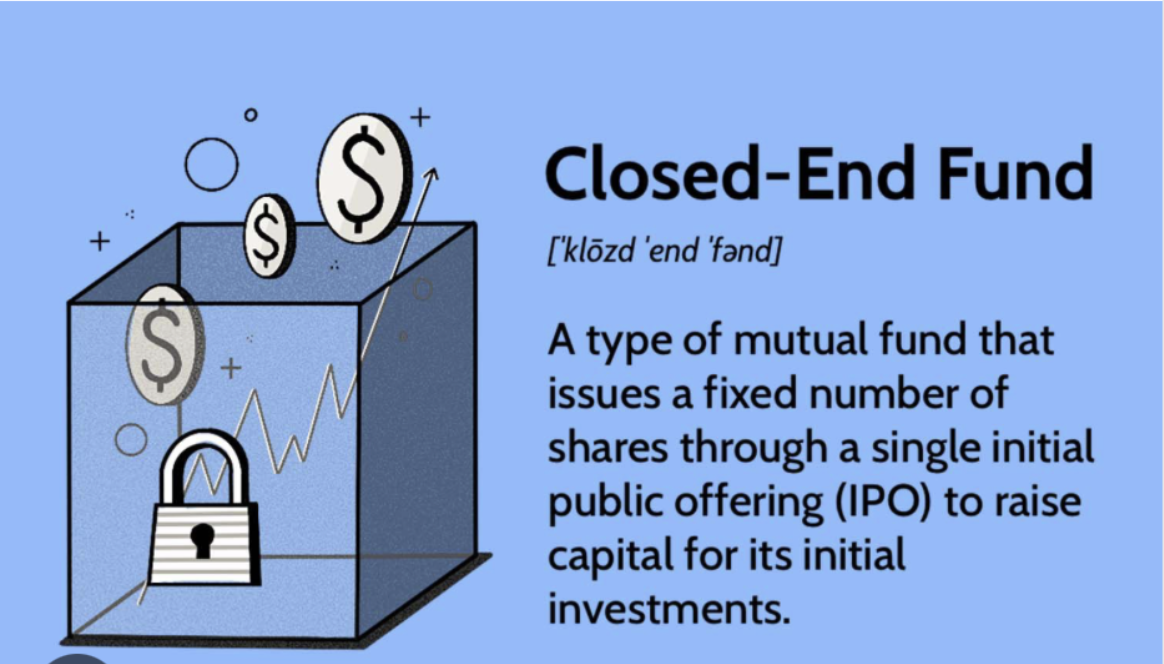
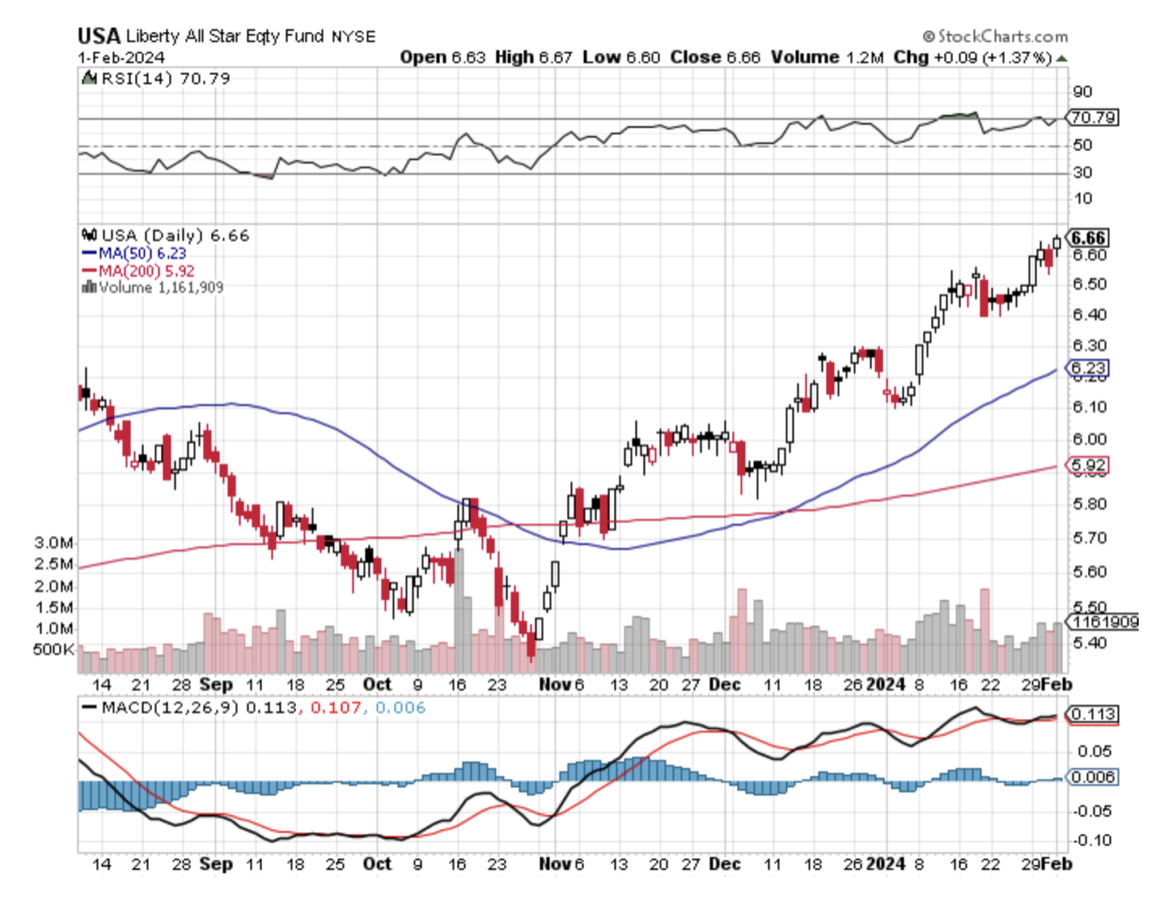
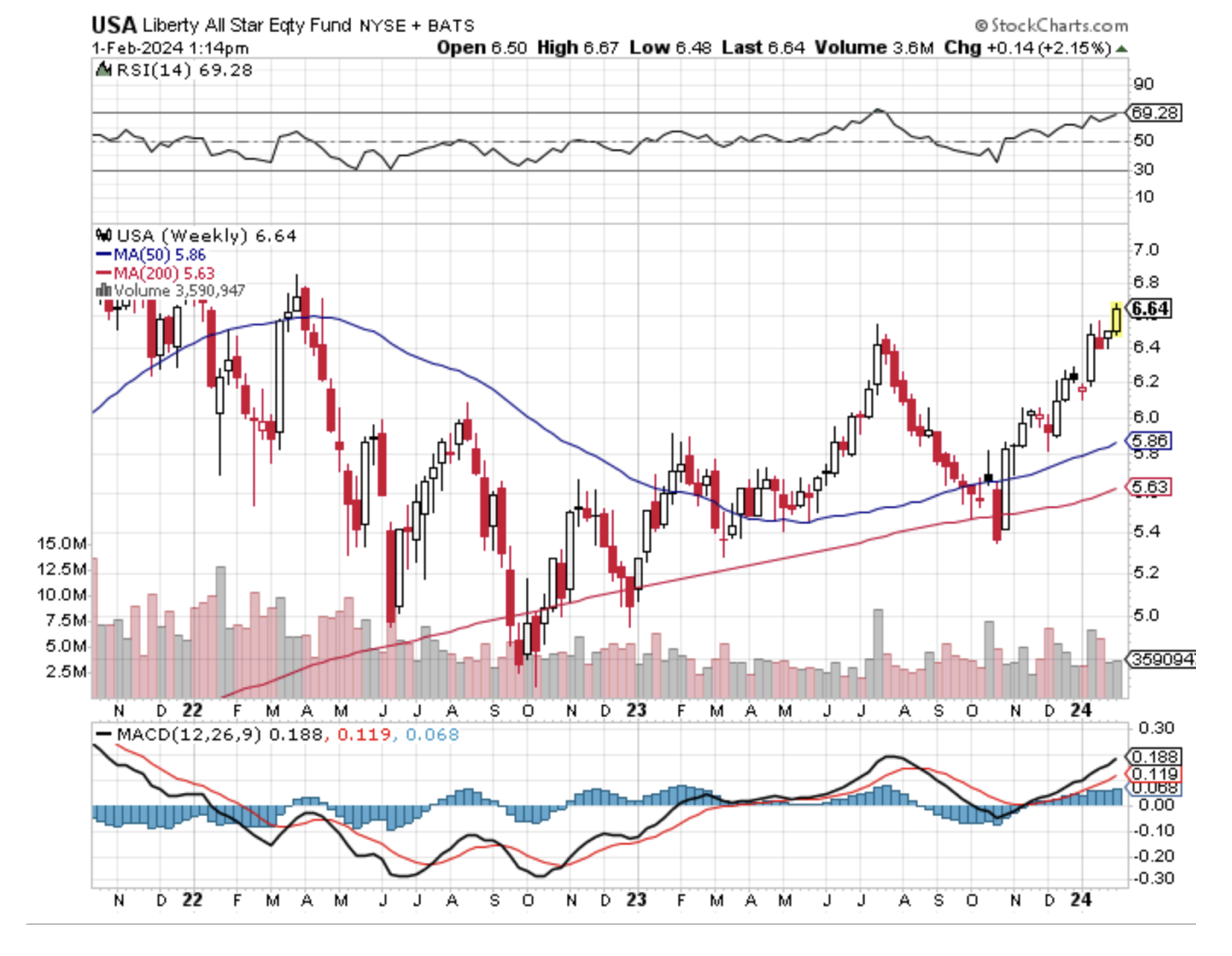
How about a closed-end fund (CEF) called the Liberty All-Star Equity Fund (USA).
This fund (current yield: 9.7%) holds many of the same stocks as SPY, like Microsoft and Apple, as well as United Health Group (UNH), Visa (V), and Capital One Financial (COP). What’s more the fund (USA) has delivered a solid 661.5% return in the last 15 years.So, its appeal is twofold:it returns the profits of the broader stock market in a well-diversified fund and two, it delivers a large slice of those profits as dividends.
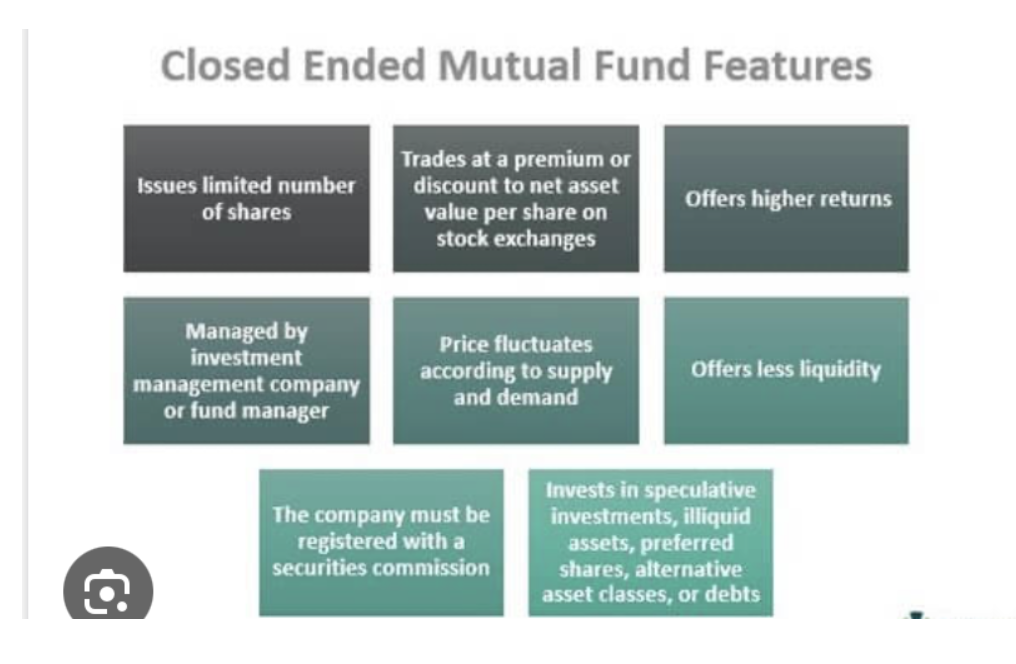
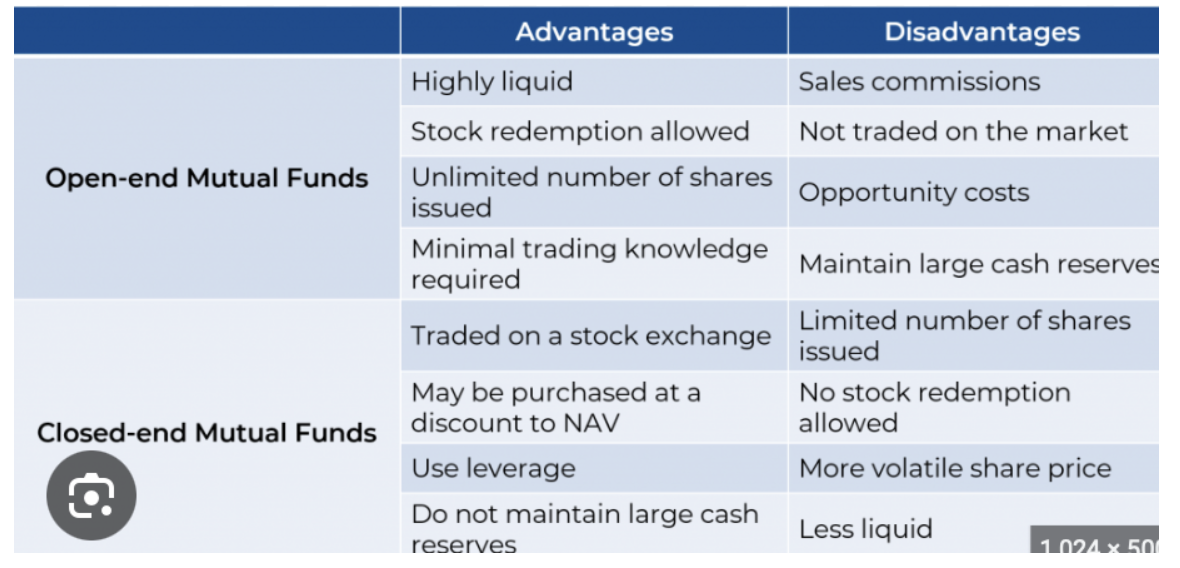
What are CEFs:
They are like mutual funds or ETFs in that they pool money from investors, which the fund’s managers then use to buy a basket of stocks, bonds, real estate investment trusts (REITS), or other investments, depending on the CEF’s mandate.
The fund managers then buy and sell over time, handing profits over to investors as dividends.CEFs trade on public exchanges and can be bought and sold, just like a stock.
CEFs are heavily regulated.They must account for their operations and file statements with the SEC every quarter.
Being publicly traded means CEFs are liquid.If you need cash, just sell your shares during market hours, Monday through Friday from 9:30 a.m. to 4 p.m. Eastern time.
The (USA) yield of 9.7% will provide you with a $100,000 annual passive income with $1,030,928 invested.
And this payout will probably grow in the future.All-Star Funds has a policy of paying out 10% of its net asset value (NAV or the value of its underlying portfolio as dividends every year, and the fund’s total NAV return has been 12.6% per year on average over the last 15 years.(With CEFs, per-share NAV returns often differ from a fund’s market price–based returns, in part because CEFs have more or less the same share count for their entire lives.)That means (USA) has earned 121% of its payouts during this period, which also suggests it can sustain its dividend for a long time.
Investors can also look forward to some upside generated by the fund’s discount to net asset value (NAV).Right now, the shares trade for around 3% below NAV, under the five-year average of a 0.9% discount.Not a wide gap, but as it closes it will give the market price an extra push.
This Post has provided you with a brief introduction to closed-end funds, featuring the Liberty All-Star Equity Fund (USA).The discussion here is designed to educate you about what is on offer in the financial marketplace.Always do your own research and make sure you are aware of all the risks.
(THE RISE OF BIOTECHNOLOGY WILL BE A GAME CHANGER FOR THE HEALTHCARE INDUSTRY)
January 31, 2024
Hello everyone,
I’m going to dive into the Healthcare Industry today.It may have done poorly in the last couple of years, but analysts are bullish on it right now.By 2050 biotechnology and artificial intelligence will lead to advances in genetic engineering that could lead to an era of personalized medicine, facilitating customized treatments based on each person’s genetic makeup.No more one-size-fits-all medical care.So, it’s an area that deserves our attention.
I believe healthcare investors may be able to climb the wall of worry in 2024.
Citibank, among others, expects the Federal Reserve to ease its restrictive monetary policies over time.Growth stocks such as those in tech and biotech usually benefit from rate cuts.
Stocks dialed into the trends of longevity and innovation saw a downturn in 2023.This gives us opportunities now.
Analysts have cited biotech, in particular, as one of a few areas to watch.
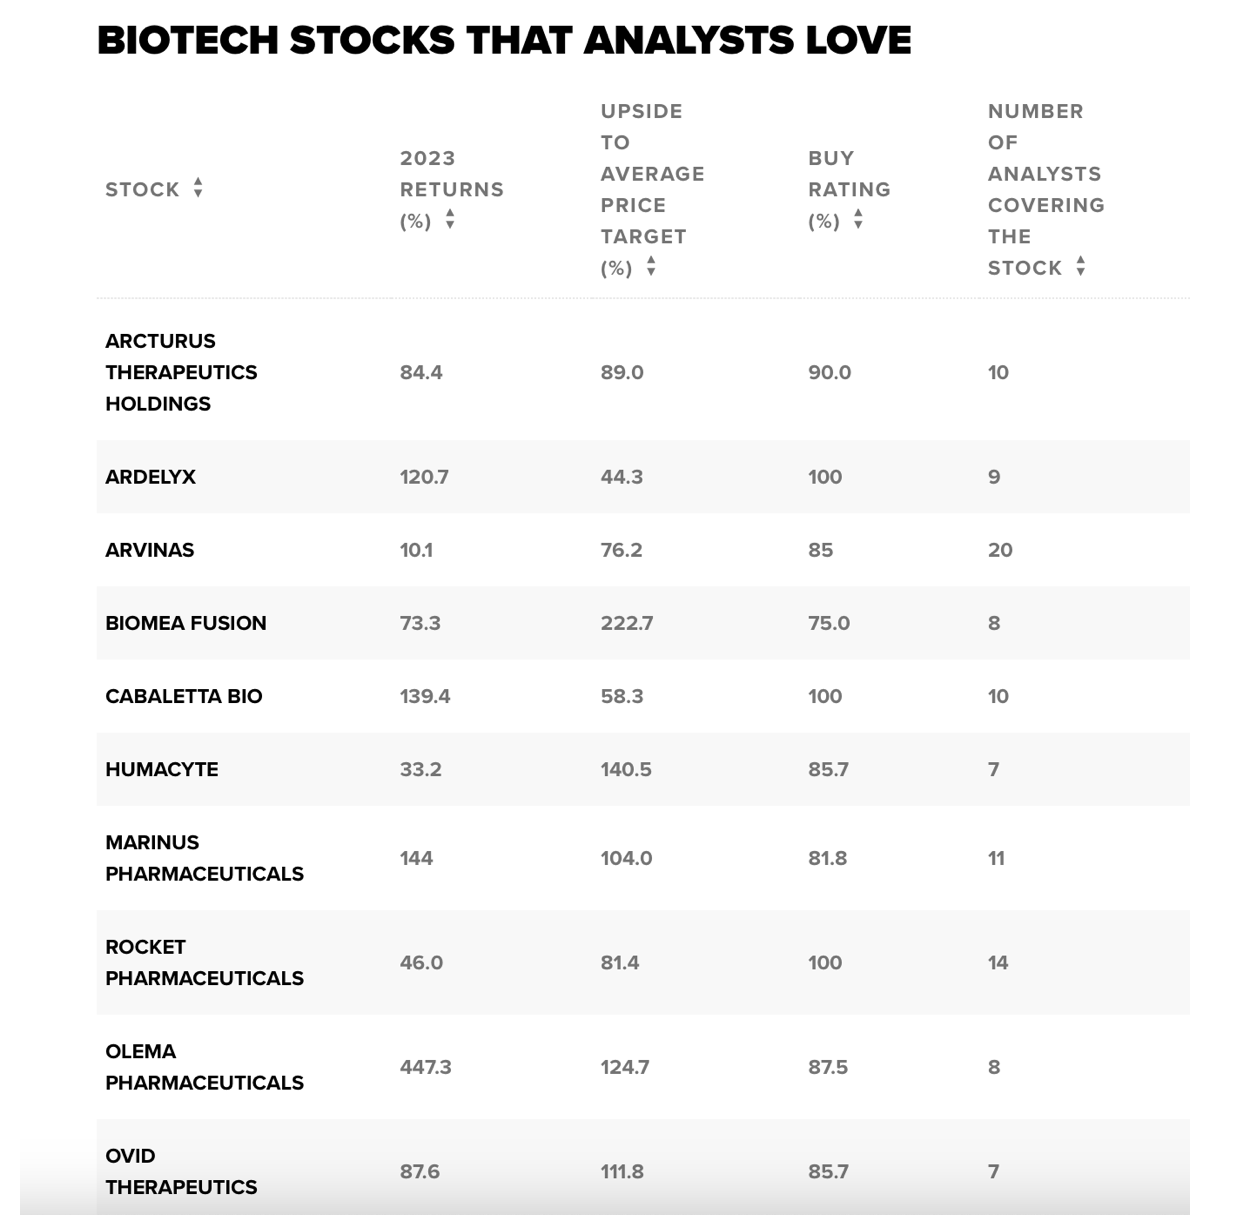
I have been looking for biotech stocks that did well last year and that analysts are still positive about.
These stocks were up more than 20% in 2023.
They have a potential upside to the average price target of more than 40%.
They have a buy rating of more than 70%.
And seven or more analysts have covered the stocks.
Humacyte (HUMA)
Marinus Pharmaceuticals (MRNS)
Olema Pharmaceuticals (OLMA) is involved in developing therapies for women’s cancers, particularly in breast cancer.The company is looking to partner for its Phase 3 studies and it’s anticipated that shares could react once such a relationship is announced in the near to mid-term.
Ovid Pharmaceuticals (OVID)
These stocks have all been given more than 100% upside.
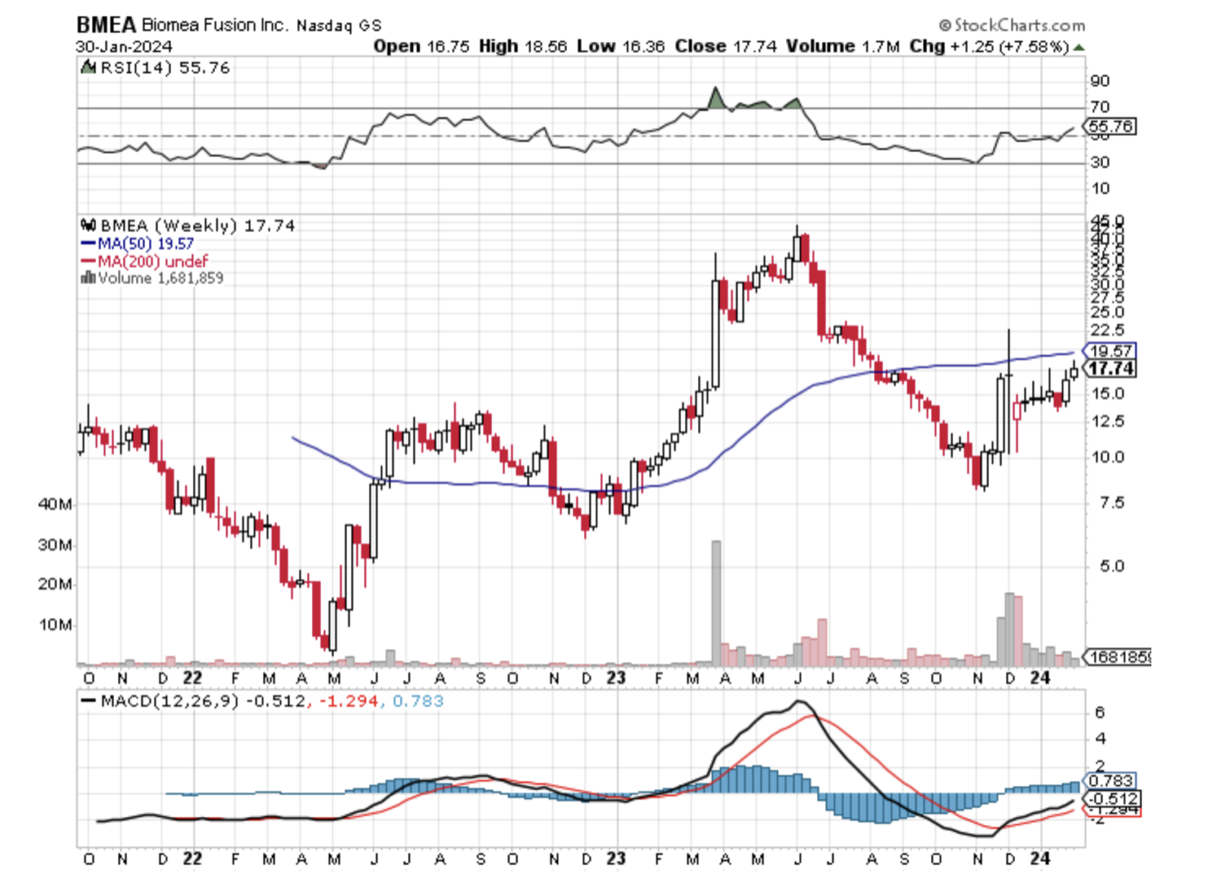
Biomea Fusion (BMEA) has been given more than a 200% upside to the average price target and a 75% rating from analysts.(Citi gave it more than 800% upside last November, as the bank remarked that its treatment therapies had “potential advantages” over others.
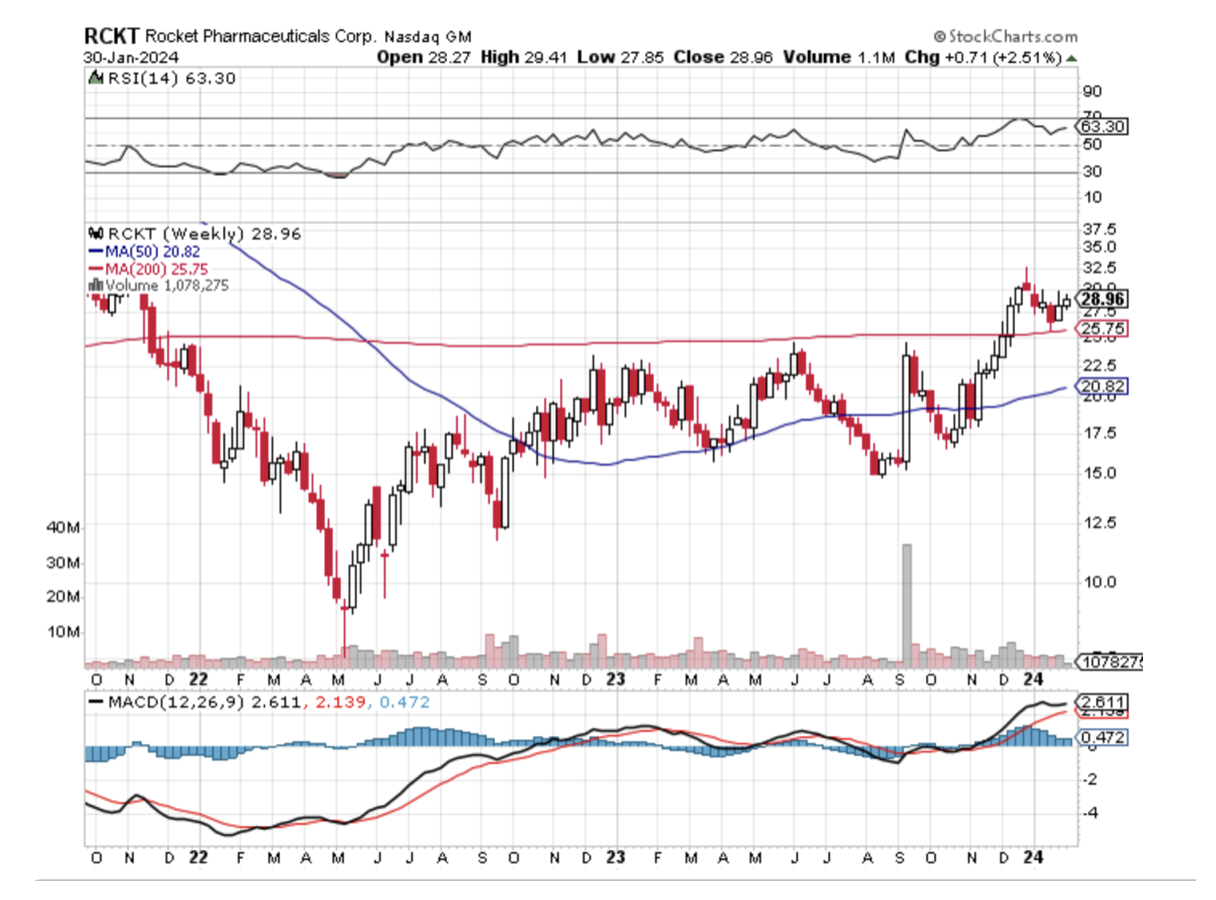
Another three stocks here drew 100% buy ratings from analysts: Ardelyx (ARDX), Cabaletta Bio (CABA), and Rocket Pharmaceuticals (RCKT).Of these, RCKT got the highest potential upside of 81.4%
Here is a brief description of just a few of these stocks that I like:
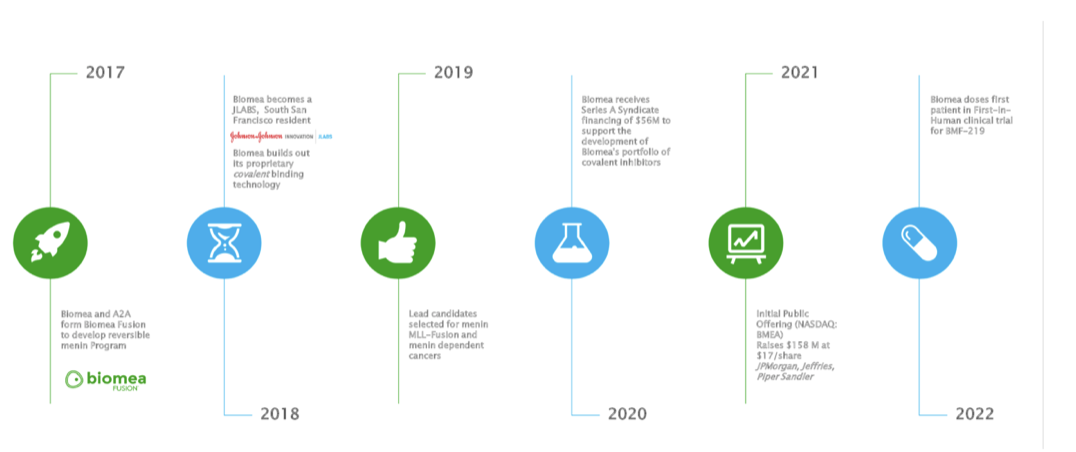
Biomea Fusion (BMEA) (Stock price:$17.74)
A biopharmaceutical company focused on the discovery and creation of novel covalent small molecules to treat patients with genetically defined cancers.Their mission is to create therapies that cure patients of their diseases.Thomas Butler co-founded Biomea Fusion in August 2017.He is CEO and a member of the Board of Directors.Analysts’ ratings put the company near the top of the Biotech industry.The name biomea derives from the Greek word bios meaning “life” and the Latin word mea meaning “my”.
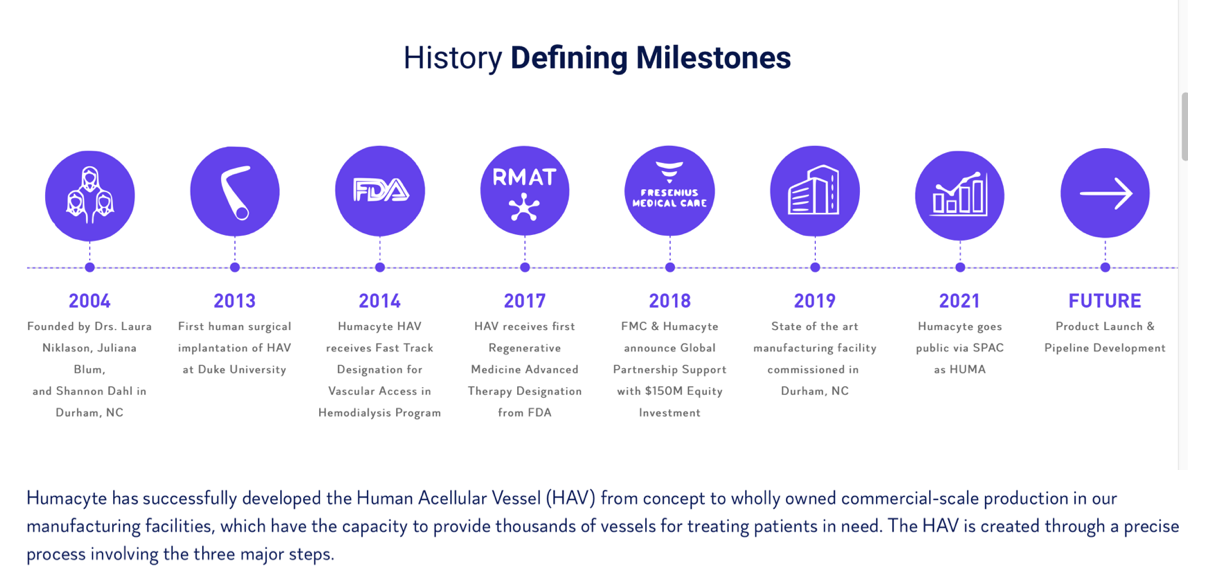
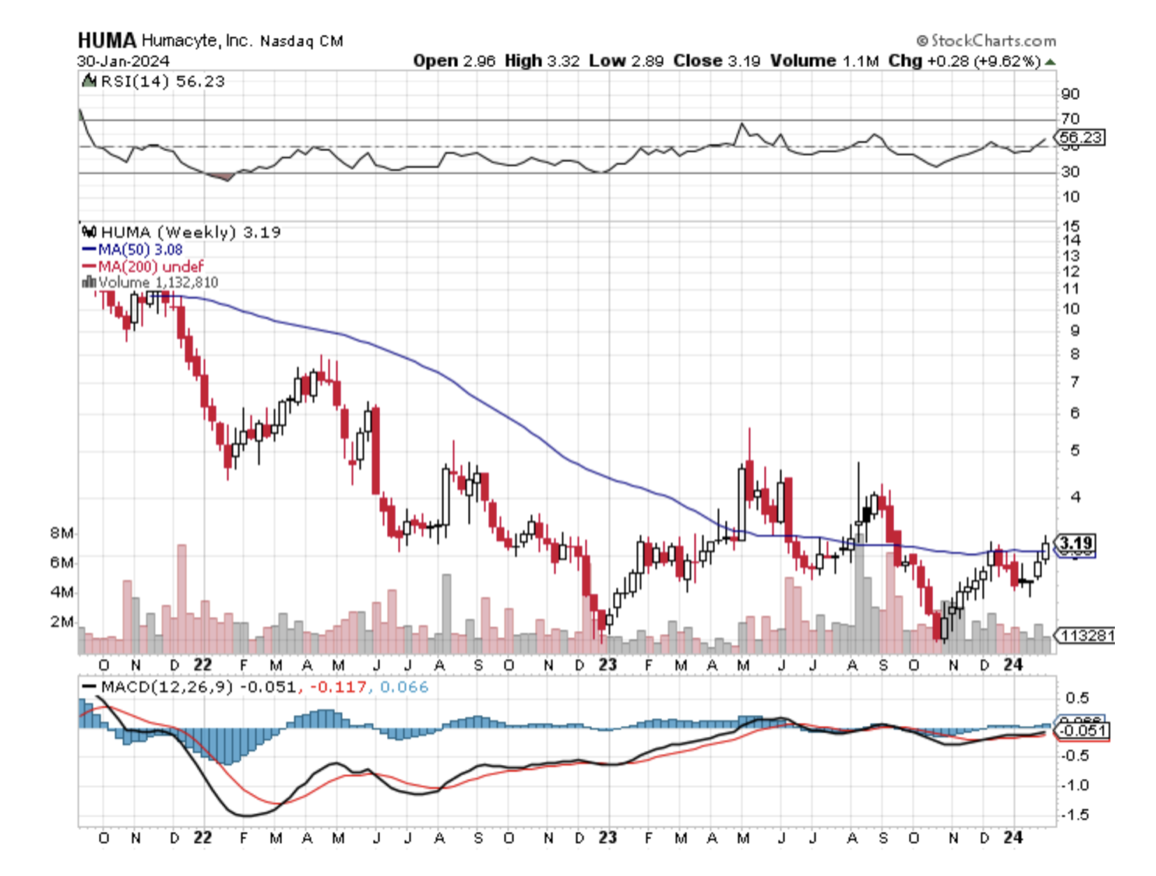
Humacyte (HUMA)(Stock Price: $3.19)
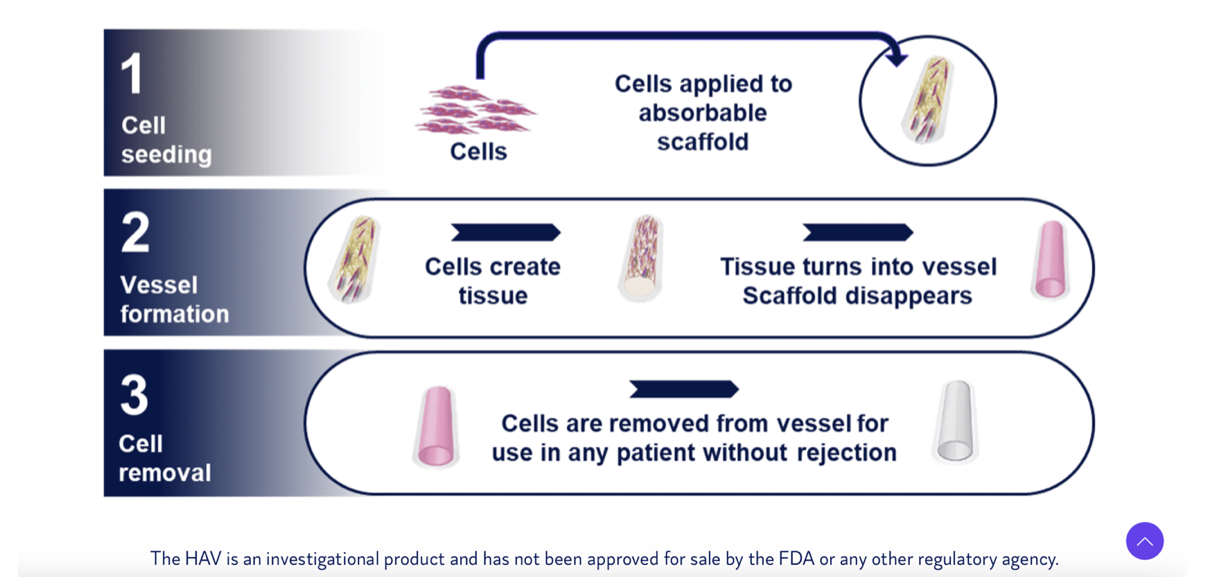
This company is involved in the manufacture of human acellular matrix products for vascular and non-vascular applications.It offers its products to the cardiovascular, cosmetic, soft tissue reconstruction, neurosurgical, and orthopedic markets.The company was founded by Laura E. Niklason and Juliana L. Blum on October 13, 2004, and is headquartered in Durham, NC.
On average, Wall Street analysts predict that HUMA’s share price could potentially reach $7.75 by Dec 27, 2024.The average HUMA stock price prediction forecasts a potential upside of 170.98% from the current share price of $2.91.
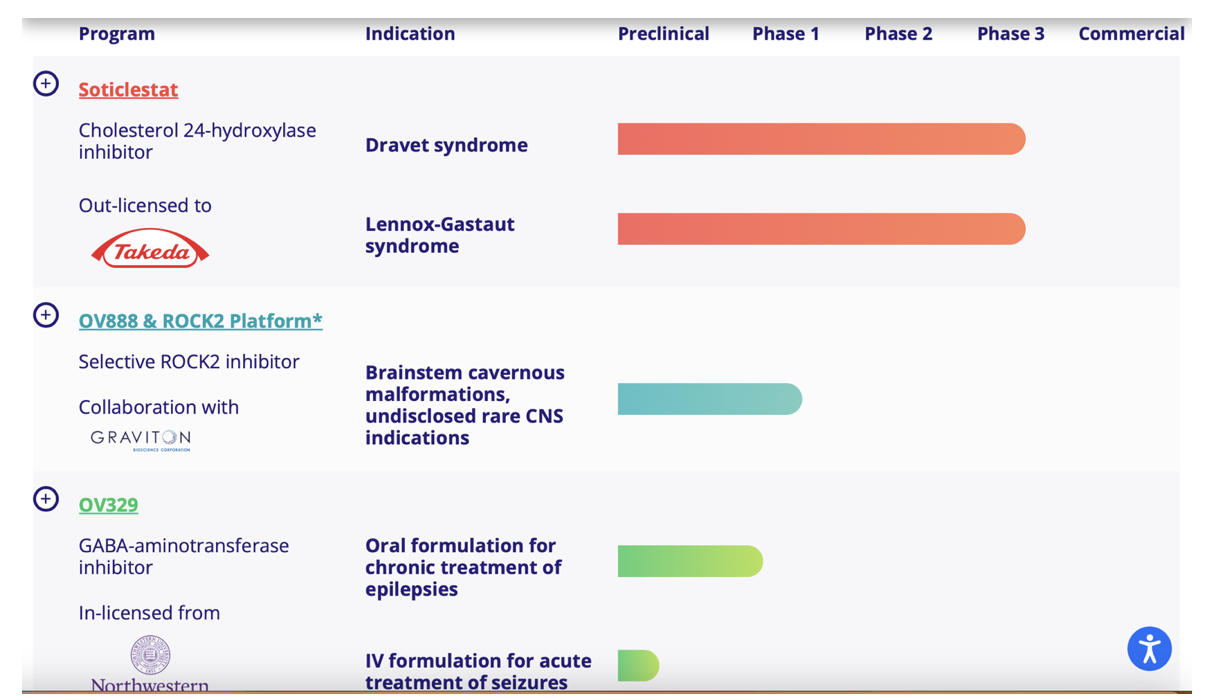
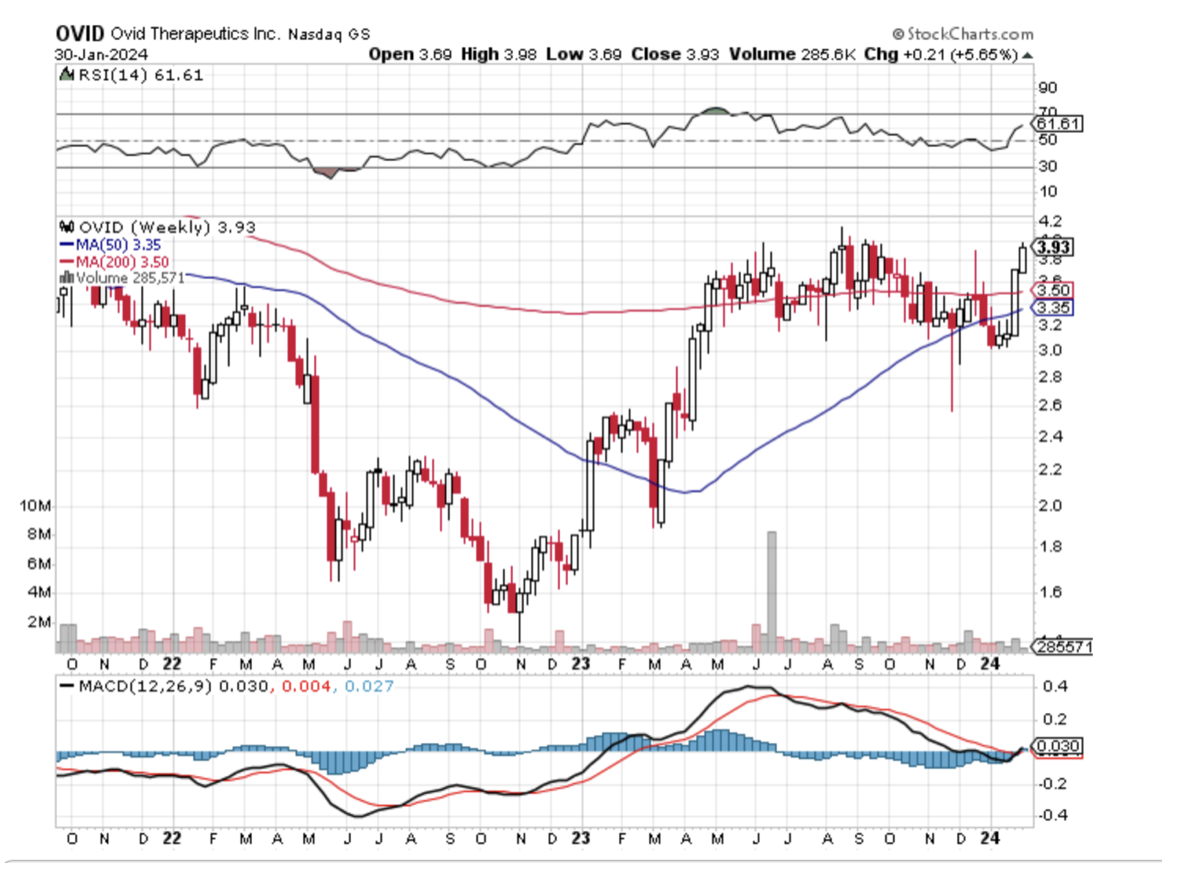
Ovid Therapeutics (OVID) (Stock Price: $3.93) is a New York-based biopharmaceutical company working towards providing treatments for rare neurological disorders.In other words, the company is looking to end epilepsy and seizures through the scope of science.The company is in the process of developing potentially small-molecule medicines that seek to drastically improve the lives of those affected by rare disorders with seizure symptoms.Jeremy Levin, D. Phil, MB BChir, is the chairman and chief executive officer of Ovid Therapeutics Inc.
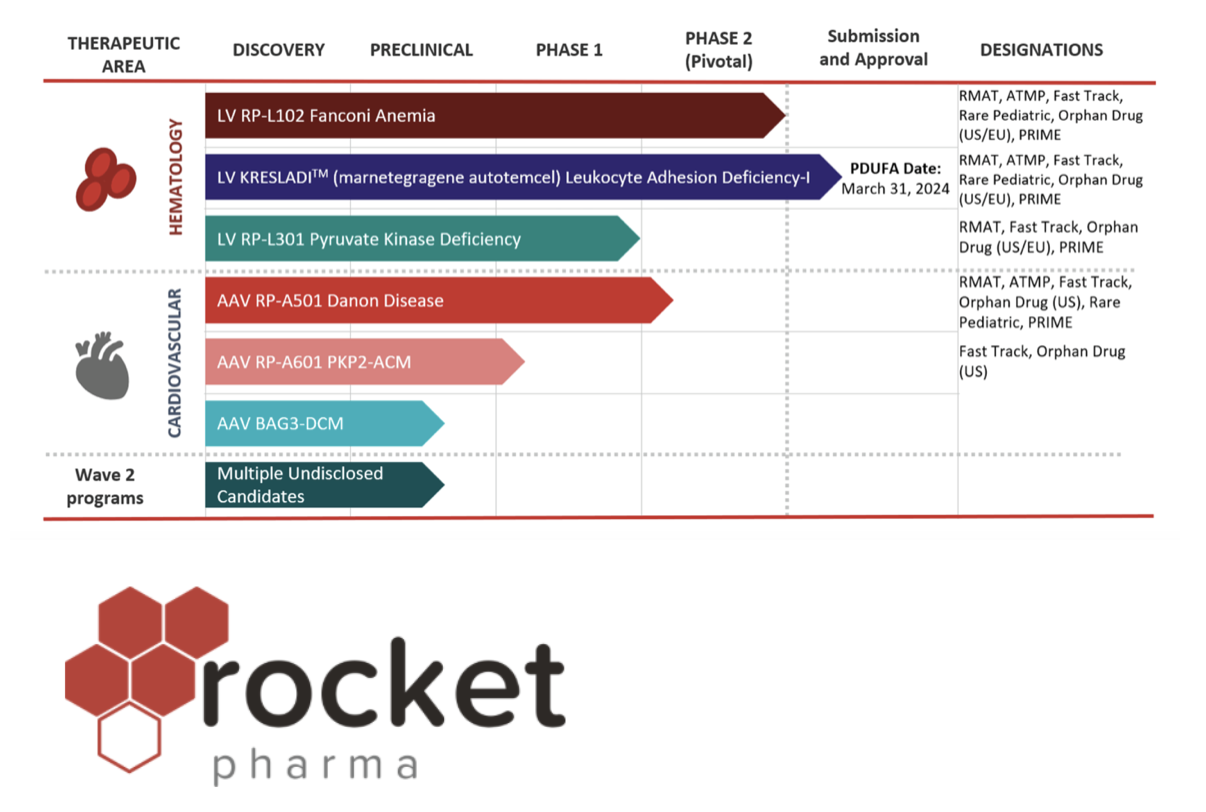
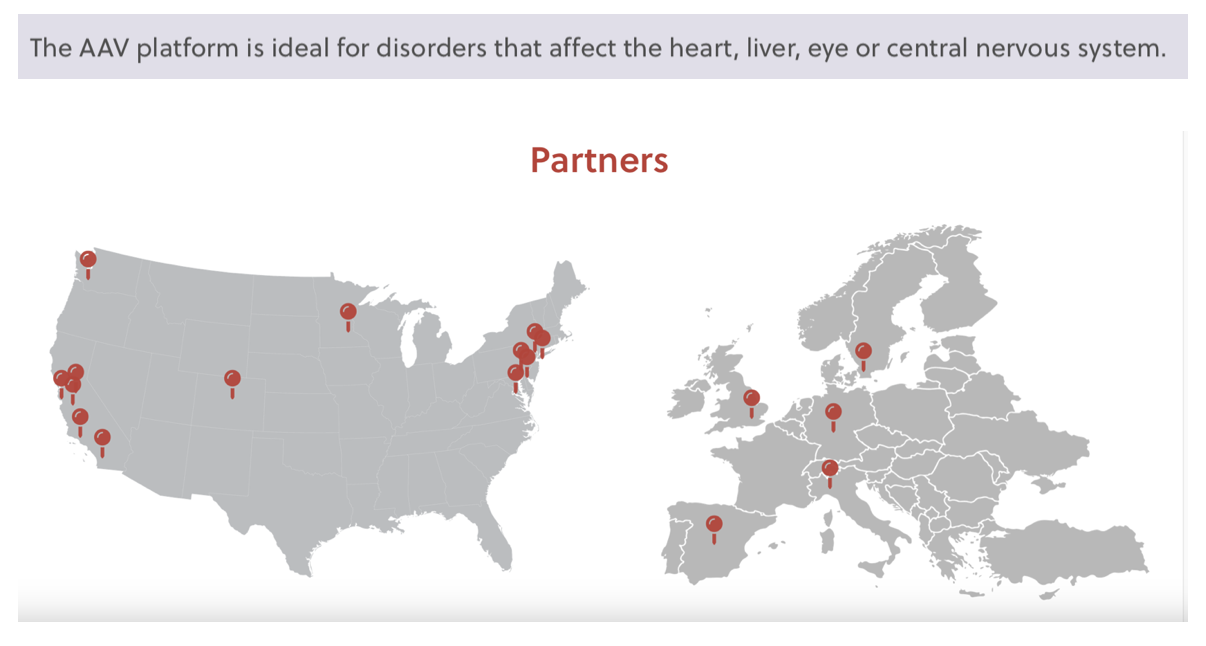
Rocket Therapeutics (RCKT) (Stock Price: $28.96) life mission is to develop gene therapies to cure patients with life-threatening diseases.The company has launched a multi-platform pipeline of treatments that directly target the genetic mutation in the affected cells for rare life-threatening disorders.
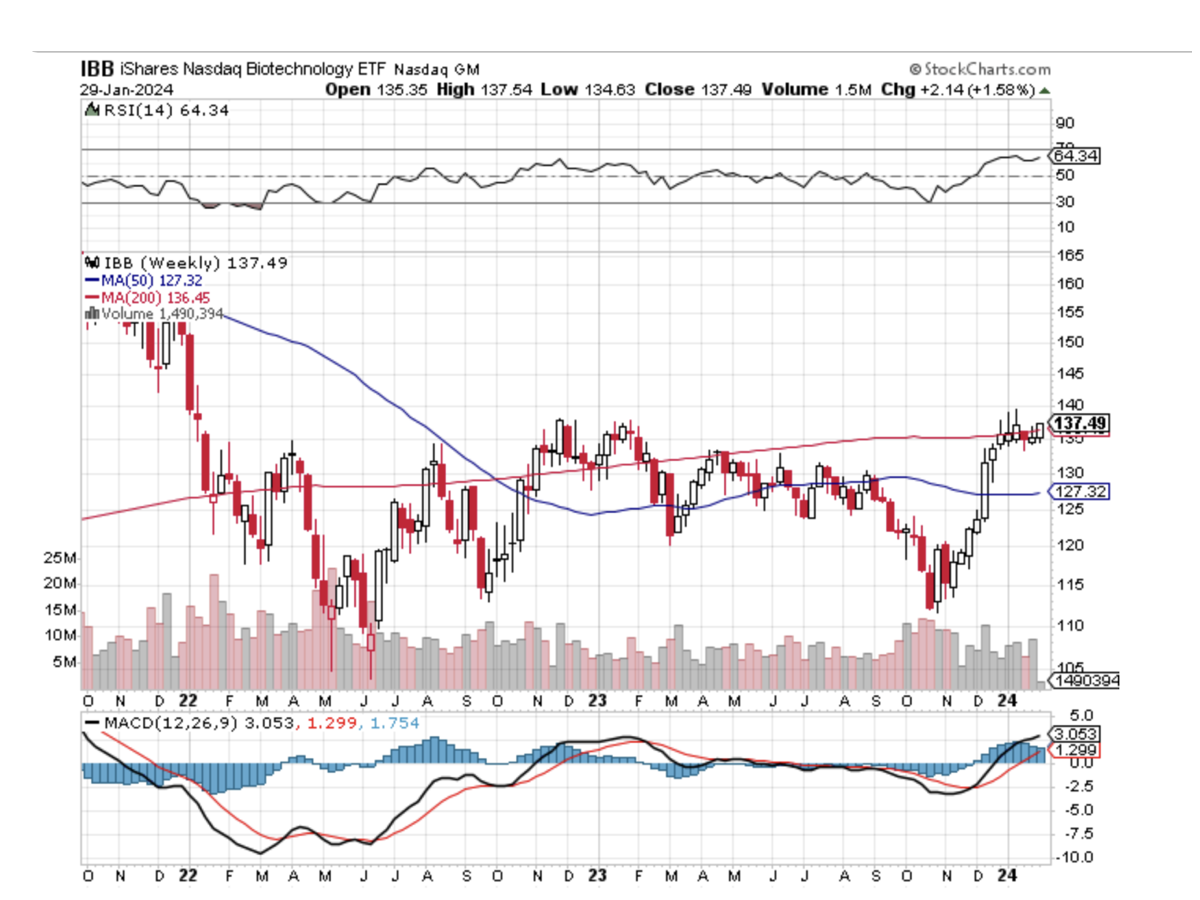
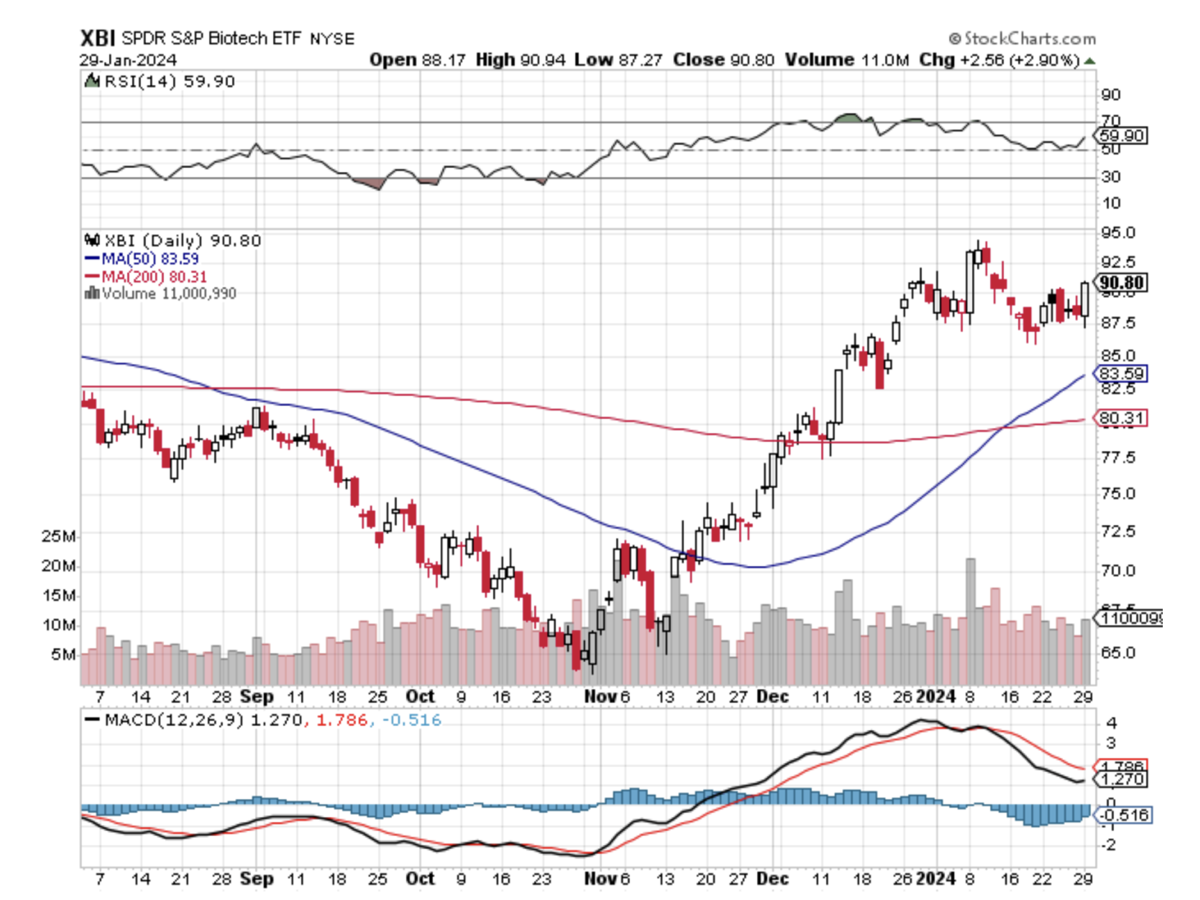
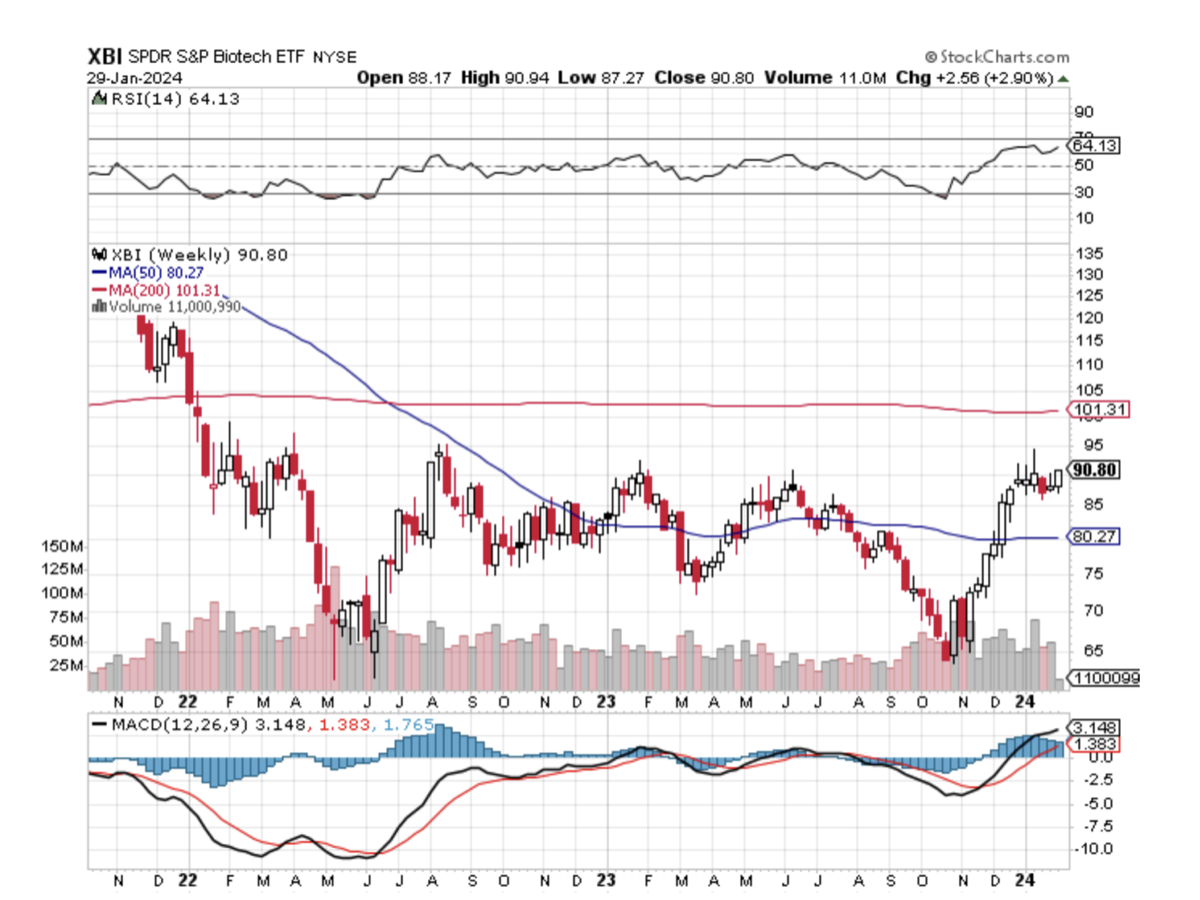
Biotech ETFs:
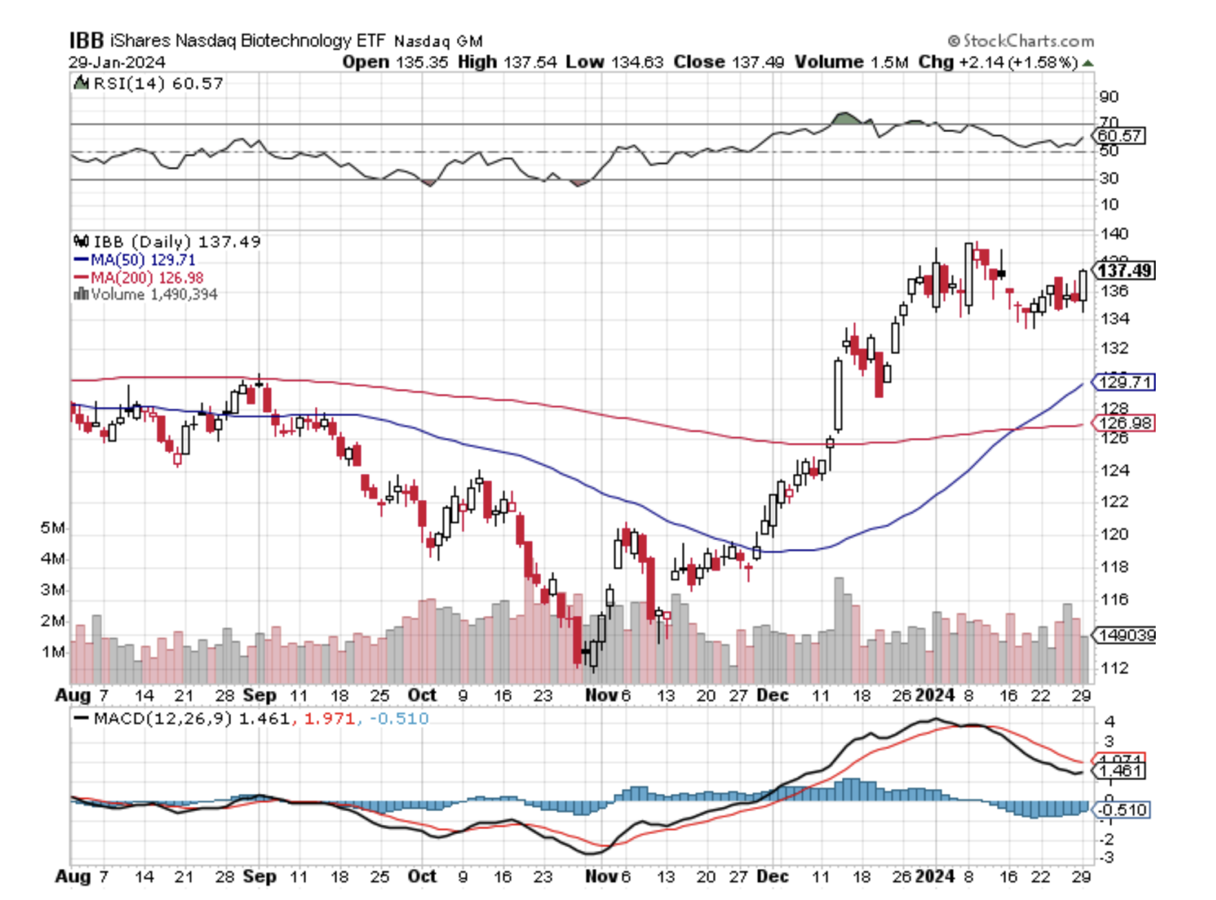
iShares Biotechnology ETF (IBB) or the SPDR S&P 500 Biotech ETF (XBI)
These ETFs hold a basket of shares, including those I have briefly described above. If you would like to invest in the biotechnology area, you can average in with small parcels in single stocks or purchase shares in an ETF for the long term.Biotechnology is an area that will lead to discoveries, development, and the manufacture of new therapies that can cure our modern-day diseases.
Now, I know many of you are on tenterhooks about earnings this week in the tech sector and how the Fed statement will influence the market and of course, we can’t forget the jobs report.
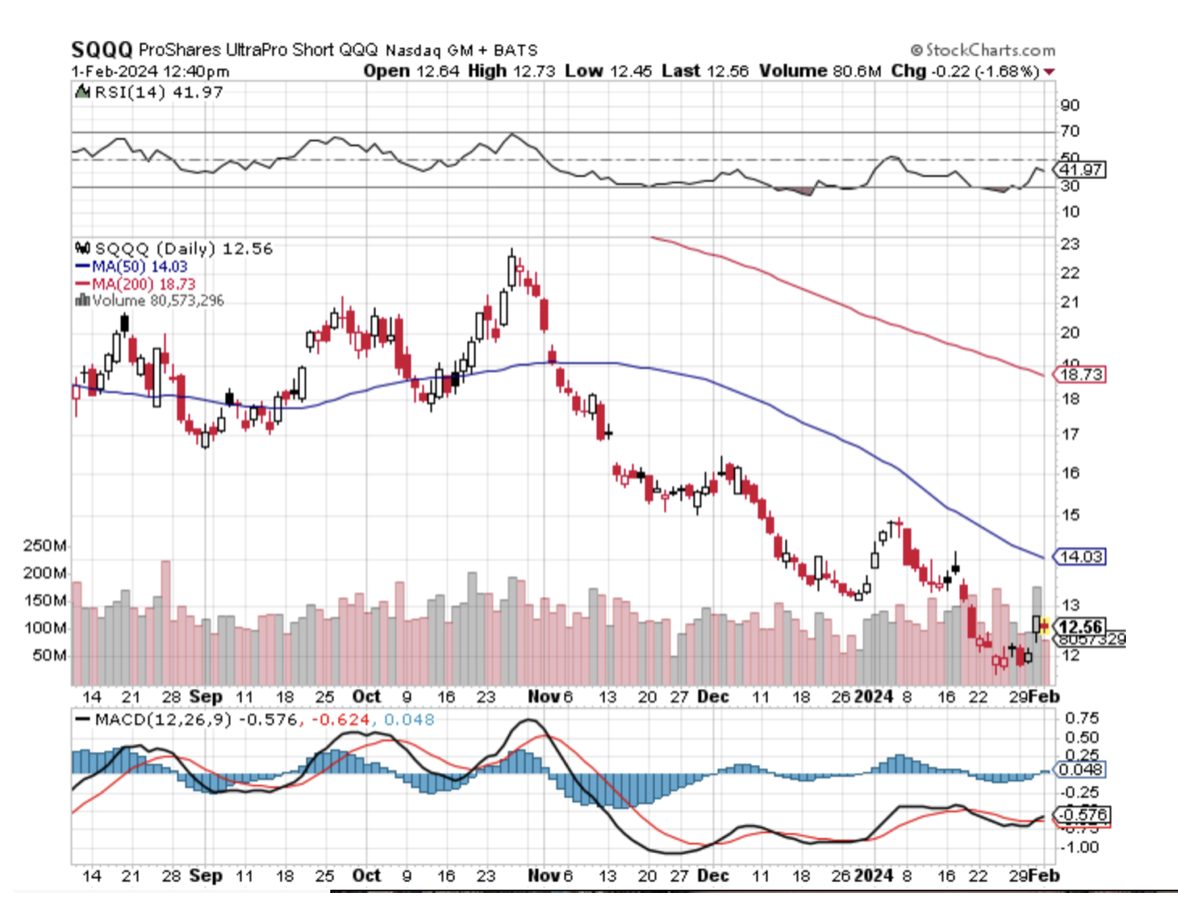
So, to calm any nerves about the market, I want to suggest you invest in a hedge, which will act like insurance on technology shares you own.In other words, if we have a disappointing tech earnings landscape and the market fizzles out, you will be protected.
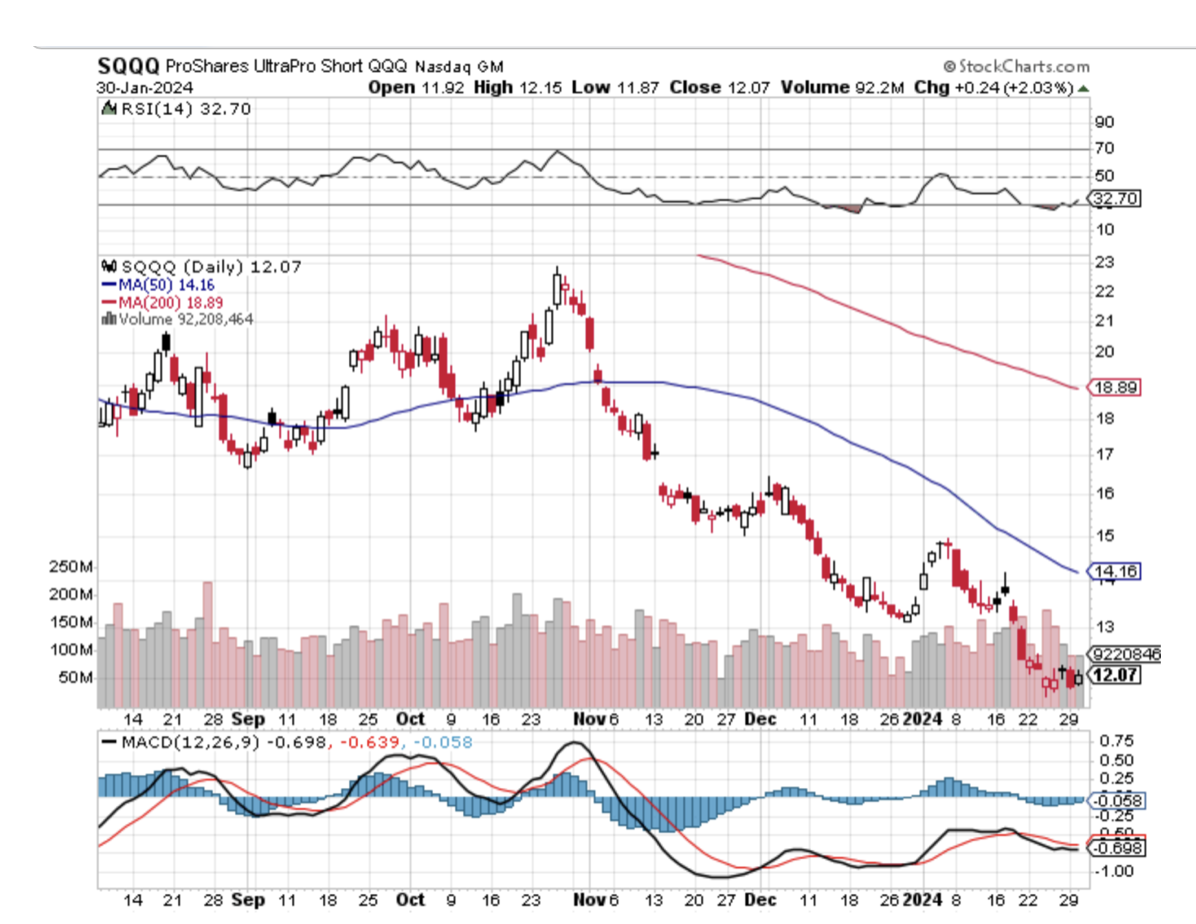
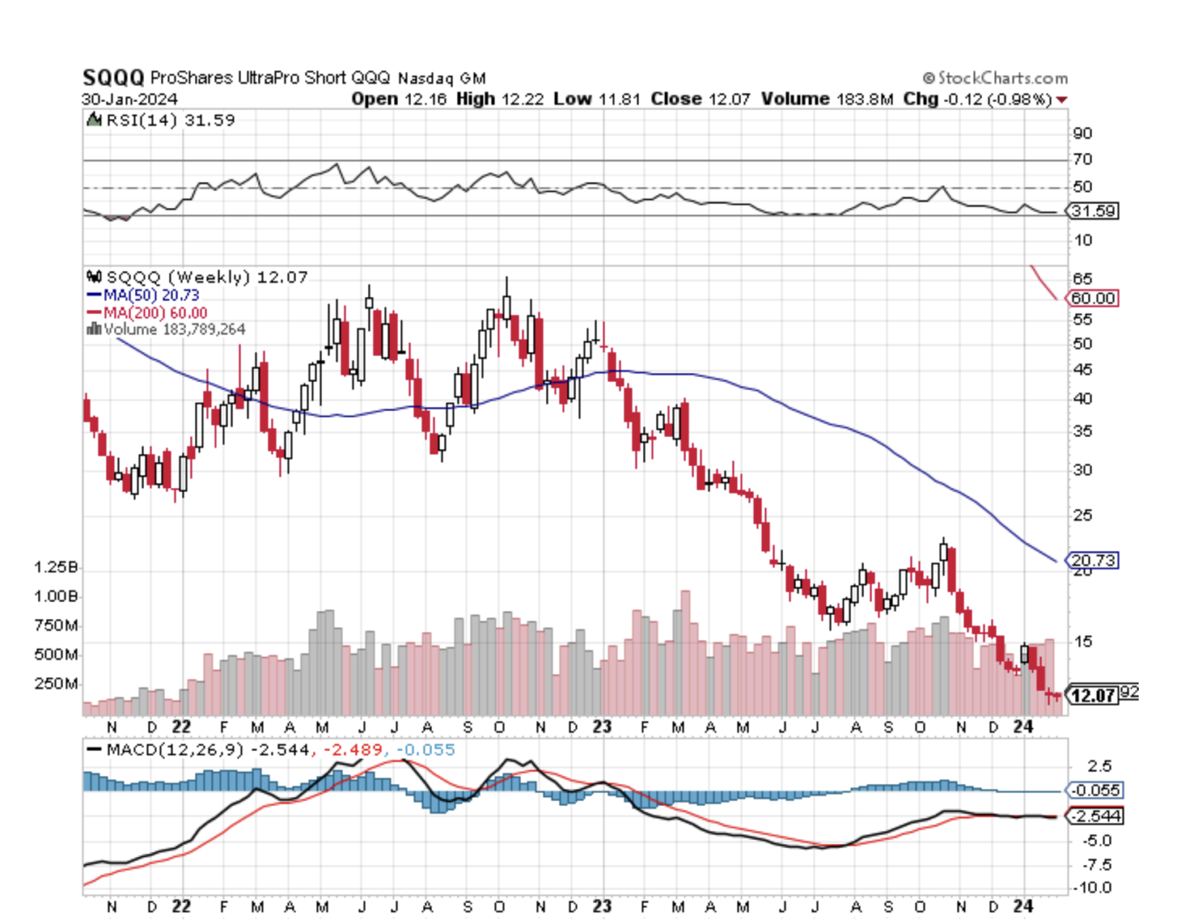
The stock I am suggesting you purchase is the SQQQ. It’s a 3X inverse ETF of the daily performance of the Nasdaq 100 Index.So, this ETF rallies when the Nasdaq falls.This will be a short-term hold just in case the Nasdaq falls this week.Please note that if the Nasdaq continues to rally this stock will go against you.It’s about buying umbrellas while it’s relatively sunny.
It’s up to you whether you purchase insurance and how many shares you buy.
Cheers,
Jacquie
Daily SQQQ chart
Weekly SQQQ chart
https://madhedgefundtrader.com/wp-content/uploads/2019/05/cropped-mad-hedge-logo-transparent-192x192_f9578834168ba24df3eb53916a12c882.png00april@madhedgefundtrader.comhttps://madhedgefundtrader.com/wp-content/uploads/2019/05/cropped-mad-hedge-logo-transparent-192x192_f9578834168ba24df3eb53916a12c882.pngapril@madhedgefundtrader.com2024-01-31 11:00:332024-01-31 10:19:02SQQQ Trade Alert - January 31, 2024
Earnings: Marathon Petroleum, United Parcel Service, General Motors, Pfizer, Advanced Micro Devices, Alphabet, Starbucks, Microsoft.
Wednesday, Jan 31
8:15 a.m. ADP Employment Survey (January)
8:30 a.m. ECI Civilian Workers (Q4)
9:45 a.m. Chicago PMI (January)
2:00 p.m. FOMC Meeting: Previous 5.5%
2:00 p.m. Fed Funds Target Upper Bound
Earnings: Boeing, Mastercard, Qualcomm
Thursday, Feb 1
8:30 a.m. Continuing Jobless Claims (1/20)
8:30 a.m. Initial Claims (1/27)
8:30 a.m. Unit Labour Costs preliminary (Q4)
8:30 a.m. Productivity preliminary (Q4)
9:45 a.m. Markit PMI Manufacturing final (January)
10:00 a.m. Construction Spending (December)
10:00 a.m. ISM Manufacturing (January)
UK Interest Rate Decision
Previous: 5.25%
Time: 7:00 am ET
Earnings: Meta Platforms, Amazon, Apple, Royal Caribbean, Clorox.
Friday, Feb 2
8:30 a.m. Jobs report (January) Previous: 216k.
10:00 a.m. Durable Orders (December)
10:00 a.m. Factory Orders (December)
10:00 a.m. Michigan Sentiment final (January)
Earnings: Chevron, Exxon Mobil
All eyes will be on Wall Street this week.
Earnings season is well and truly upon us and most of the so-called Magnificent Seven are reporting this week. (Alphabet, Apple, Amazon, Meta Platforms, Microsoft)
The latest Federal Reserve monetary policy decision is heard on Wednesday. Investors believe the Fed will keep rates on hold, and there now seems to be an expectation that any rate cut won’t be delivered until June. By that time, we are likely to have softer inflation numbers and even more softening in the labor market. The data is continuing to confirm the downside trend in inflation.
Jobs Report on Friday. This will clue us all in on whether the labor market is continuing to cool, and Friday’s report is expected to confirm this. The unemployment rate is expected to have ticked up to 3.8%, from 3.7% previously.
Investors are seeking signs of a broadening rally this year, and there seems to be some palpable concern. What if the broader market doesn’t catch up to the mega-cap stocks? Is this an indication that the rally won’t last? Have the mega-caps run too hard too fast on artificial intelligence dreams? Let’s patiently wait for the reports. I am still confident in the bull market – long-term.
All eyes on the earnings picture.
Earnings aside for a moment.
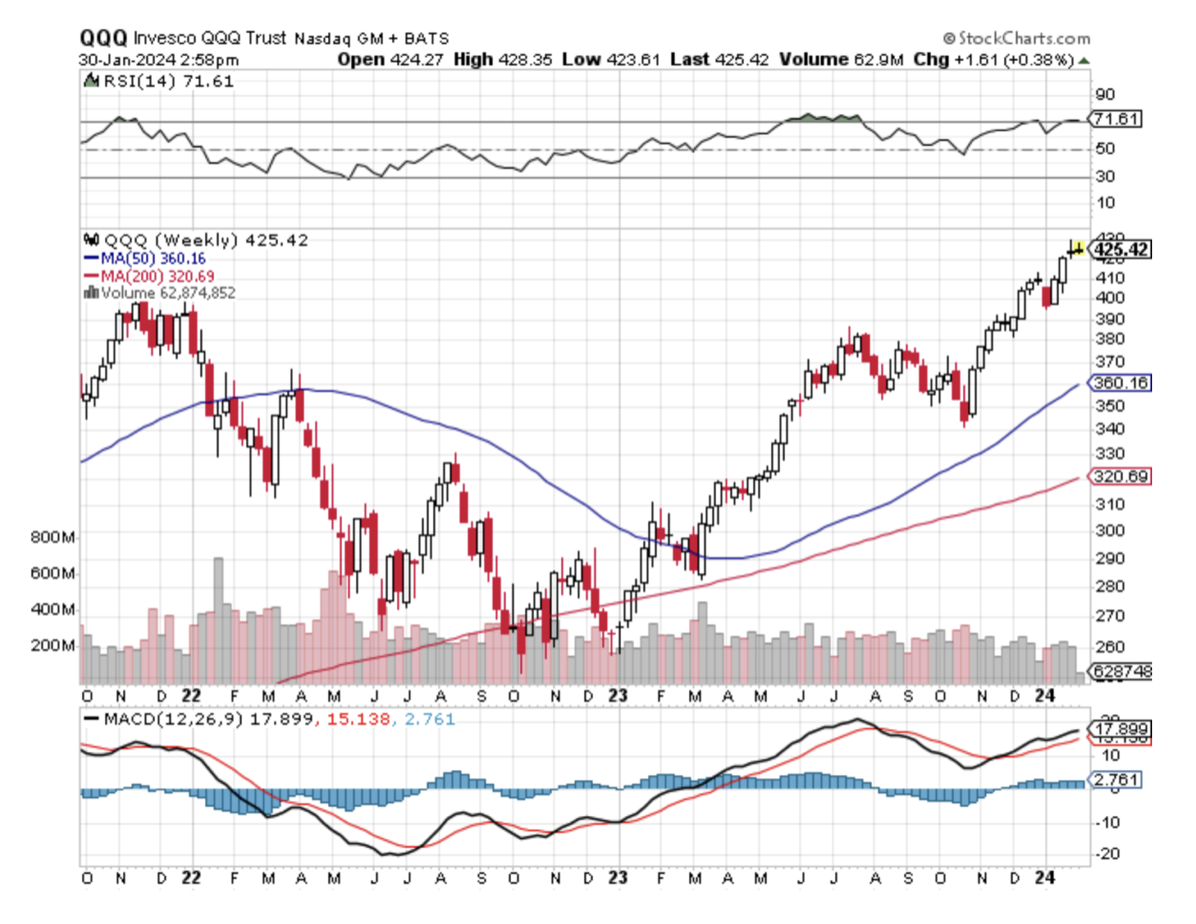
We all know the Magnificent 7 has been all the rage lately.But there are other technology stocks worthy of our attention.The Invesco NASDAQ Next Gen 100 ETF (QQQJ) tracks the next biggest 100 Nasdaq stocks after the Nasdaq 100 – Nasdaq stocks Nos: 101 to 200.This ETF shows a good technical setup.
If stocks are to track higher from here, the areas that haven’t broken out yet could very well play catch up.I’m talking about areas within technology, but also other sectors as well.
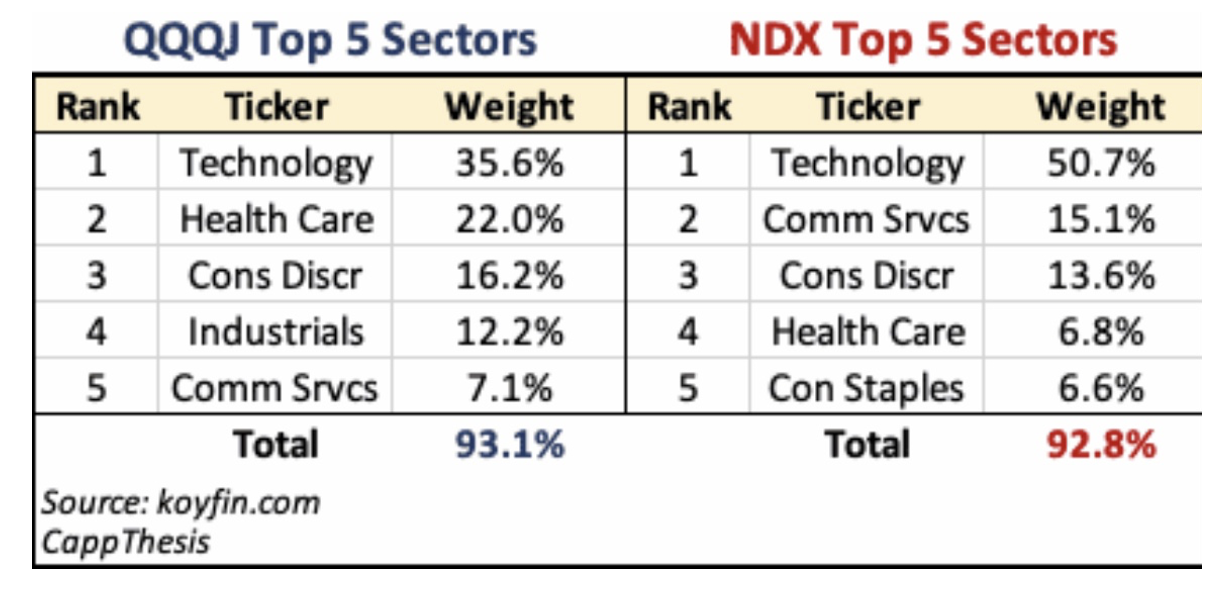
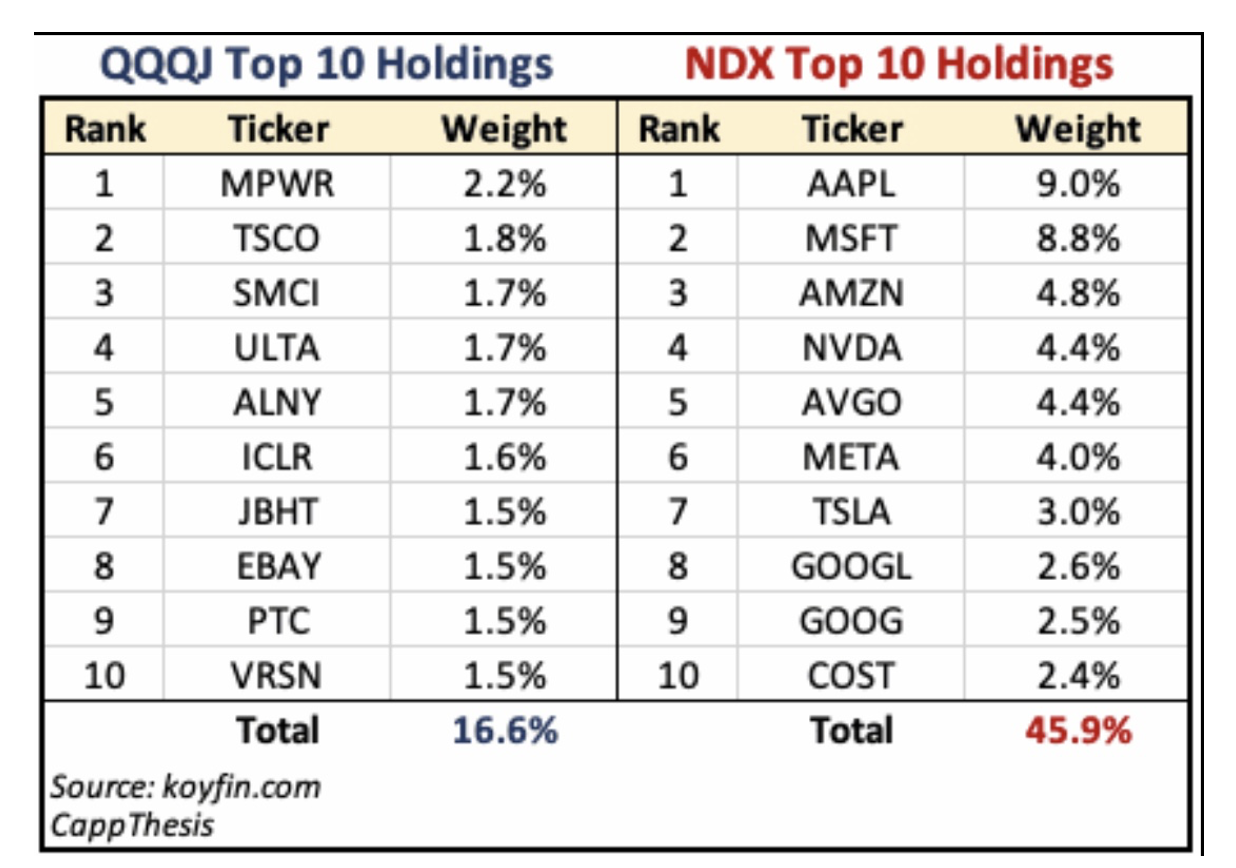
Let’s look at the (QQQJ) holdings and see how it compares to the Nasdaq 100 (NDX)
The QQQJ and the NDX (Nasdaq 100) are similar in a few ways.
# Technology is their biggest weight for both.
# The top five sectors represent 90% of both.
But as you can see from the chart here the NDX is very top-heavy and the QQQJ is not.
Six stocks in the NDX have weightings of at least 4%, while the biggest weight in QQQJ is MPWR at 2.2%. The top 10 NDX stocks represent nearly 46% of the entire index. The top 10 within QQQJ are just 16%. So, we could easily argue that QQQJ gives investors a more balanced exposure to its holdings than QQQ does.
OK, I imagine some of you might not know what the QQQJ ticker symbols stand for, so here is a quick brief.
MPWR Monolithic Power Systems
TSCO Tractor Supply Co.
SMCI Super Micro Computer Inc.
ULTA Ulta Beauty Inc. (largest beauty retailer in the U.S.)
ALNY Alnylam Pharmaceuticals Inc.
ICLR ICON PLC. (Irish headquartered Nasdaq listed multinational healthcare intelligence and clinical research organization that provides consulting, clinical development, and commercialization services for the pharmaceutical industry.)
JBHT J.B. Hunt Transport Services
EBAY eBay Inc.
PTC PTC Inc. (helps companies achieve their digital transformation goals)
VRSN Verisign Inc. (based in Virginia U.S. & operates a diverse array of network infrastructure & is a provider of domain name registry services.
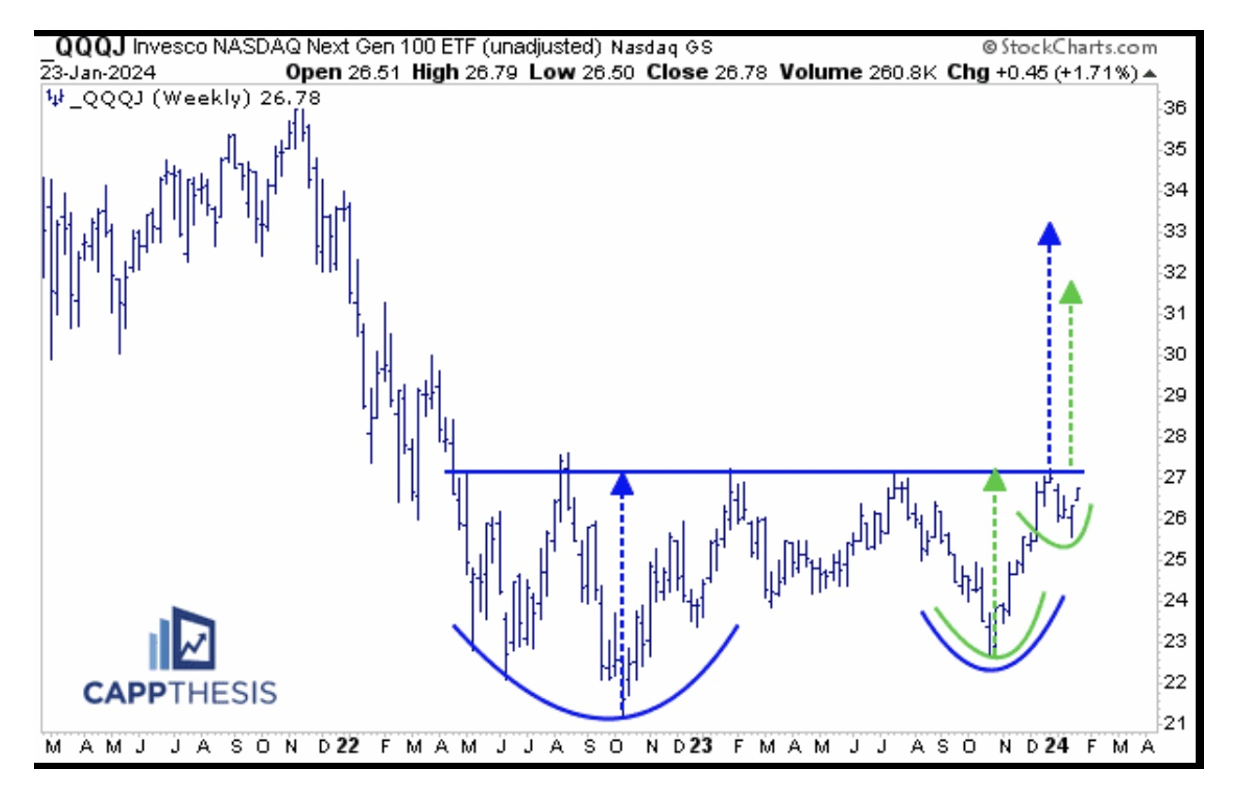
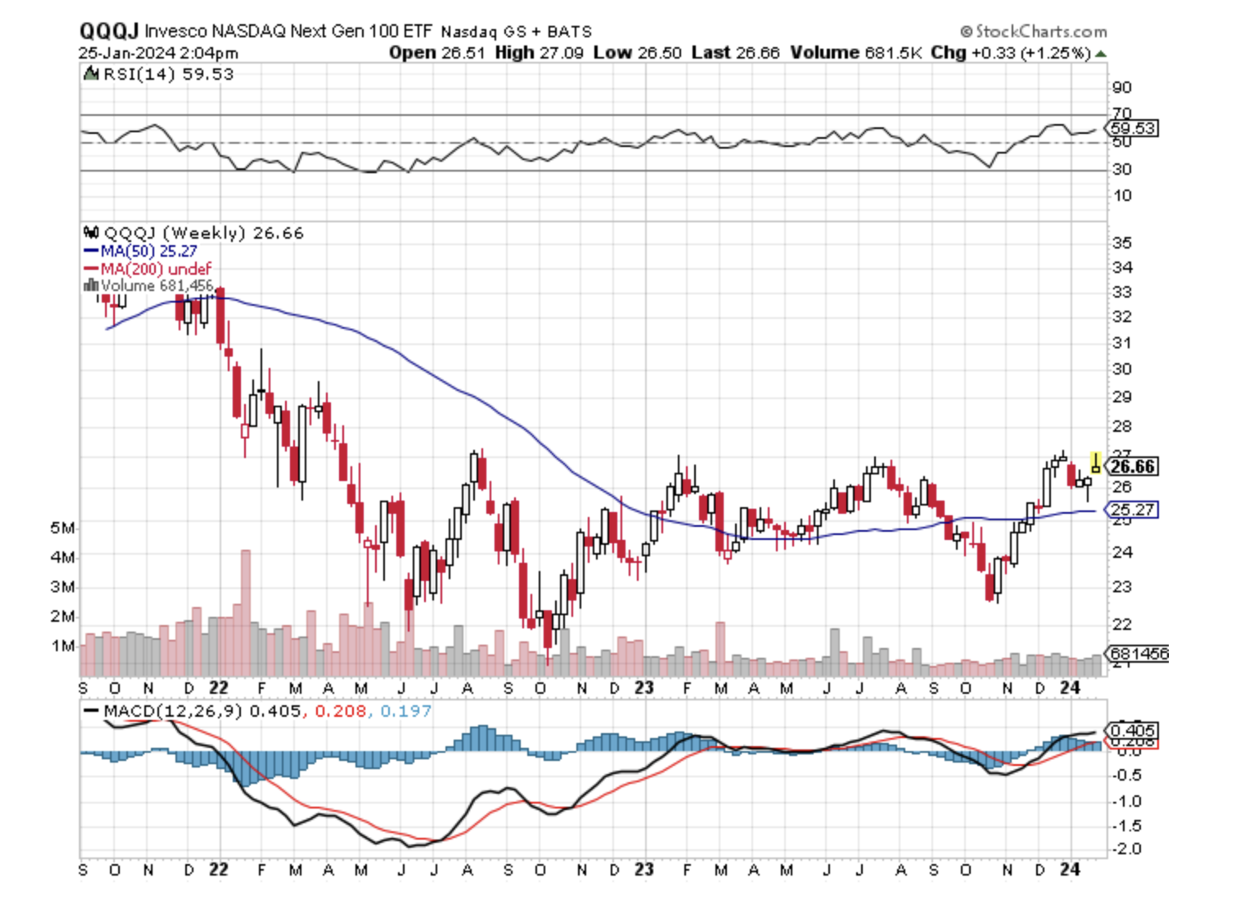
So, now we have a bit of background, let’s talk about the chart patterns – the technical setup.
The QQQJ is looking very attractive here and could be close to a breakout through a multi-year trading range. This pattern – which represents a bullish cup and handle – dates all the way back to the spring of 2022 (blue). Because of the range being so extended, another bullish formation has taken shape within it: a second cup and handle pattern that started at the July ’23 high (green). On the chart here the upside targets are near 33 and 32, respectively. Buy a small parcel of the ETF and hold for an upside breakout.
A Mackay patrolled beach.
A Coolangatta (Gold Coast) patrolled beach
Cheers,
Jacquie
“Success is not to be pursued; it is to be attracted by the person you become.” - Jim Rohn
There is a very high degree of risk involved in trading. Past results are not indicative of future returns. MadHedgeFundTrader.com and all individuals affiliated with this site assume no responsibilities for your trading and investment results. The indicators, strategies, columns, articles and all other features are for educational purposes only and should not be construed as investment advice. Information for futures trading observations are obtained from sources believed to be reliable, but we do not warrant its completeness or accuracy, or warrant any results from the use of the information. Your use of the trading observations is entirely at your own risk and it is your sole responsibility to evaluate the accuracy, completeness and usefulness of the information. You must assess the risk of any trade with your broker and make your own independent decisions regarding any securities mentioned herein. Affiliates of MadHedgeFundTrader.com may have a position or effect transactions in the securities described herein (or options thereon) and/or otherwise employ trading strategies that may be consistent or inconsistent with the provided strategies.