When John identifies a strategic exit point, he will send you an alert with specific trade information as to what security to sell, when to sell it, and at what price. Most often, it will be to TAKE PROFITS, but, on rare occasions, it will be to exercise a STOP LOSS at a predetermined price to adhere to strict risk management discipline.Read more
https://www.madhedgefundtrader.com/wp-content/uploads/2016/02/Alert-e1457452190575.jpg135150Mad Hedge Fund Traderhttps://madhedgefundtrader.com/wp-content/uploads/2019/05/cropped-mad-hedge-logo-transparent-192x192_f9578834168ba24df3eb53916a12c882.pngMad Hedge Fund Trader2023-06-09 09:56:182023-06-09 10:56:46Jacquie's Post Trade Alert - (FCX) June 9, 2023 - BUY
We all know how important water is. To begin with, we as human beings, consist of 55-60% water. We are always told to drink more water to maintain better health.
What we might not fully realize is the significance of water, not only for ourselves, but also for our ecosystem, our economy, and our planet.
We can benefit physically and financially by investing in it.
But how do we invest in water?
Water is already traded on the financial markets, but does it make sense for you to invest in this resource?
Let’s see…
Water is a commodity, like gold, oil, wheat, or sugar.
So, it can be traded and like other commodities, the price can fluctuate depending on supply and demand. Research shows that the supply of water could begin to decrease in the next decade, which means demand will increase exponentially.
And what will that mean?
You guessed it.
The price of water goes up.
And the water crisis keeps getting worse.
So, what can you do?
You can invest in companies that deal with recycling water and water efficiency.
One managed fund is the Pictet Clean Water Fund – where you can profit from water as an investment opportunity.
OK, we all know how supply and demand works, - Economics 101.
For example, if there is a drought and there is a low wheat harvest due to drought or extreme weather events, the supply goes down. In the economy, in general, there will be more demand, than supply which makes the price go up. As water is a commodity, we can see the same thing. There are supply and demand issues here as well.
Let’s ask a critical question?
How much water do we have on Earth?
And can we meet the demand without major problems?
We must wrap our heads around the fact that only 3% of the water on the planet is freshwater – which humans can consume. The rest of it, 97% is too salty to drink or to use for agriculture.
Glaciers hold around 2.5% of freshwater, which is inaccessible to humans.
So, when you think about it, there is not that much water available.
And, like it or not, climate change, is threatening our supply.
How?
Extreme weather events – which are increasing – are threatening the availability of cleanliness of water.
Rising sea levels impact the supply of fresh water. As ocean levels rise, freshwater becomes salty water.
The impact…
Water prices will rise in the future as less supply = higher prices.
As the world population grows to almost 10 billion in 2050 and the increased wealth of that population demands far more luxury foods, such as meat, the value of water will be highlighted.
Consider that it takes 15,415 litres/1 kg = a single T-bone steak.
So, you are looking at two Olympic swimming pools to produce the meat from just one cow.
Or think about your cup of coffee. For 1kg of coffee beans, you need 18,900 litres of water.
As more and more people become part of the middle class in countries such as China and India, you can begin to imagine the demands on water, as a resource.
Agriculture and food take up 69% of the world’s water resources now.
Scarcity will make water more valuable.
England has announced that by 2050 domestic demand could exceed supply by up to 3.1 billion litres/day.
NASA has discovered that 21 out of 37 of the world’s aquifers are currently being depleted.
Other freshwater sources are being polluted.
The Chinese government admits that 80% of the country’s surface groundwater is not fit for drinking, while 90% of groundwater in urban areas is contaminated and 40% of its rivers are too polluted to use for either agricultural or industrial use.
By 2025, it’s estimated that 66% of the world will live in water-stressed areas according to the World Resources Institute.
A 40% gap between supply and demand will emerge over the next 15 years.
Water has always been important. Even Dwight Eisenhower remarked that “among these treasures of our land is water, fast becoming our most valuable, most prized, most critical resource.”
Opportunities and Solutions
Exploration - helps uncover new aquifers and sources of water.
Efficient wastewater management.
The Middle East is choosing new purification technologies, such as graphene desalination, a process that turns deserts into irrigated farmland.
Aeroponic indoor farming uses 90% less water.
Smart metres to know how much water we are using.
Upgrade existing infrastructure networks – ease water loss and improve delivery.
Invest in water-rich farmland (which is Michael Burry’s (of “The Big Short”) way of investing in water. He says that it became “clear to me that food is the way to invest in water. That is, grow food in water-rich areas and transport it for sale in water-poor areas.”
Research by Trucost suggests that more than half of the profits of the world’s biggest companies would be at risk if water was priced to reflect its true value.
Microsoft is one company that is aware of this issue. It is experimenting with putting its data centres beneath the ocean (to cool naturally).
The WHO has estimated that the economic returns of every $1.00 invested in water and sanitation is $4.50.
Individual shares, ETFs, and mutual funds are ways you can invest in this resource.
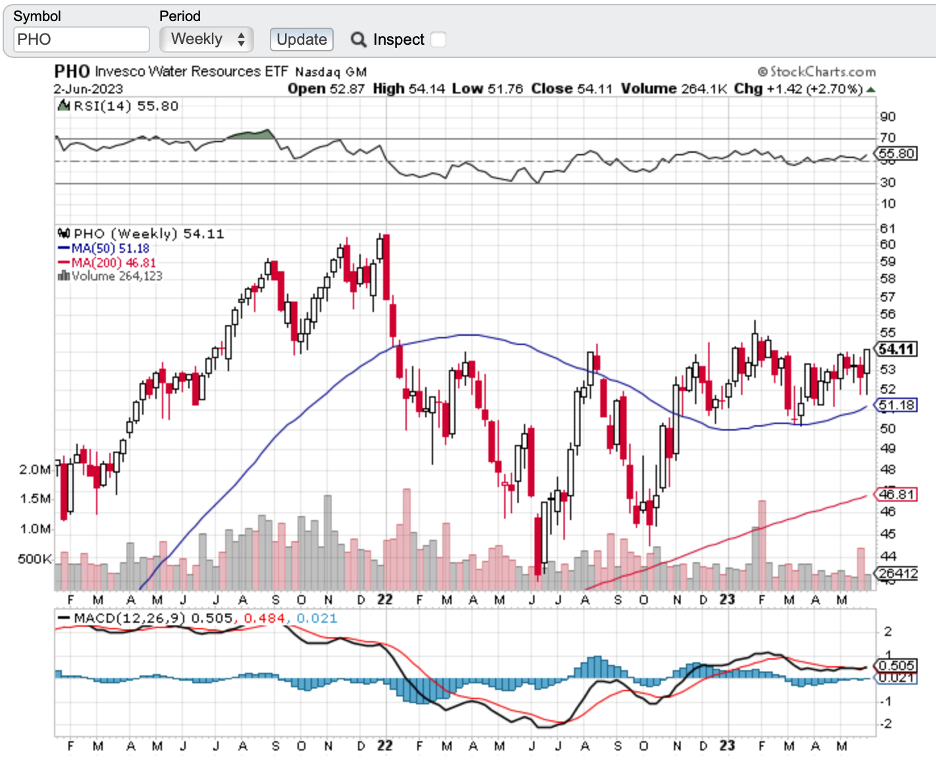
Have a look at (PHO), Invesco Water Resources ETF. On the weekly chart, it presents an inverted head and shoulders pattern, which should soon break to the upside.
Both John Thomas and I are expecting the commodities sector to be strong in the second half of the year and into next year.
Top 9 Holdings of (PHO)
Name:
American Water Works (AWK) 4.25%
A.O Smith Corp (AOS) 4.19%
Pentair PLC (PNR) 4.18%
Evoqua Water Technologies Corp (AQUA) 4.10%
Roper Technologies Inc (ROP) 8.52%
Ecolab Inc (ECL) 8.48%
Xylem Inc (XYL) 8.15%
Waters Corp (WAT) 3.89%
Danaher Corp (DHR) 7.71%
Investing in water is something to be seriously considered, with a long-term view to the future in mind.
Have a great week.
Cheers,
Jacquie
World Water Crisis – the World needs to wake up.
Friday, March 22nd, 2024.
https://madhedgefundtrader.com/wp-content/uploads/2019/05/cropped-mad-hedge-logo-transparent-192x192_f9578834168ba24df3eb53916a12c882.png00Mad Hedge Fund Traderhttps://madhedgefundtrader.com/wp-content/uploads/2019/05/cropped-mad-hedge-logo-transparent-192x192_f9578834168ba24df3eb53916a12c882.pngMad Hedge Fund Trader2023-06-07 20:00:182023-06-07 20:43:32June 7, 2023
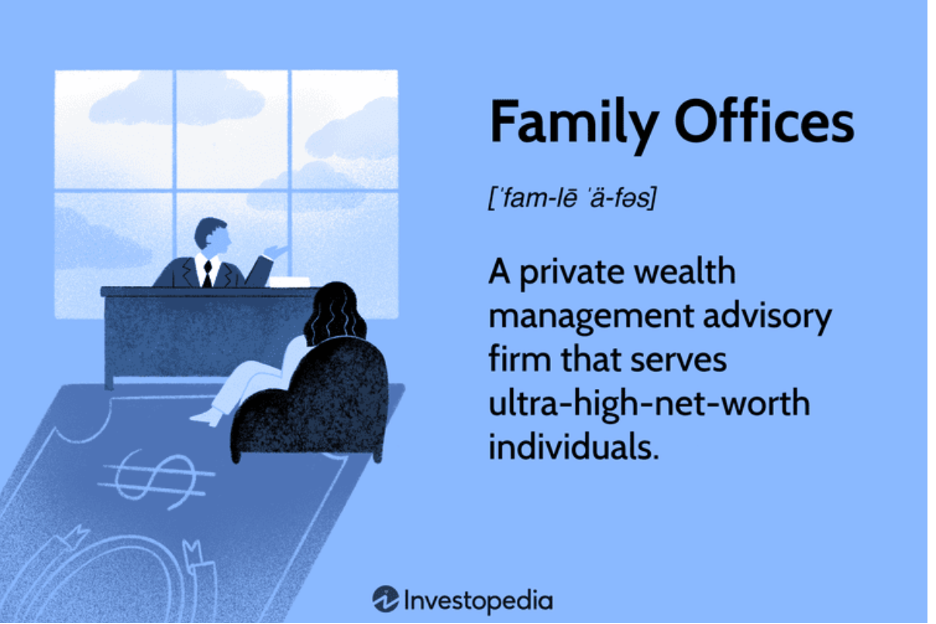
Do you ever wonder what Family Offices are doing with their funds?
Are they being conservative or aggressive in their choices?
Are they in bonds, stocks, real estate, gold, or currency trades, or all the aforementioned?
From my research, it seems that Family Offices are making shifts in their portfolios. A UBS survey conducted earlier this year polled 230 global family offices. The poll showed that more than one-third of family offices appear to be increasing their exposure to bonds, particularly high-quality, short-duration bonds. (Think 90-day T-bills) In the survey, the average net worth of participating families was $2.2 billion, and the average family office managed $900 million.
Charles Otton, head of UBS’ global family and institutional wealth business has stated that “developed market fixed income and government bonds are strongly attractive to family offices as they look to 2023 in a very different rate environment.”
As we are all aware the Federal Reserve has raised interest rates 10 times since March 2022, taking the federal funds rate to a target range between 5% and 5.25%, the highest since August 2007. Government bonds rapidly became an attractive asset for investors seeking steady income in a volatile market, and to hedge the risk from stocks.
There is no doubt that government bonds are safe. Why wouldn’t you want some certainty of steady income over a volatile stock market? The behaviour of people is becoming defensive – they are wanting to protect themselves with a stable fixed income.
Interestingly, the UBS survey also showed that family offices are also planning to migrate some funds to emerging markets. This is a play on the peak in the dollar and China’s economic reopening.
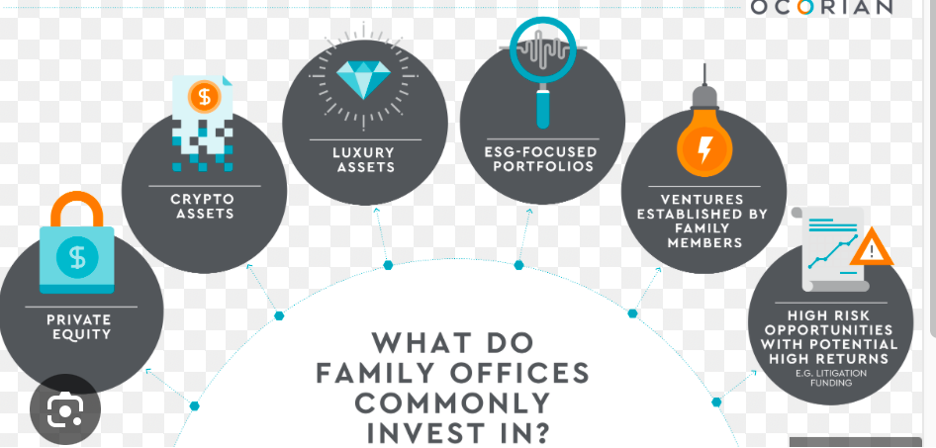
Another investment bank, Goldman Sachs, shared its findings in May, that 32% of family offices invest in digital assets.
This category includes cryptocurrencies, non-fungible tokens (NFTs), decentralized finance (DeFi), and blockchain-focused funds.
19% cited a belief in the power of blockchain technology.
8% cited the use of financial applications/DeFi.
9% cited portfolio diversification.
Please note, I am only showing the research here and am making no recommendations.
A recession is in the back of everyone’s mind. The aggressive moves by the Fed have put everybody on edge. Are we getting closer to a top in the market?
Duquesne Family Office’s Stanley Druckenmiller, for one, has been calling for a recession for a while. He believes the extraordinary quantitative easing and zero interest rates over the past decade have created an asset bubble, and markets are now in the final stage of it bursting.
I can see the market rallying a little further for now, but then I believe we are due a good correction.
Gold Update
It could be a volatile week with non-farm payrolls on Friday. Be careful.
Gold could rally up initially and then fall. There may be more downside before it starts to rally to new highs.
Oil Update
Could get down to around $62 and then rally.
Bond Update
If you are looking for somewhere safe to put some of your funds, both John Thomas and I would advise you to look at 90-day T-bills. Price on Wednesday was 5.35%.
I hope you all had a great weekend.
Cheers,
Jacquie
https://madhedgefundtrader.com/wp-content/uploads/2019/05/cropped-mad-hedge-logo-transparent-192x192_f9578834168ba24df3eb53916a12c882.png00Mad Hedge Fund Traderhttps://madhedgefundtrader.com/wp-content/uploads/2019/05/cropped-mad-hedge-logo-transparent-192x192_f9578834168ba24df3eb53916a12c882.pngMad Hedge Fund Trader2023-06-05 10:35:082023-06-05 11:43:47June 5, 2023
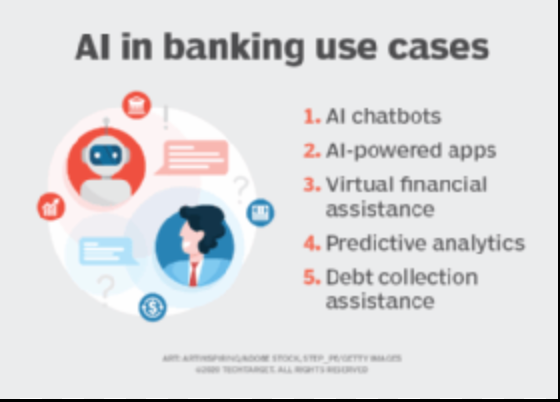
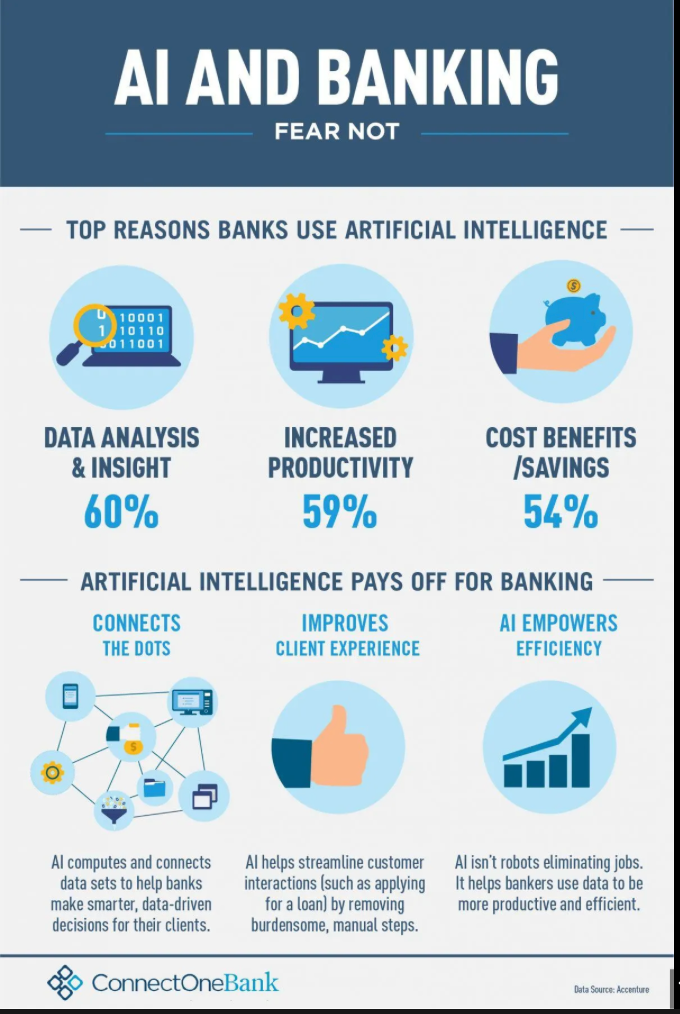
I didn’t sleep well last night. Is there an AI out there that can help me sleep when I am restless and have a lot on my mind? I’m not really into pill-popping. CALM Is one app that comes to mind.
Apparently, some banks are now jumping into AI. And JP Morgan is one of them. An AI bot, called Index GPT, was introduced in a U.S. Patent and Trademark filing on May 11 by the investment banking firm.
The product “provides temporary use of online non-downloadable cloud computing software using artificial intelligence for use in computer software selection of financial securities and financial assets,” the patent file noted.
The patent also covers:
Software as a service (SAAS) services featuring software using artificial intelligence for Generative Pre-trained Transformer models in the field of financial services.
Provides consumer product information for the purpose of selecting artificial intelligence (AI) hardware and software to meeting the consumer’s specifications; software as a service (SAAS) services featuring software for analysing and selecting securities tailored to customer needs.
So, is this the beginning of the end of human financial advisors? While the Chatbot version trademarked by JPMorgan Chase doesn’t infer it will displace actual money managers, industry experts argue that it’s only a matter of time. It does appear that JPMorgan wants to use IndexGPT to choose stocks, bonds, and funds for its wealth management clients.
Last month, JPMorgan Chase CEO Jamie Dimon stated that “the importance of implementing new technologies simply cannot be overstated.”
What! No human contact at all? What if you had a question, a complaint, or just wanted to share your success or share your experience with another human being? Trading is a solitary experience right now – will AI push us further into our own worlds and have us communicate less? Would you want a world without a human creating the information in Jacquie’s Post, or a world without John Thomas of Mad Hedge Fund Trader sending out newsletters and trade alerts? Would you want to be cut off from any social connection with us? We must be able to work side by side with this technology. And that’s what we will do, and in fact, all sectors will do this.
Banks shift tech focus to artificial intelligence.
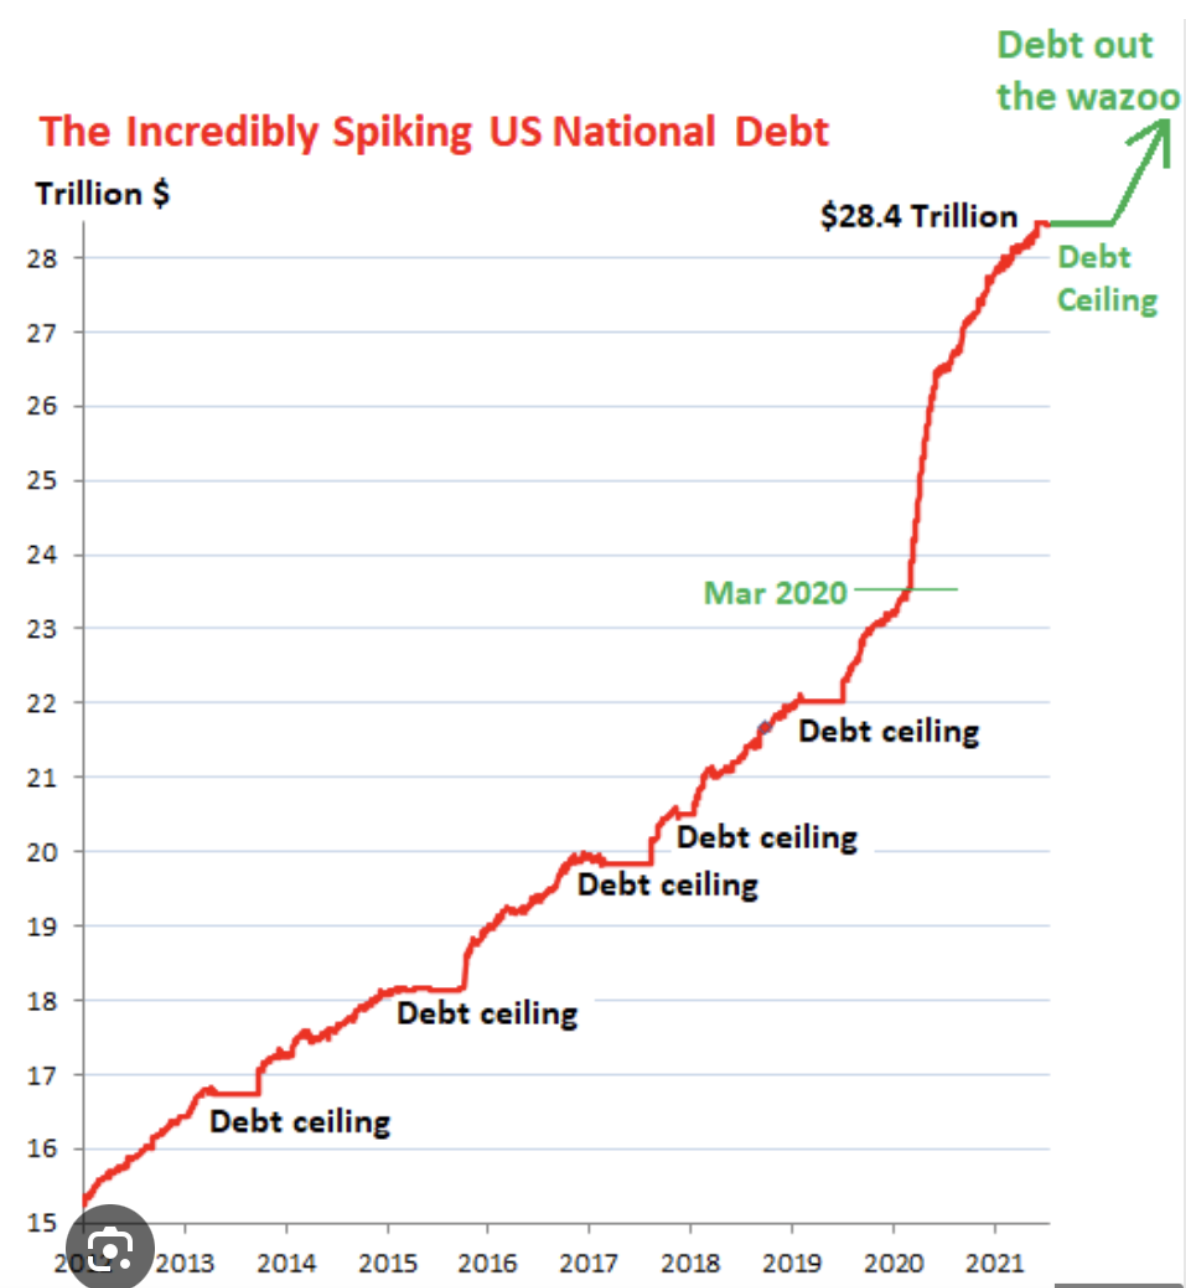
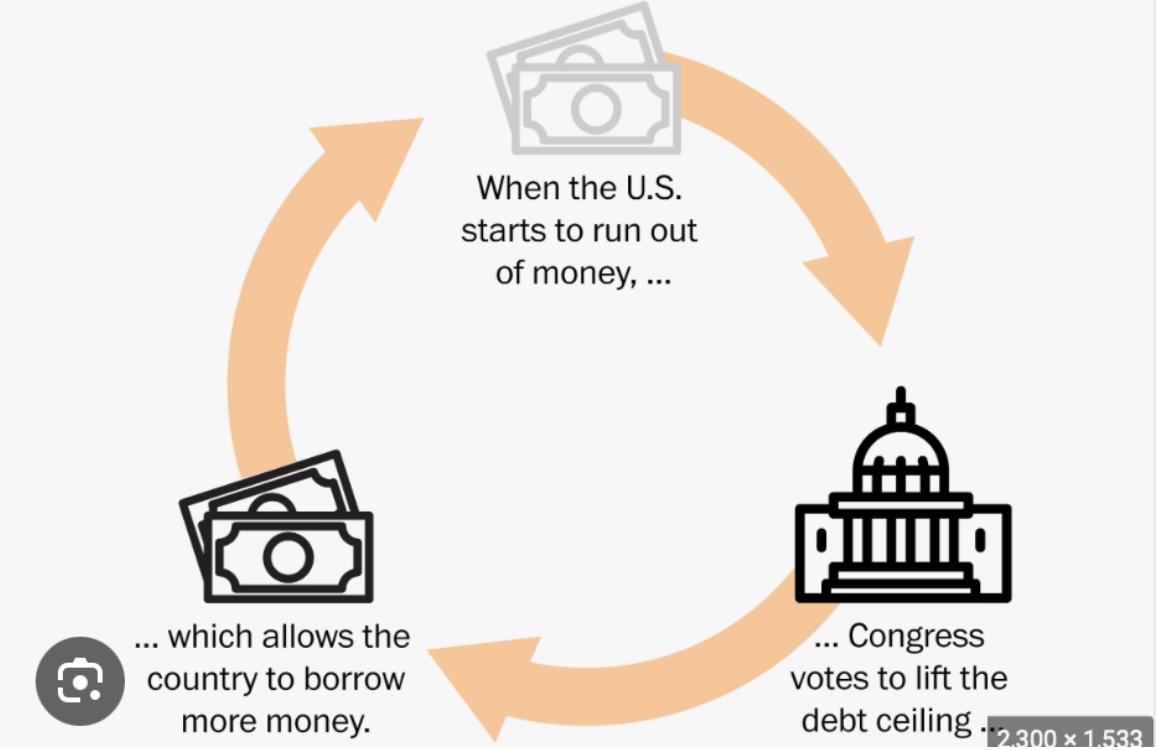
An update on the debt ceiling deal:
So, what’s changed?
The deal between Biden and McCarthy would suspend the $31.4 trillion debt ceiling until January 1, 2025, allowing the U.S. government to pay its bills.
The trade-off? Non-defence discretionary spending would be roughly flat at current levels in 2024. There is an estimation that non-defence discretionary spending excluding benefits for veterans would total $637 billion for the 2024 fiscal year, down marginally from $638 billion the year before. That total would also increase by 1% in 2025.
The debt limit extension lasts past 2024 – until after the November 2024 presidential election. But Congress will still have to knuckle down and make some rational decisions about how to allocate money under the new spending caps this year.
The deal would boost total defence spending to $886 billion, in line with Biden’s 2024 budget spending proposal.
That’s about a 3% increase from the $858 billion allocated in the current budget for the Pentagon and other defence-related programs in other agencies.
Biden and Democrats secured $80 billion for a decade in new funding for the IRS.
Impact: hiring thousands of new agents – the extra tax revenue they generated is expected to offset many of the climate-friendly tax credits.
Clawback unused Covid relief funds which is estimated to be between $50 billion and $70 billion.
No changes to Medicaid in the deal.
But work requirements would be imposed on some low-income people who received food assistance under the program known as SNAP up to age 54, instead of up to age 50.
End the current pause on student loan repayments by late August.
Biden’s plan to forgive $430 billion in student debt, is still under review in the Supreme Court.
Energy projects to find it easier to gain permit approval.
We are waiting for Congress now. Will the deal be passed or will it fail?
Wishing you all a great week.
Cheers,
Jacquie
“If we command our wealth, we shall be rich and free. If our wealth commands us, we are poor indeed.” --Edmund Burke
https://madhedgefundtrader.com/wp-content/uploads/2019/05/cropped-mad-hedge-logo-transparent-192x192_f9578834168ba24df3eb53916a12c882.png00Mad Hedge Fund Traderhttps://madhedgefundtrader.com/wp-content/uploads/2019/05/cropped-mad-hedge-logo-transparent-192x192_f9578834168ba24df3eb53916a12c882.pngMad Hedge Fund Trader2023-05-31 22:00:222023-06-01 11:25:52June 1, 2023
Lunches:
July 6, 2023, New York
July 13, 2023, Seminar at Sea (Aboard the Queen Mary)
July 19, 2023, London (walking distance from Piccadilly in a private military club)
Performance:
May – 2.70% MTD
64.24% so far this year
113.84% trailing one-year return.
Positions:
Short Strangle
Risk on (TSLA) 6/120-130 call spread (idea here is belief it won’t go below 130)
Risk off (TSLA) 6/210-220 put spread (idea here is belief it won’t go above 210)
Now 80% cash. 41-44 positions have made money.
Method to My Madness
The debt ceiling drama has frozen all markets. Lower volatility has managed to recover to $21.
Bond yields have jumped to 3.75%.
Markets are flashing red = reduce risk-taking.
Trading volumes are down.
Summer will be the time to buy.
Put precious metals and commodities at the top of the list.
If there is a default, there may be a 50% stock market correction.
The follow-up would be that it would get defaulted in days.
AI will take the DOW average from 36,000 to 240,000 over the next 10 years.
AI will automatically triple the value of any company now using it even though it may take years for the stock market to catch up. Of course, regular earnings growth will be a boost here also.
NVDA goes up seven times from here to well over $1000.
Mad Hedge recommended NVDA on a split adjusted basis around $20.
Global Economy – Rolling over.
CPI hits 4.9% YOY after the 0.40% report for April.
Leading economic indicators gave up 0.6% in April, to 107.5 (2016 is the baseline at 100) as rolling over economic data heightens recession risks.
Philadelphia Fed Manufacturing Index collapses, down from 20 to 10.5, approaching a three-year low.
Retail sales drop 0.4% in April.
Market Timing Index at high-risk territory.
Risk at 7 months high.
DO NOT BUY here.
Weekly Jobless claims are falling.
Stocks
There is a 1,000-point drop in the market waiting to happen. And that happens when the market rallies on a Biden McCarthy debt ceiling deal, which McCarthy’s own party then votes down.
Equity allocations are at 15-year lows, with massive amounts of cash in 90 days T-bills. Look for money to pour into stocks in the second half.
Insiders are loading the boat with regional bank shares.
First Solar rockets 26% on an easing of U.S. Treasury rules on what defines “Made in America.”
FANGS to rise 50% by year-end, says Fund Strat’s ultra-bull Tom Lee.
All charts on tech shares are looking the same.
In the following list of stocks two-year LEAPS are a possible play at these prices.
UPS United Parcel Service
CAT Caterpillar
FCX Freeport McMoran
DIS Disney
X United States Steel Corporation
UNP Union Pacific
AMGN Amgen
GS Goldman Sachs
MS Morgan Stanley
BAC Bank of America
SCHW Schwab
BLK Blackrock
BRKB Berkshire Hathaway -buy on any dips – it’s a long-term play.
Bonds
Waiting for a capitulation sell-off in the TLT which will be triggered by inaction in Washington.
When a deal is done, it will unleash a new onslaught of bond selling by Treasury – now limited by the old debt ceiling and lower lows on bonds.
Rising interest payments by Treasury = less money to pay other bills and earlier debt ceiling deadline.
If TLT hits $95 we will be issuing recommendations for call spreads and LEAPS.
Treasury to issue $700 billion in T-bills within weeks of a debt ceiling deal, pushing short-term yield ups. The question is with a TLT at a $100 handle, a 2023 low, how much is already in the price?
Keep buying 90-day T-bills, now pushing a 5.2% risk-free yield.
Junk Bond ETFs are great high-yield plays (JNK) and (HYG).
Buy SDS for protection against long-term positions.
Foreign Currencies
Expect the dollar to fade soon. Dollar sell-off will accelerate on any debt default. Any strength in the dollar will be temporary. New lows by end of 2023.
Buy FXE, FXY, FXB, and FXA on dips.
Energy and Commodities
The Oil Collapse is signaling a recession as is weakness in the other commodities, even lithium.
It has been the worse-performing asset class of 2023.
Buy (USO) on dips on an economic recovery play.
Look for UNG to triple in the next year.
FCX – a golden cross is setting up.
Precious Metals are resting for the moment.
Gold is headed for $3000 by 2024.
Drivers – soon to be falling interest rates and demise of crypto.
Silver is the better play with a higher beta.
Buy GOLD, GDX, SLV, SIL.
Real Estate
This sector is showing signs of life. A tidal wave of millennial buyers is under the market.
Some borrowers are moving to 40-year mortgages to lower monthly payments. New home sales hit 13 months high up 4.1% in April.
Median home prices are down 8.2% YOY.
CCI Crown Castle International 5.4% yield. It’s also a LEAPS candidate at this price.
Wishing you all a great week.
Cheers,
Jacquie
https://madhedgefundtrader.com/wp-content/uploads/2019/05/cropped-mad-hedge-logo-transparent-192x192_f9578834168ba24df3eb53916a12c882.png00Mad Hedge Fund Traderhttps://madhedgefundtrader.com/wp-content/uploads/2019/05/cropped-mad-hedge-logo-transparent-192x192_f9578834168ba24df3eb53916a12c882.pngMad Hedge Fund Trader2023-05-29 22:00:362023-05-30 15:15:25May 30, 2023
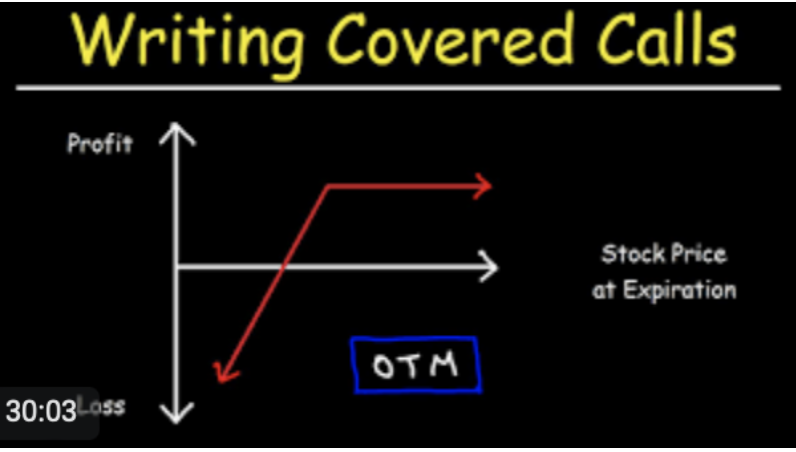
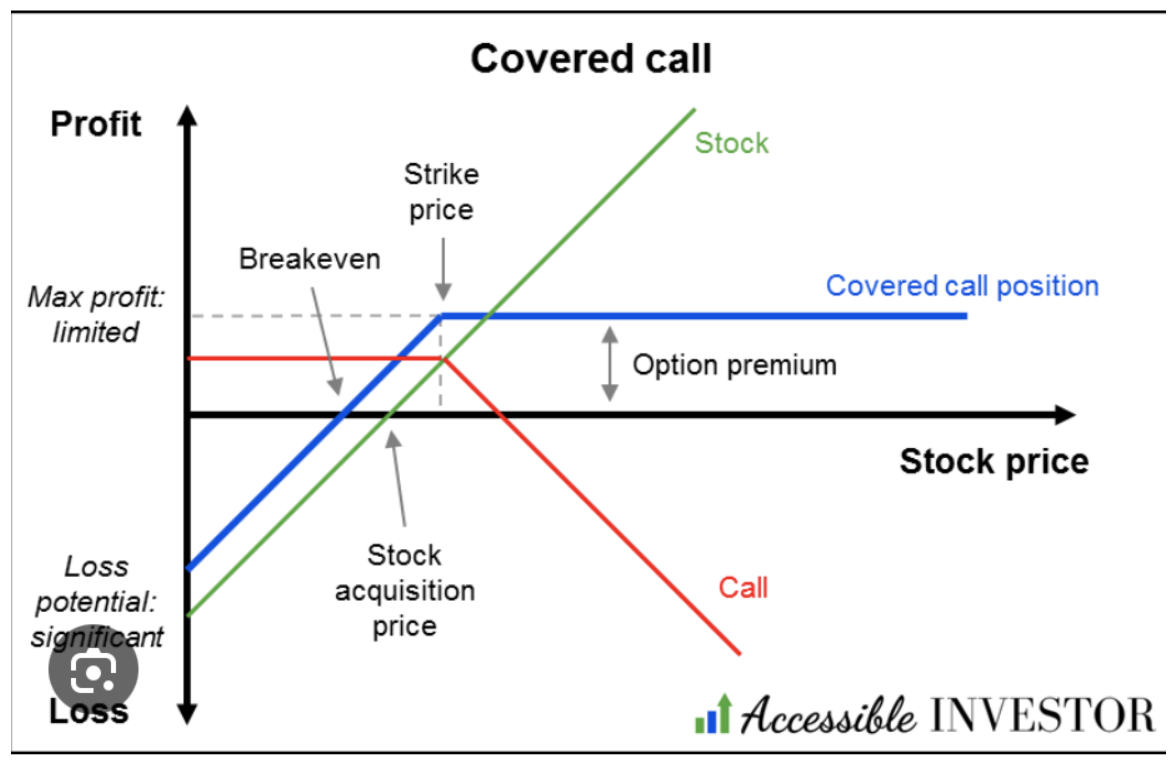
Would you like your shares to start working for you? I’m talking about a trading strategy, where your shares pay you. And I‘m not just talking about those dividends you receive.
I’m talking about Buy Writes. Also called covered calls. The investors sell options over a stock held in a portfolio to generate cash and therefore guarantee a modest return from them. The option buyer gets the right to “call away” the fund’s shares if they hit or exceed agreed-upon prices.
So, for the beginner, a buy write is combination of positions where you buy a stock and sell short options on the same stock against the shares at a higher price, usually on a one-to-one basis.
“Writing” is another term for selling short in the options world because you are in effect entering into a binding contract. When you sell short an option you are paid the premium the buyer pays, and the cash sits in your brokerage account accruing interest.
If the stock rallies, remains the same price or rises just short of the strike price you sold short, you get to keep the entire premium.
Most buy writes take place in front-month options and the strike prices are 5 or 10% above the current share price. I’ll give you an example of a 2021 Apple position.
Let’s say you own 100 shares of Apple (AAPL) at $140. You can sell short one August 2021 $150 call for $1.47. You will receive the premium of $147.00 ($1.47 X 100 shares per option). Remember, one option contract is exercisable into 100 shares.
If Apple shares close under $150 at the August 20 option expiration you get to keep the entire premium. If Apple closes over $150 you automatically become short 100 Apple shares. Then you simply instruct your broker to cover your short in the shares with the 100 Apple shares you already have in your account.
Buy writes accomplish several things. Firstly, they reduce risk, pare back the volatility of your portfolio, and bring in extra income. In a nutshell, it will enhance the overall performance of your portfolio.
But how do you know when to pull the trigger on this strategy? If the market is going straight up, you don’t want to touch buy writes with a ten-foot pole as your stock will get called away and you will miss substantial upside.
It’s preferable to skip dividend-paying months, usually March, June, September, and December, to avoid your short option getting called away mid-month by a hedge fund trying to get the dividend on the cheap.
You don’t want to engage in buy writes in bear markets. Whatever you take in with option premium it will be more than offset by losses on your long stock position.
O.K. let’s say you are a very cautious kind of person. Instead of selling short the $150 strike you call sell the $155 strike for less money. Then your risk of a call away drops too.
You can also go much further out in your expiration date to bring in more money. If you go out to the January expiration you will take in more option premium.
Let’s say you are a particularly aggressive trader. You can double your buy write income by doubling your option short sales at the ratio of 2:1. However, if Apple closes above $150 by expiration day you will be naked short 100 shares of Apple.
It may be that you won’t have enough cash in your account to meet the margin call for selling short 100 shares of Apple so you will have to buy the shares in the market immediately. Maybe you should leave that to the professionals.
Hang on. There’s another way to do this.
Instead of buying stock, you can establish your long position with another call option. These are called “vertical bull call debit spreads” and are a regular feature of the Mad Hedge Trade Alert Service. The “vertical” refers to strike prices lined up above each other. The “debit” means you must pay cash for the position instead of getting paid for it.
What about if there was a way to get into the position for free?
You could buy one call option and sell short two call options against it for no cost. The downside is that you go naked short if the share rises above the short strike prices, again triggering a margin call.
One strategy you must love is LEAPS (Long Term Equity Anticipation Securities). Go out with your expiration one to two years. Some investors are purely directional in their options. In other words, they buy a straight call, rather than doing a bull call spread. That’s OK. It’s up to you. I’m just giving you options (sorry for the play on words there).
Wishing you all a happy mid-week.
Cheers,
Jacquie
https://madhedgefundtrader.com/wp-content/uploads/2019/05/cropped-mad-hedge-logo-transparent-192x192_f9578834168ba24df3eb53916a12c882.png00Mad Hedge Fund Traderhttps://madhedgefundtrader.com/wp-content/uploads/2019/05/cropped-mad-hedge-logo-transparent-192x192_f9578834168ba24df3eb53916a12c882.pngMad Hedge Fund Trader2023-05-26 22:00:472023-05-30 12:18:50May 26, 2023
(WHO IS IMPACTED IF THE U.S. DEFAULTS ON ITS DEBT)
May 24, 2023
Hello everybody,
98 times in the past, the debt ceiling has been raised. Why should this time be different? If it is different this time, who takes the brunt of the effect?
Let’s see.
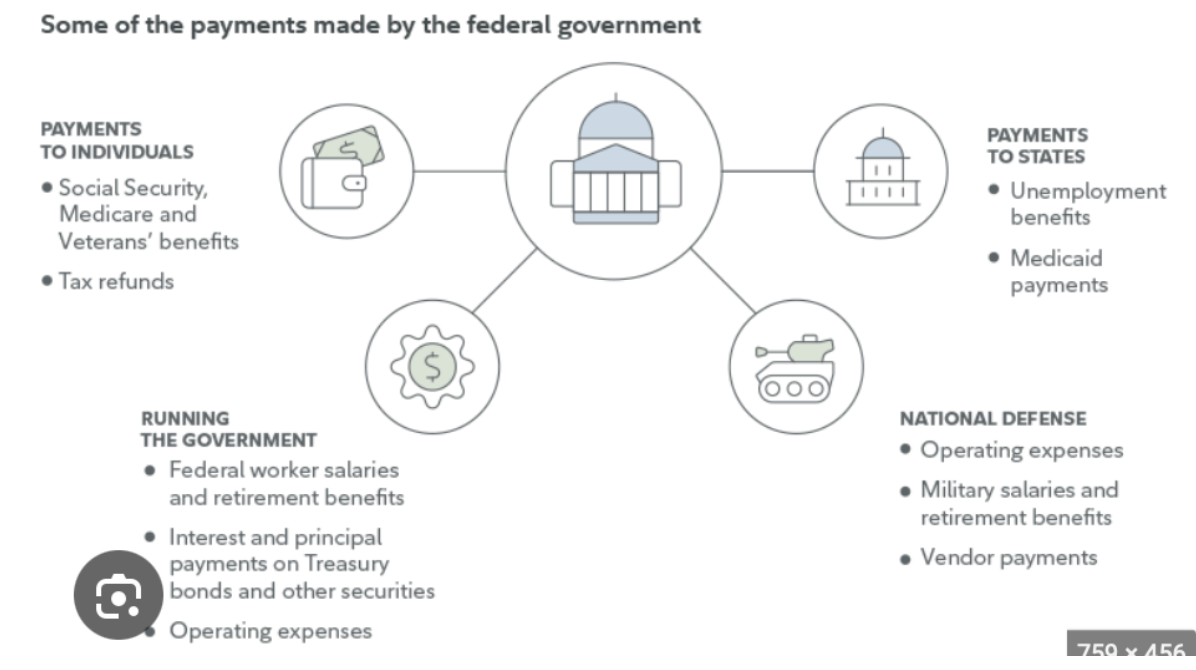
First, we have the veterans. There is a bill of $12 billion on June 1 for veterans’ benefits. If there is not enough money on hand to pay those benefits, people who have already sacrificed a lot for their country will have to sacrifice a lot more. There are people on very low, sometimes fixed incomes who rely on these payments as a lifeline to pay for housing, pay for food, to pay for expenses for children and other family members.
The government is also scheduled to pay $12 billion in military and civilian retirement benefits on June 1. If those payments are delayed for any length of time, people with little or no savings might have to turn to credit cards, which carry increasingly costly interest rates.
The government is scheduled to pay $25 billion in Social Security benefits on June 2 – one of several big payments the program will make over the course of the month.
Another group that would be impacted would be home buyers. The real estate website Zillow estimates that a prolonged government default could send mortgage rates soaring as high as 8.4% from about 6.4% today. That would put homes out of reach for hundreds of thousands of would-be buyers.
Other payments that would be jeopardised include the following:
$47 billion for Medicare providers, due on June 1.
$1 billion in tax refunds, set to go out June 7.
$4 billion in federal salaries, payable on June 9.
The S&P advance should persist and is still able to extend on to the next resistance at around 4310 – 4325. Above this resistance lies 4385.
The U.S. stock market’s advance this year has been led by the Nasdaq index, with the FANG stocks leading the charge forward. In late March this year, the Nasdaq completed a bullish 9-month inverse Head and Shoulders reversal pattern, yielding up an upside target around the 15,600 level. This target remains in play. If this target is punched through, we could see 18,000.
If you were looking to buy any stocks now, I would be looking at Apple, which has a target of around $190, and Microsoft, which has a target of around $345.
GOLD – a correction is in progress. We could get down to around $1920. Then you want to buy with both hands. Look at GOLD, WPM, and SLV. First target is around $2,360.
U.S.$ - Look to fade the dollar very soon. Start buying small parcels of AUD, Euro, Pound, NZ$, and Yen.
Wishing you all a happy mid-week.
Cheers,
Jacquie
https://madhedgefundtrader.com/wp-content/uploads/2019/05/cropped-mad-hedge-logo-transparent-192x192_f9578834168ba24df3eb53916a12c882.png00Mad Hedge Fund Traderhttps://madhedgefundtrader.com/wp-content/uploads/2019/05/cropped-mad-hedge-logo-transparent-192x192_f9578834168ba24df3eb53916a12c882.pngMad Hedge Fund Trader2023-05-24 21:39:132023-05-24 21:39:41May 24, 2023
We all know about solar panels. Some of us have them. Some of us don’t.
Is there a chance we can make them more efficient?
Bill Gates seems to think so.
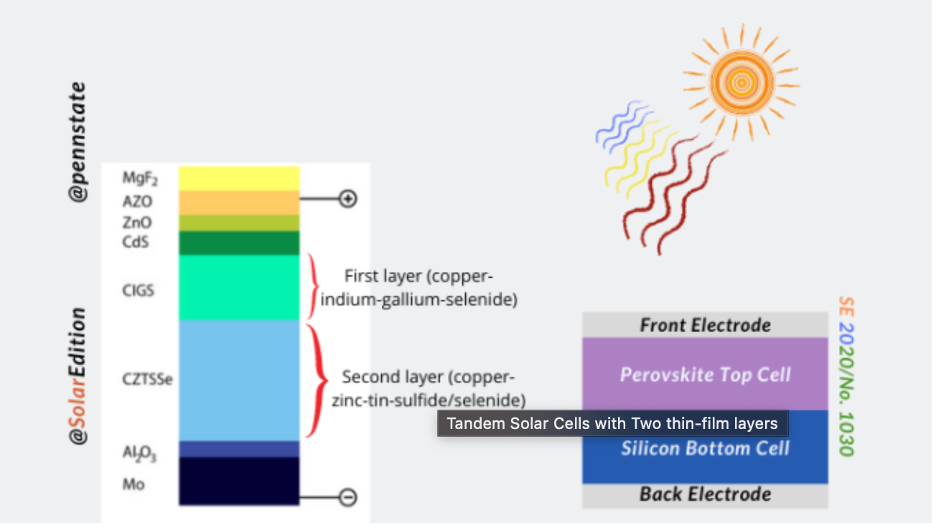
His Breakthrough Energy Ventures is exploring the mineral perovskite, which was found about 200 years ago, to see if it can lead to a new, more efficient leader in solar energy.
Apparently, perovskite has a crystal-like structure that could transform sustainable energy by boosting the efficiency of commercial solar panels.
Solar panels accounted for nearly 5% of U.S. energy production last year, up almost 11-fold from 10 years ago and enough to power about 25 million households. Nearly all the solar modules that are used in power generation today consist of conventional silicon-based panels made in China, a technology that has changed little since silicon cells were discovered in the 1950s.
Other materials used, like gallium arsenide, copper indium gallium selenide and cadmium telluride – the latter a key to the largest U.S. solar company First Solar’s growth - can be very expensive or toxic. Backers of perovskite-based solar cells say they can outperform silicon in at least two ways and accelerate efforts in the race to fight climate change. Just this week, First Solar announced the acquisition of European perovskite technology player Evolar.
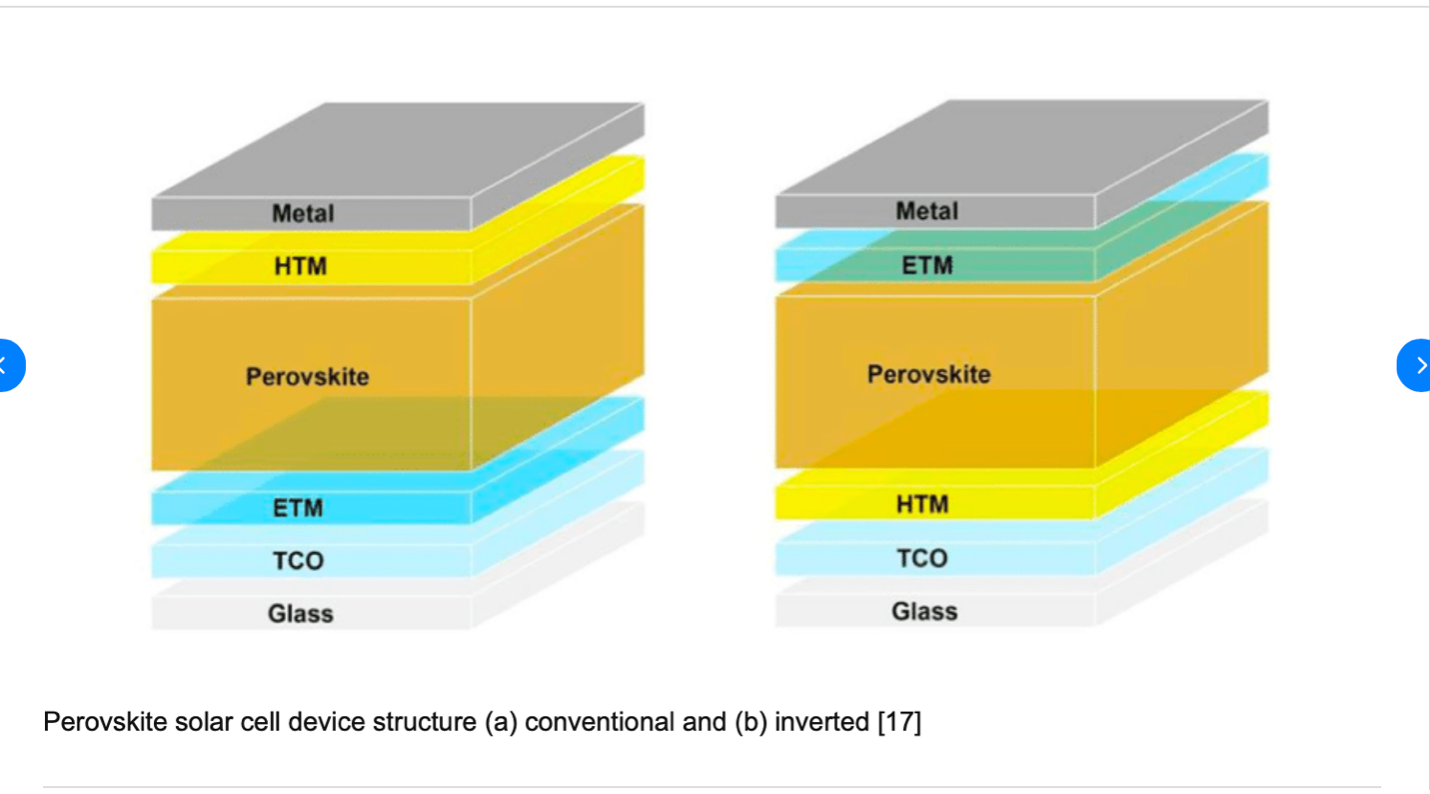
How does it all work and what are the barriers in silicon-based solar panels?
Photovoltaic cells convert photons in sunlight into electricity. But not all photons are the same. They have different amounts of energy and correspond to different wavelengths in the solar spectrum. Cells made of perovskites, which refer to various materials with crystal structures resembling that of the mineral, have a higher absorption coefficient, meaning they can grab a wider range of photon energies over the sunlight spectrum to deliver more energy. While standard commercial silicon cells have efficiencies of about 21%, laboratory perovskite cells have efficiencies of up to 25.7% for those base don perovskite alone, and as much as 31.25% for those that are combined with silicon in a so-called tandem cell.
Sustainability and cost are also brought into the frame. Perovskite cells can be more sustainable to produce than silicon. Intense heat and large amounts of energy are needed to remove impurities from silicon, and that produces a lot of carbon emissions. It also has to be relatively thick to work. Perovskite cells are very thin – less than 1 micrometre – and can be pained or sprayed on surfaces, making them cheap to produce. A 2020 Stanford University analysis of an experimental production method estimated that perovskite modules could be made for only 25 cents per square foot, compared to about $2.50 for the silicon equivalent.
It looks like many industries in all corners of the world will start production lines in factories for the commercialization of their solar cells before 2025. And it looks like the tandem module will become a breakthrough climate technology. CubicPV has been backed by Bill Gates’s Breakthrough Energy Ventures and they have been developing these tandem modules since 2019.
A tandem module is one which has a bottom silicon layer and a top perovskite layer, and their efficiency can reach as much as 30%. And there are advantages. CubicPV argues that the company’s perovskite chemistry and its low-cost manufacturing method for the silicon layer make the tandem approach economical. CEO of CubicPV, explains that tandem extracts more power from the sun, making every solar installation more powerful and accelerating the world’s ability to curb the worst impacts of climate change. Furthermore, he believes that the entire industry will switch to tandem within the next decade.
How do these cells perform outside a lab environment?
And will the tandem cells have the required stability to be commercially viable?
Japan seems to think so.
They are now building these panels into walls and windows in their buildings.
Exhibited at CES 2023, Panasonic’s 30 cm-square perovskite-only cell has an efficiency of 17.9%, the highest in the world, according to a ranking from the U.S. National Renewable Energy Laboratory. Panasonic says it aims to commercialize its perovskite cells in the next five years.
Perovskite cell inventor Miyasaka believes perovskite-based power generation will account for more than half of the solar cell market in 2030, not by replacing silicon but through new applications such as building walls and windows.
It looks like this mineral could be a big contributor to realizing a self-sufficient sustainable society.
Welcome to a new week.
Have a good one.
Cheers,
Jacquie
https://madhedgefundtrader.com/wp-content/uploads/2019/05/cropped-mad-hedge-logo-transparent-192x192_f9578834168ba24df3eb53916a12c882.png00Mad Hedge Fund Traderhttps://madhedgefundtrader.com/wp-content/uploads/2019/05/cropped-mad-hedge-logo-transparent-192x192_f9578834168ba24df3eb53916a12c882.pngMad Hedge Fund Trader2023-05-22 22:00:272023-05-25 13:56:18May 22, 2023
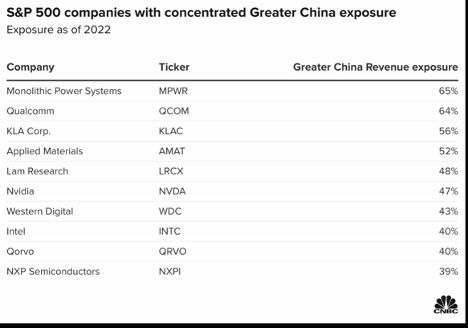
The U.S. companies listed below have a high revenue exposure to China. If the Chinese economic recovery post pandemic loses momentum, a negative trend may ensue.
Goldman Sachs has analysed company 10K filings to determine the geographic revenue exposure of each stock in the S&P 500. What they found was that several of the stocks had revenue exposure to Greater China of over 40%.
If the recovery from strict covid measures remains muted, these stocks could be hurt. Early in the year, consumer and business activity was largely robust, but this has since faded.
On the other hand, if China turns on the taps and lets loose with policy stimulus to boost growth, these companies tied to the nation could see a near-term tailwind.
Companies that generate a significant number of sales from Greater China were exclusively in the chip industry, according to Goldman.
Semiconductors have been caught up in the U.S.-China battle for tech dominance. Washington has tried to cut China and Chinese firms off through sanctions and export restrictions in the past few years, including blacklisting Huawei.
The U.S. also introduced broader chip restrictions last year, aiming to deprive Chinese firms of critical semiconductors that could serve artificial intelligence and more advanced applications.
Monolithic Power Systems is on the top of the list with 65% of its 2022 revenue derived from Greater China, according to Goldman. The stock has gained about 18% this year.
Qualcomm also generated more than 60% of its revenue from the region. Qualcomm recently saw a big decline in sales from handset chips, a core business for the company. CEO Cristiano Amon has pointed out that there has been no evidence that smartphone sales are recovering in China.
I’ll leave you today with this possibility. Traders in the fed funds futures are assigning a roughly 1 in 4 probability that the FOMC increases its benchmark rate by another 25 basis points following the June 13-14 meeting, according to the CME Group’s FedWatch tracker.
Have a great weekend.
Cheers,
Jacque
https://madhedgefundtrader.com/wp-content/uploads/2019/05/cropped-mad-hedge-logo-transparent-192x192_f9578834168ba24df3eb53916a12c882.png00Mad Hedge Fund Traderhttps://madhedgefundtrader.com/wp-content/uploads/2019/05/cropped-mad-hedge-logo-transparent-192x192_f9578834168ba24df3eb53916a12c882.pngMad Hedge Fund Trader2023-05-19 22:00:312023-05-22 11:00:25May 19, 2023
One day the media and so-called experts in the know tell us are going to get a soft landing.
The next day they tell us that we are going to get a hard landing.
One day they tell us that inflation data is getting better.
The next day they tell us that inflation data is getting worse.
And they also tell us that the jobs numbers are too strong. The Fed needs more people unemployed.
I get it.
They want to slow things down and bring inflation down, but at what cost?
And what happens when they pause on the rate hikes or even cut, and inflation rears its head again – it’s a possibility.
It’s enough to make your head spin.
The market is almost bipolar or even passive-aggressive.
Inflation is getting better, but prices are still high and could remain so.
David Neuhauser, chief investment officer at Livermore Partners said that while the gradual decline in the inflation rate over the past year is a positive sign for the economy, he expects prices to remain stubbornly high for an extended period. He expects a hard landing.
John, on the other hand, believes that the inflation rate will come down and prices will slowly normalise, but it may be a bumpy journey to get there. He is leaning more towards the soft-landing scenario.
Neuhauser is arguing that inflation will remain a problem for some time to come and the markets won’t like that script.
If the markets don’t get a cut in rates, Neuhauser believes the S&P 500 could decline by more than 20%.
The debt ceiling crisis could get to the post first and bring the market down in the summer.
John has told us all to buy gold and silver stocks during the summer period. Specifically, GOLD, WPM, SLV, etc. Also, he has told clients to buy 90-day T-bills and the TLT – calls, call spread, and/or LEAPS.
Maybe you could also think about a couple of these stocks recommended by Neuhauser. Do your research first.
The first is Ferrari, a high-margin automaker with a significant market presence among ultra-high net worth individuals.
As inflation rises, companies serving the wealthy have outperformed as their customers are not as sensitive to price rises.
The trend is also evident in the automotive sector. For instance, Ferrari, which makes about 14,000 cars annually, is currently valued at 53 billion euros ($58 billion), compared to mass-market car maker Stellantis, which produces 6 million vehicles every year and is valued at around 48 billion.
Ferrari also reported a 24% jump in net profit and an increase in its waiting list earlier this month. Its financial results contrast with the wider automotive sector, which is struggling due to supply chain problems and rising costs.
Next is Jadestone Energy. It’s a London-listed oil and gas producer where the dynamics are taking hold and the cashflow is high going forward into next year.
Then we have Amaroq Minerals. Again, do your research. This is an Icelandic company engaged in gold and mineral exploration. It is set for strong cash flows and is about to construct its first mine. The company already owns high-grade gold and copper assets in southern Greenland. As gold prices rise, companies mining the metal benefit from bigger profit margins.
Livermore, the hedge fund founded by Neuhauser in 2009, owns shares in Amaroq, along with billionaire investor Louis Bacon.
Happy mid-week.
Be happy, healthy, and wealthy.
Cheers,
Jacque
"Too many people spend money they earned …to buy things they don’t want…to impress people that they don’t like. … The money you make is a symbol of the value you create." - Idowu Koyenikan
https://madhedgefundtrader.com/wp-content/uploads/2019/05/cropped-mad-hedge-logo-transparent-192x192_f9578834168ba24df3eb53916a12c882.png00Mad Hedge Fund Traderhttps://madhedgefundtrader.com/wp-content/uploads/2019/05/cropped-mad-hedge-logo-transparent-192x192_f9578834168ba24df3eb53916a12c882.pngMad Hedge Fund Trader2023-05-17 22:00:072023-05-22 10:50:47May 17, 2023
Legal Disclaimer
There is a very high degree of risk involved in trading. Past results are not indicative of future returns. MadHedgeFundTrader.com and all individuals affiliated with this site assume no responsibilities for your trading and investment results. The indicators, strategies, columns, articles and all other features are for educational purposes only and should not be construed as investment advice. Information for futures trading observations are obtained from sources believed to be reliable, but we do not warrant its completeness or accuracy, or warrant any results from the use of the information. Your use of the trading observations is entirely at your own risk and it is your sole responsibility to evaluate the accuracy, completeness and usefulness of the information. You must assess the risk of any trade with your broker and make your own independent decisions regarding any securities mentioned herein. Affiliates of MadHedgeFundTrader.com may have a position or effect transactions in the securities described herein (or options thereon) and/or otherwise employ trading strategies that may be consistent or inconsistent with the provided strategies.