?Economists say we?re having 2.5% growth. That?s a lie. The reality is that we have 5% growth for the top 20% of the economy, and 0% growth for the bottom 80% of the economy,? said Arthur Brooks, president of the American Enterprise Institute.

?Economists say we?re having 2.5% growth. That?s a lie. The reality is that we have 5% growth for the top 20% of the economy, and 0% growth for the bottom 80% of the economy,? said Arthur Brooks, president of the American Enterprise Institute.
Global Market Comments
March 31, 2016
Fiat Lux
Featured Trade:
(APRIL 22 NEW YORK STRATEGY LUNCHEON)
(THE NEW COLD WAR)
(THE BEST FINANCIAL BOOK EVER)
Global Market Comments
March 30, 2016
Fiat Lux
Featured Trade:
(APRIL 21 BOSTON GLOBAL STRATEGY LUNCHEON),
(THE YELLEN PUT OPTION LIVES!),
(SPY), (TLT), (GLD), (FXY), (FXE),
(THE TAX RATE FALLACY),
(THE BEST TESTIMONIAL EVER!)
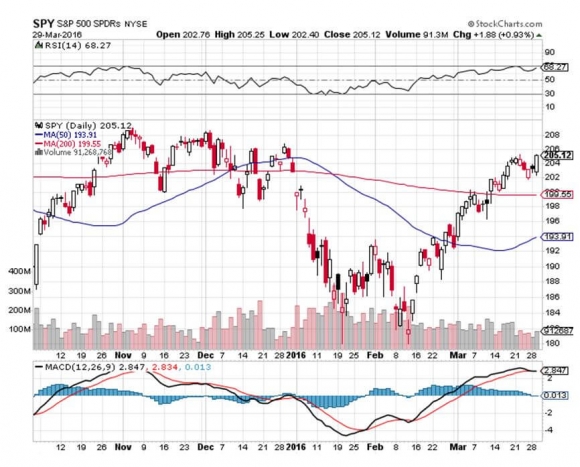
SPDR S&P 500 ETF (SPY)
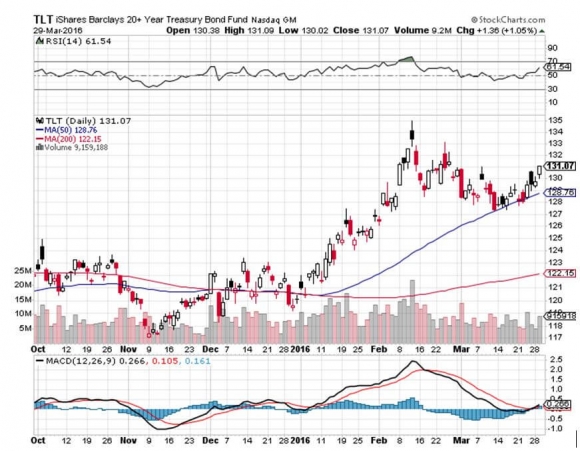
iShares 20+ Year Treasury Bond (TLT)
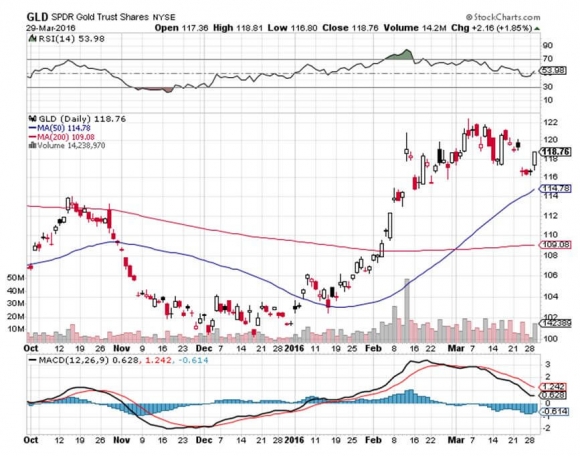
SPDR Gold Shares (GLD)
CurrencyShares Japanese Yen ETF (FXY)
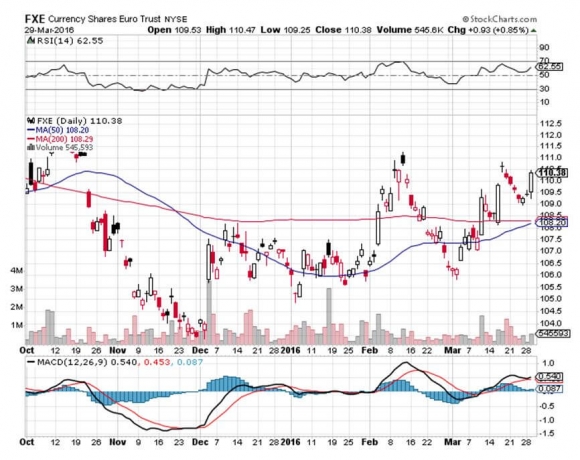
CurrencyShares Euro ETF (FXE)
Any monetary hawks hoping for an acceleration of the Federal Reserve's interest rate policy had their hopes sorely dashed today.
Chairman Janet Yellen?s speech could not have been more dovish if it had been written by the most extreme deflationista.
Let me parse her words for you:
?greater gradualism?
??less favorable economic conditions?
?weaker foreign economies?
??downward drifting inflation expectations?
These sentiments all point towards a single possible conclusion. There won?t be another Fed interest rate hike until December, well after the presidential election.
Betting on Janet Yellen?s laser focus on employment at the expense of higher interest rates has been the surest bet you could made in the financial markets since her appointment in 2014.
Those betting on low rates triggering an upsurge in inflation were rightly spanked and had their money taken away from them.
The various asset classes made their predictable moves. Technology stocks (AAPL) and (FB), bonds (TLT), the Japanese yen (FXY), and the Euro (FXE) all rose. The dollar (UUP) and bank stocks tanked.
Gold (GLD) went up. But gold always seems to want to go up lately, no matter what the news is. It seems that the mere fact that an unknown is out of the way is cause for the barbarous relic to appreciate.
So you may be asking, ?Why on earth are you selling short the S&P 500 with this revelation.?
There is a method to my MADNESS.
The stock market has ridden higher for six consecutive weeks. It is now more overbought than at any time in history, with a staggering 92.5% of stocks ABOVE their 50-day moving average.
My belief is that I was not alone in my own dovish expectations, and that much of the rest of the market was expecting the same. That?s why we got a monster February-March rally, despite essentially no change in the economic fundamentals.
In order words, the dovish news is already factored into the price. No surprise here!
 No Interest Rate Hike Here
I was pondering an FXE trade alert from MHFT today when my cell rang with a Berkeley, CA area code. Since I know a couple people in that part of the world, I answered, and it was none other than John Thomas.
Had I not heard his voice on the MHFT webinars, I would have thought I was being conned. But given that I?m in the last month of a trial run, he actually called to find out how I was doing with the service and what I thought.
Here?s the short version of what I told him.
I?m a pretty experienced investor, but definitely not sophisticated when it comes to using options, or for that matter, trading currencies and commodities.
My first trade with MHFT ? an (FXY) vertical call spread ? literally scared the hell out of me, so I used a tiny position size. I think I made around $900 ($400 more than my trial subscription, so there?s that).
But through the process of using John?s trade ideas, I learned. Fast. Nothing will help you grasp the potential of option strategies like doing them. And as I write this, I have multiple positions on courtesy of MHFT that are on track to deliver double digit percentage gains in a matter of weeks!
I can?t quite comprehend how he knows so many well-placed people, but he?s incredibly adept at grabbing insights from them, turning these into an investment thesis, and making it incredibly clear and actionable to his reader base.
One day he?s writing about a chat with a three star general and the next you?re buying a call spread on Palo Alto Networks. He connects the dots in a ridiculously useful way.
But it?s more than just the idea, it?s the timing of the idea. The world is full of people who can say ?hey, cyber-security is a big deal.? Or, ?wow, the euro is getting killed.? But the actual trade execution to profit from that in the near term? He?s freaky good.
I also love the defined exit strategy. Look, if you?re the most disciplined human on the planet and never let a bad trade turn into a long term ?investment,? more power to you.
I am not. I hate when I do it, but it?s happened more than once. With MHFT, the exit is well marked. You can?t miss it. Personally, I find that removes significant stress, not to mention risk.
Today, I was over at my local Schwab office ? before John called ? and was raving about MHFT. Not stark raving. Good raving. I?d be surprised if they aren?t signing up for a trial as I write this.
John, thanks for the call. That was a really nice surprise.
But more importantly, thanks for great work, thinking, and ideas. Enjoy your travels and I look forward to meeting you at one of your conferences.
Neil
Dublin, Ohio

?I can calculate the motion of heavenly bodies, but never the madness of crowds,? said Sir Isaac Newton, the inventor of calculus and discoverer of Newton?s Laws, who lost his entire fortune in a 17th century investment scam called ?the South Sea Bubble.?

Global Market Comments
March 29, 2016
Fiat Lux
SPECIAL TESLA 3 ISSUE
Featured Trade:
(APRIL 20 WASHINGTON DC GLOBAL STRATEGY LUNCHEON),
(MARCH 30 GLOBAL STRATEGY WEBINAR),
(HOW TESLA TAKES OVER THE WORLD ON THURSDAY),
(TSLA), (GM), (TM), (NSANY), (DDAIY)
Tesla Motors, Inc. (TSLA)
General Motors Company (GM)
Toyota Motor Corporation (TM)
Nissan Motor Co. Ltd. (NSANY)
Daimler AG (DDAIY)
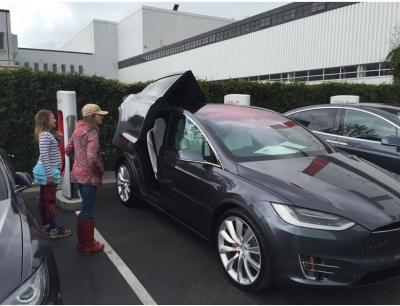
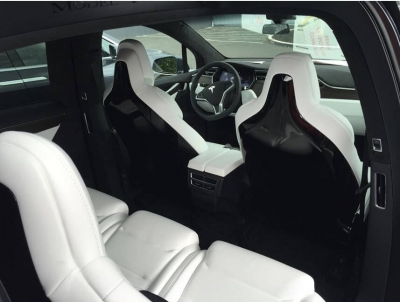
I stopped by Tesla?s (TSLA) Fremont, California factory last week to test drive my new high performance Model X SUV and noticed something interesting.
There was major new construction under way in the customer delivery area.
That was to be expected, since the company has already announced that they plan to boost production of their sleek, ultra high tech Model-S sedan from 51,000 units this year to 93,000. It seems doable, since there is still a four-month waiting list to obtain a new vehicle.
However, something didn?t fit. They weren?t doubling the car delivery area. They were increasing it by TEN TIMES! Clearly, something much larger was afoot.
After chatting up the staff inside, I learned what was really going on. On Thursday, March 31, CEO and founder Elon Musk will unveil the next generation all electric Tesla 3 at the Hawthorne, California facility. The move promises to upend the global automobile industry.
The $35,000 four-passenger car will get a 200 mile range and require almost no maintenance for its entire life. The batteries will offer an eight-year minimum guarantee.
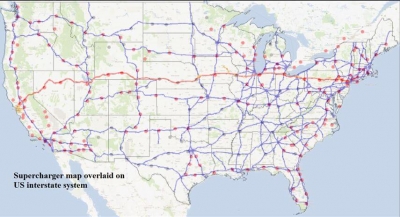
The vehicles can be recharged by plugging in at home, with 90% discounts for charges between 12:00 and 7:00 AM (in California).? At that rate, your fuel cost works out to the equivalent of 4 cents per gallon. They can also be juiced up for free in 30 minutes at Tesla?s 200-station national supercharger network (see map below).
The cars will be fully equipped with self driving technology, although the system has yet to be fully activated pending regulatory and insurance issues. The first vehicles will be delivered in 2017.
However, Elon has been late with every car he has delivered so far, so 2018 is more realistic. Customers don?t care. They would rather have delayed perfection than an early, buggy beta model.
Tesla will start accepting $1,000 deposits for the Model 3 online from April 1. The company expects to sell 10,000 on the first day.
The Tesla 3 has always been the final goal of Musk?s grand vision to build a carbon free global economy. The Tesla Roadster and the Model S-1 were really just test beds to develop a mass-market technology. Now it has finally arrived.
Tesla plans to be producing 500,000 Model 3?s within five years. Beyond that, the sky is the limit. The $6 billion gigafactory, its construction well ahead of schedule (I?ve flown over it), promises to deliver the lithium ion battery packs to make these lofty goals possible. A second plant is planned, possibly in Texas.
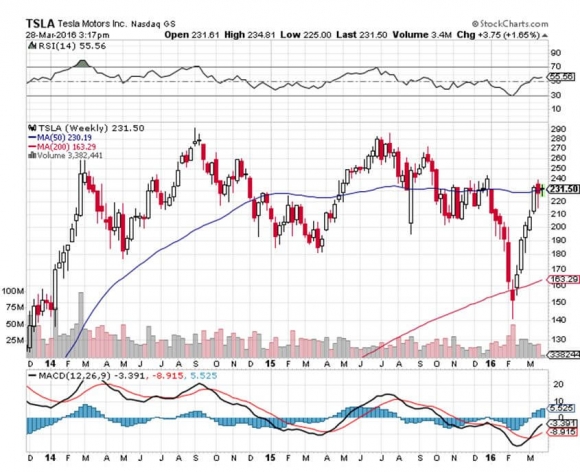
And here is the stock play in Tesla. The company is not expected to earn real, non subsidized, accounting gimmick free earnings for several years. But what is ownership of the global car market in a decade worth today?
Tesla sales this year will only account for 0.55% of total US auto production. But they are easily a decade ahead of any potential competitor in the all electric field, be they American, German, Korean, or Japanese. And they are increasing that lead at an astounding pace.
With the highest quality product, the best electric car brand recognition, the greatest range, and the lowest price point, Tesla should own the global car market by 2025. For decades, their only possible limitation will be the number of cars they can produce, except possibly during recessions.
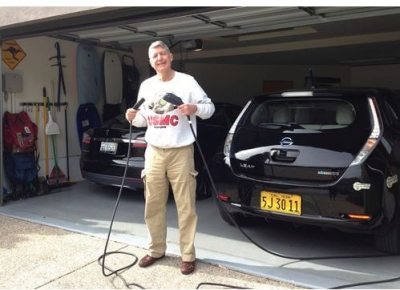
Ad this to the plunging price of solar power, and the cost advantages increase even further. I am already powering my own Tesla S-1 off of my solar panels, and will be adding a second Model X shortly.
It all makes established automakers toast in the 2020?s like General Motors (GM), Daimler Benz (DDAIY), Toyota (TM), and Nissan Motors (NSANY)
You can forget about chasing the stock up here. The Model 3 launch has already been fully discounted by the meteoric 71.4% gain in the stock since February 11.
However, Tesla remains a major holding in long term value funds like Ron Baron?s Baron Capital, and Fidelity. They see further tenfold gains in the share price from here.
The electric power source is, in fact, the least important aspect of the Tesla cars. Here are 16 reasons that are more important:
1) The vehicles have 75% fewer parts than any other, massively reducing production costs. The drive train has 11 parts, compared to over 1,500 for conventional gasoline powered transportation. Tour the factory and it is eerily silent. There are almost no people, just a handful who service the German robots that put these things together.
2) No maintenance is required, as any engineer will tell you about electric motors. You just rotate the tires every 6,000 miles.
3) This means that no dealer network is required. There is nothing to fix, no parts to sell.
4) If you do need to repair something, usually it can be done over the phone. Rebooting the computer addresses most issues. If not, they will send a van to do a repair at your house for free.
5) The car runs at room temperature, not the 500 degrees in standard internal combustion cars. This means that the parts last forever.
6) The car is connected to the Internet 24/7. Once a month it upgrades its own software when you are sleeping. You jump in the car the next morning and a message appears on your screen saying, ?We just upgraded the following 20 Apps.? This is the first car I ever owned that improved itself with age, as I do myself.
7) This is how most of the recalls have been done as well, over the Internet while you are sleeping.
8) If you need to recharge at a public station, it is free. Tesla has its own national network of superchargers that will top you up in minutes, and allow you to drive across the country (see map below). But hotels and businesses have figured out that electric car drivers are the kind of big spending customers they want to attract. So public stations have been multiplying like rabbits. When I first started driving my Nissan Leaf in 2010 there were only 25 charging stations in the Bay Area. There are now over 1,000. They even have them at Costco, Wal-Mart, and McDonalds.
9) No engine means a lot more space for other things, like storage. You get two trunks in the Model-S, a generous one behind, and a ?frunk? in front.
10) Drive an electric car in California, and you are treated like visiting royalty. You can drive in the HOV commuter lanes as a single driver. This won?t last forever, but it?s a nice perk now.
11) There is a large and growing market for all American made products. Tesla has a far higher percentage of US parts (100%) than any of the big three.
12) Since almost every part is made on site at the Fremont factory, supply line disruptions are eliminated. Most American cars are over dependent on Asian supply lines for parts and frequently fall victim to disruptions, like floods and tidal waves.
13) There are almost no controls, providing for more cost savings. Except for the drive train, windows, and turn signals, all vehicle controls are on the touch screen, like a giant iPhone 6 plus.
14) A number of readers have argued that the Tesla really runs on coal, as this is still the source of 36% of the US power supply. However, if you program the car between midnight and 7:00 AM (one of my ideas that Tesla adopted in a recent upgrade), you are using electricity generated by the utilities to maintain grid integrity at night that otherwise goes unused and wasted. How much power is wasted like this in the US every night? Enough to recharge 150 million cars per night!
15) With a waiting list for all new Tesla products, it does not need to advertise. The Detroit Big Three spent $50 billion on advertising last year. Ouch!
16) Oh yes, the car is good for the environment, a big political issue for at least half the country. When these cars become cheaper than conventional gasoline cars with oil at $26 a barrel, the entire country will switch over.
See you in Fremont.
Global Market Comments
March 28, 2016
Fiat Lux
Featured Trade:
(APRIL 19 ATLANTA GLOBAL STRATEGY LUNCHEON),
(DON?T GET SCAMMED BY THE MUTUAL FUNDS),
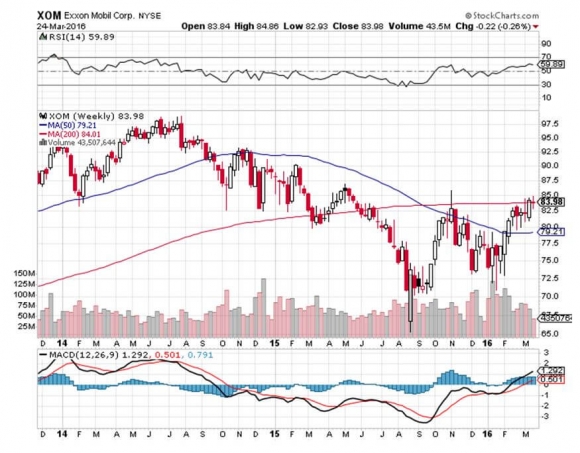
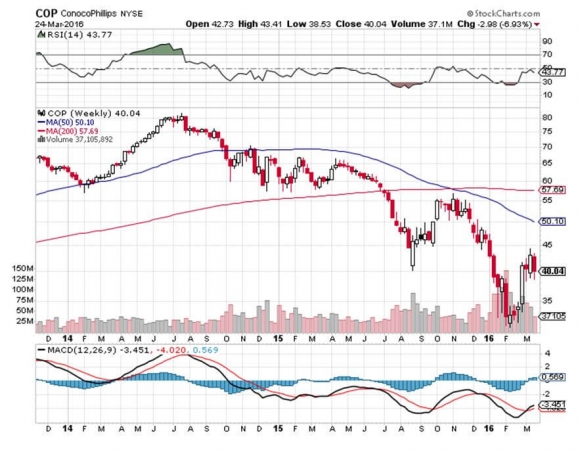
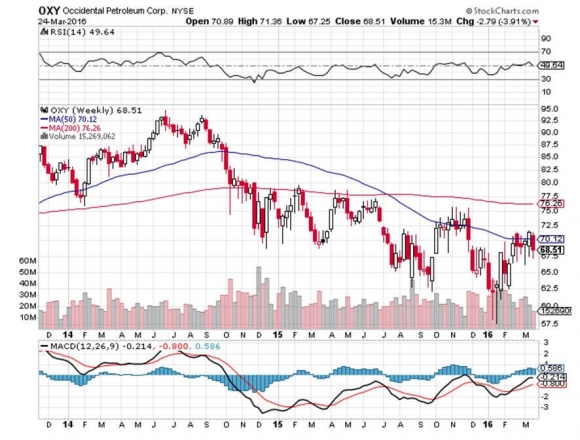
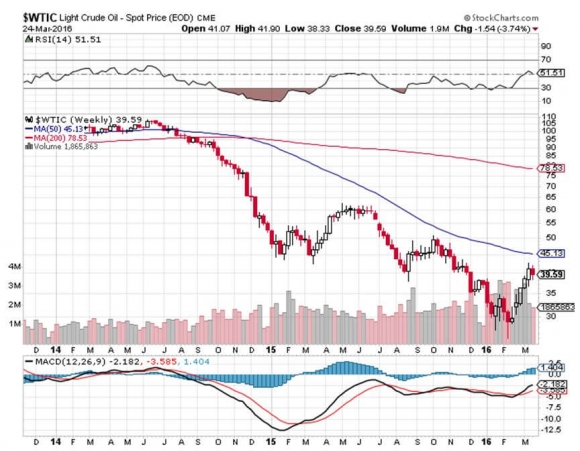
(WHY I LOVE/HATE THE OIL COMPANIES),
?(XOM), (COP), (OXY), (USO)
Exxon Mobil Corporation (XOM)
ConocoPhillips (COP)
Occidental Petroleum Corporation (OXY)
United States Oil (USO)

The first thing I do when I get up every morning is to curse the oil companies as blood sucking scourges of modern civilization.
I then fall down on my knees and thank God that we have the oil companies.
This is why petroleum engineers are getting $100,000 straight out of college, while English and political science major are going straight on to food stamps.
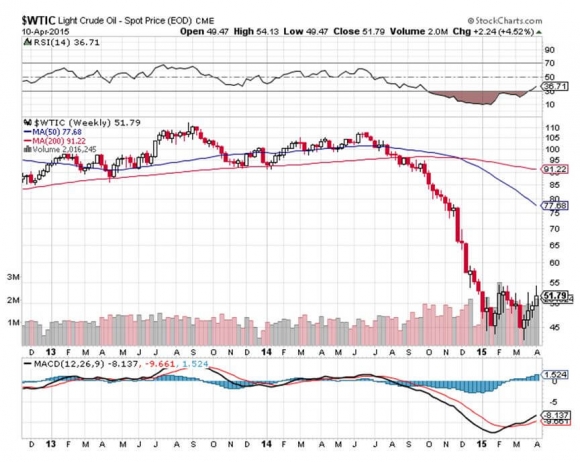
I recommend (XOM) and other oil majors as part of any long-term portfolio. In my lifetime, the price of oil has gone up from $3 a barrel up to $149.
The reasons for the ascent keep growing, from the entry of China into the global trading system, to the rapid growth of the middle class in emerging nations.? They?re just not making the stuff anymore, and we can?t wait around for more dinosaurs to get squashed.
Big oil companies aren?t in the oil speculation business. As soon as a new supply comes on stream, they hedge off their risk through the futures markets or through long-term supply contracts. You can find the prices they hedge at in the back of any annual report.
This is why the oil crash barely caused the shares of oil majors to move. Exxon Mobil (XOM) shares are now down only 15%, while its principal product is off by an astounding 80% from its 2011 top.
When oil made its big run to $149 a few years ago, I discovered to my amazement that (XOM) had already sold most of their supplies in the $20 range. However, oil companies do make huge killings on what is already in the pipeline.
Working in the oil patch 15 years ago pioneering the ?fracking? process for natural gas, I got to know many people in the industry. I found them to be insular, God fearing people not afraid of hard work.
Perhaps this is because the black gold they are pursuing can blow up and kill them at any time. They are also great with numbers, which is why the oil majors are the best-managed companies in the world.
They are also huge gamblers. I swallow hard when I see the way these guys throw around billions in capital, keeping in mind past disasters, like Dome Petroleum, the Alaskan Pipeline oil spill, Piper Alpha, and more recently, the ill-fated Macondo well in the Gulf of Mexico.
But one failure does not slow them down an iota. The ?wildcatting? origins made this a faith-based industry from day one, when praying and dousing wands were the principal determinants of where wells were sunk.
Unfortunately, the oil companies are too good at their job of supplying us with a steady and reliable source of energy. They have one of the oldest and most powerful lobbies in Washington, and as a result, the tax code is riddled with favorite treatment of the oil industry.
While Social Security and Medicare are on the chopping block, the industry basks in the glow of $53 billion a year in tax subsidies.
When I first got into the oil business and sat down with a Houston CPA, the tax breaks were so legion that I couldn?t understand why anyone was not in the oil racket.
Ever wonder why we have had three presidents from Texas over the last 50 years, and are possibly looking at a fourth (Jeb Bush, Rick Perry)?
Three words explain it all: the oil depletion allowance, whereby investors can write off the entire cost of a new well in the first year, while the income is spread over the life of the well.
This also explains why deep-water exploration in the Gulf is far less regulated than California hairdressers.
No surprise then that the industry has emerged in the cross hairs of several presidential candidates, under the ?loopholes? category. Not only do the country?s most profitable companies pay almost nothing in taxes, they are one of the largest users of private jets.
It is an old Washington nostrum that when things start heading south on the domestic front, you beat up the oil companies. It?s the industry that everyone loves to hate.
Cut off the gasoline supply to an environmentalist, and he will be the one who screams the loudest. This has generated recurring cycles of accusatory congressional investigations, windfall profits taxes, and punitive regulations, the most recent flavor we are now seeing.
But imagine what the world would look like if Exxon and its cohorts were German, Saudi, or heaven forbid, Chinese. I bet we wouldn?t have as much oil as we do today, and it wouldn?t be as cheap.
Hate them if you will, but at least these are our oil companies. Try jamming a lump of coal into the gas tank of your Prius and tell me how far you go.
Well, that?s enough ranting for today.
 Love Them, Hate Them or Both?