Global Market Comments
December 24, 2015
Featured Trades:
(A CHRISTMAS STORY),
(THE U-HAUL INDICATOR)
Global Market Comments
December 24, 2015
Featured Trades:
(A CHRISTMAS STORY),
(THE U-HAUL INDICATOR)
Global Market Comments
December 23, 2015
Fiat Lux
SPECIAL SPACE X ISSUE
Featured Trade:
(WILL SPACE X BE YOUR NEXT TEN BAGGER?)
(EBAY), (TSLA), (SCTY), (BA), (LMT)
eBay Inc. (EBAY)
Tesla Motors, Inc. (TSLA)
SolarCity Corporation (SCTY)
The Boeing Company (BA)
Lockheed Martin Corporation (LMT)
Global Market Comments
December 22, 2015
Fiat Lux
Featured Trade:
(THE BOND CRASH HAS ONLY JUST STARTED),
($TNX), (TLT), (TBT),
(TESTIMONIAL)
10 Year Tresury Note Yield INDX ($TNX)
iShares 20+ Year Treasury Bond (TLT)
ProShares UltraShort 20+ Year Treasury (TBT)
Global Market Comments
December 21, 2015
Fiat Lux
Featured Trade:
(IS THERE A BITCOIN IN YOUR FUTURE?)
(TESTIMONIAL)
Global Market Comments
December 18, 2015
Fiat Lux
SPECIAL END OF YEAR ISSUE
Featured Trade:
(GO LONG CHRISTMAS CHEER AND HOT BUTTERED RUM),
(MY LAST RESEARCH PIECE OF THE YEAR)

You are in safe hands now, with your trading portfolios up 41.13% on the year, if you had followed every one of my Trade Alerts to the letter. I know a lot of you made much more.
I will be making a beeline for well on my beachfront estate at Incline Village on the pristine shores of Lake Tahoe and work from there for the next two weeks.
The car will be packed with Christmas presents, ski equipment, snowshoes, board games (yes, ?Qi? is a word in Scrabble), my backpack, and food for 12 guests for a week.
For proof that after working 12 hours a day, six days a week, to make you wealthier and wiser, please read my last research piece of the year, written tongue in cheek.
And what a year it has been. Over 26 trips and 40 speaking engagements in 20 countries, I managed to log 75,000 flight miles, a distance of roughly three times around the world.
Some 250,000 frequent flier miles were posted to my various accounts. Whenever I board Virgin Airlines, the crew lines up at attention and snaps off a brisk salute. Needless to say, first class, for me, is the Land of Milk and Honey.
The research I gathered was enough for me to publish 260 daily letters totaling 350,000 words. That is about half the length of Tolstoy?s War and Peace, but then Tolstoy had to pen his with a quill and ink, not Word for Windows.
I also managed to pump out over 200 trade alerts with a success ratio of 80%.
According to the email traffic, many of you did extremely well. If you are into triple digits, please send me an email. I would love to get a testimonial from you. And this was a year that many professionals describe as the most difficult of their careers.
You know that when they are advertising power tools and Pajamagrams on CNBC, it is time to get out of Dodge. I?ll take the hint.
There, I will consume a suitcase full of research and, after much cogitation and contemplation, write my 2016 Annual Asset Review, which I will publish on Tuesday, January 5, 2015.
I will also be rethinking my business model, so if any of you have suggestions on how I can improve this service, send your thoughts to me at madhedgefundtrader@yahoo.com.
Just put ?suggestions? in the subject line. My intention is to never stop improving the product, to under promise and over deliver.
Please forgive me in advance if I take a few hours catching some ?big air? off of Squaw Valley?s treacherous double X black runs.
If you have any trading questions, please seek me out on the northern section Tahoe Rim Trail around 11,000 feet, where I will be snowshoeing my way around the lake at in subzero temperatures.
I will probably be the only guy up there, so you can just follow the first set of tracks you find. That is, if the timber wolves don?t get you.
I?ll have my Bowie knife and a can of bear spray, so I?ll be fine. As for you, I?m not so sure. This is what I do during my winter leisure time.
During my absence I will be posting some of my favorite pieces from the last year which give insights on how markets will play out over the coming decades.
I have thousands of new subscribers who will be reading these for the first time, and many legacy readers may have missed them the first time around, or forgotten the data because they are older than me.
I hope you find them as another useful step towards your education on the global financial markets. Charts and data have been updated to make them relevant.
Finally, I want to thank you all for an incredible year. I rode the Orient express from London to Venice. I lived in the lap of luxury at the Hotel Cipriani in Venice and at the Raffles in Singapore.
And I managed to haggle the merchants in Tangier's historic bazaar down in price of the most elegant hand made carpets.
I had the opportunity to meet heads of state, CEO?s, top money managers, our nation?s military leaders, and even a Maori chieftain. I had the pleasure of flying the length of the Grand Canyon at low altitude, weaving my way along the Colorado River. And, oh yes, I finally made it to the top of the Matterhorn one more time.
I really did get to rub shoulders with the high and mighty who run the world and harvest their pearls of wisdom, which I passed on to you. I logged 200 hours as a pilot flying to such diverse locations as Molycorp?s (MCP) Mountain Pass mine, the Great Barrier Reef in Australia, and Honda?s loading docks in San Francisco.
I never minded the horrendous jet lag, the well-deserved hangovers, or the traffic jams in China. Your subscriptions to my products, your support of my research, and your endless compliments made it all worth it.
I always tell people that I am not in this for the money, and it?s true.
Not a day goes by when I don?t receive an email from a grateful reader who claims that I have paid off their mortgage, a kid?s college education, a parent?s uninsured operation, or a child?s chemotherapy.
They tell me that I am teaching them to fish; thus, sparing them from the frozen tasteless kind they sell at Safeway, which they must wait in line for to pay inflated prices. You can?t buy that kind of appreciation, not with all the money in the world.
It certainly beats the hell out of spending my retirement scoring a 98 on the local golf course. And I?ll never beat Tiger Woods, no matter how many blonds I date.
To leave you all in the Christmas spirit, I have posted a video and pictures of the Polar Express in Portland, Oregon. Taking my 86-year-old mother for a ride has become an annual event, and it is a thrill for my younger kids as well. To watch a short video of one of the largest steam engines in the world, please click here.
Merry Christmas and Happy New Year to All
Good Trading in 2016!
John Thomas
The Mad Hedge Fund Trader


Global Market Comments
December 17, 2015
Fiat Lux
Featured Trade:
(HOW TO PLAY APPLE IN 2016), (AAPL),
(THE EIGHT WORST TRADES IN HISTORY),
(TESTIMONIAL)
Apple Inc. (AAPL)
Not a day goes by when someone doesn?t ask me about what to do about Apple (AAPL).
After all, it is the world largest company. It is the planet?s most widely owned stock. Almost everyone uses their products in some form or another.
So the widespread interest is totally understandable.
Apple is a company with which I have a very long relationship. During the early 1980?s, I was ordered by Morgan Stanley to take Steve Jobs around to the big New York institutional investors to pitch a secondary share offer for the sole reason that I as one of three people who worked for the firm who was then from California.
They thought one West Coast hippy would easily get along with another. Boy, were they wrong. It was the worst day of my life.
Today, some 200 Apple employees subscribe to the Diary of a Mad Hedge Fund Trader, looking to diversify their substantial holdings. Many own Apple stock with an adjusted cost basis of under $5. Suffice it to say, they all drive really nice Prius?s.
So I get a lot of information about the firm far above and beyond the normal effluent of the media and stock analysts. That?s why Apple has become a favorite target of my Trade Alerts over the years.
And here is the take: You don?t want to touch the stock during the first quarter of 2016.
And here?s why. Apple is all about the iPhone, which accounts for 75% of its total earnings. The TV, the watch, the car, iPods, the iMac, and Apple pay are all a waste of time, and consume far more coverage than they are collectively worth.
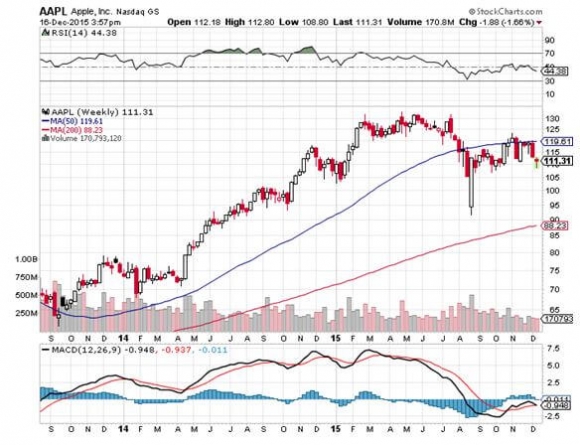
The good news is that iPhone sales are subject to a fairly reliable cycle. Apple launches a major new iPhone every other fall. The share price peaks shortly after that. The odd years see the introduction of the ?S? models. But these are minor upgrades, not generational changes.
So during those in between years, the stock performance is disappointing. 2015 certainly has followed this script, with Apple up a modest 1.2% YTD as of this writing.
The coming quarter could be especially scary.
Just like you see a big pull back in the tide before a tsunami hits, iPhone sales are flattening out. This is because consumers start delaying purchases in expectation of the introduction of the iPhone 7 in September 2016 with far more power, gadgets, and gizmos.
Channel checks, however dubious these may be, are already confirming the slowdown of orders for iPhone related semiconductors from suppliers you would expect from such a downturn.
The weakness assures that the current selloff will continue. With any luck, you might be able to pick up shares in the $90?s, last seen during the August 25 flash crash.
However, after March things will start to get interesting, especially post the Q1 earnings report in April. That?s when investors will start to discount the rollout of the iPhone 7 five months later.
The last time this happened, in 2014, Apple stock rocketed by 88.5%. This time, I expect at least a 50% increase to $150, if you can get in around $100.
After all, I am such a conservative guy with my predictions..
Even at that price, it will still be one of the cheapest stocks in the market on a valuation basis. The value players will have not choice to join in, if they?re not already there.
But Apple is a much bigger company this time around, and well-established cycles tend to bring in diminishing returns. It?s like watching the declining peaks of a bouncing rubber ball.
The bull case for Apple isn?t dead, it is just resting.
The China business will continue to grow nicely. Their new lease program promises to deliver a faster upgrade cycle that will allow higher premium prices for their products. That will bring larger profits.
Just thought you?d like to know.
Global Market Comments
December 16, 2015
Fiat Lux
Featured Trade:
(SETTING UP THE ?BUY? FOR JUNK BONDS),
(SJB), (JNK), (HYG),
(THE LIQUIDITY CRISIS COMING TO A MARKET NEAR YOU),
(TLT), (TBT), (MUB), (LQD),
(TESTIMONIAL)
ProShares Short High Yield (SJB)
SPDR Barclays High Yield Bond ETF (JNK)
iShares iBoxx $ High Yield Corporate Bd (HYG)
iShares 20+ Year Treasury Bond (TLT)
ProShares UltraShort 20+ Year Treasury (TBT)
iShares National AMT-Free Muni Bond (MUB)
iShares iBoxx $ Invst Grade Crp Bond (LQD)
Probably the best Trade Alert of 2015 that I wrote up, but never sent out, was for the ProShares Short High Yield ETF (SJB). That is a bet that makes money when the prices for junk bonds fall.
Back in May, it was clear to me that junk bond prices had hit ?LALA land.? Yields were only 200 basis points above similar maturity Treasury bonds.
Risk was being wildly mispriced. Investors were taking on a whole lot of principal risk, but were barely compensated for it.
It was a classic reach for yield. This only ends in tears.
The reason I didn?t pull the trigger is that when you sell short any kind of bond or equity, you become liable for paying the interest or the dividend. In the high yield junk realm at the time, that meant forking out 5% per annum.
That?s a big nut to cover in order to make a profit. To end up in the green on a position like this, your timing has to be perfect. Paying that kind of carry, you pretty much want prices to stat falling immediately.
As it turned out, holding firm at the time was the right thing to do. While I nailed the high for the year, Junk bonds (HYG), (JNK) declined, but not by much. Then in August, they fell like a ton of bricks.
Here we are seven months later in a completely different world.
All of the trades that prospered mightily from quantitative easing are being unwound in a hurry.
It seems like investors are only just waking up to the implications of the demise of an aggressive monetary policy that met its demise 14 months ago. It?s a bit like closing the barn door after the horses have bolted.
However, it took this week?s imminent interest rate rise from the Federal Reserve to really bring matters to a head.
Junk bonds are now yielding 9.0%, while energy related paper is well into double digits. The talk is that as many as 25% of energy junk bonds will default (click here for ?Here Comes the Final Bottom in Oil? ).
Two junk bond funds have gone under, refusing to honor redemption requests from owners. Prices are in free fall. It all has the flavor of a final capitulation.
Which means that I am finally stating to get interested in junk bonds.
This is the problem with this market. Junk bonds are the last holdout of old fashioned traders. No two issues look alike, so they can?t be commoditized. That means they can?t be subject to automated online trading. High frequency traders never touch them.
If you want to trade in junk bonds, you have to call around to other traders and investors and ask if they have any interest. You keep calling until you find someone willing to take the other side of your trade.
Needless to say, this is a tedious and time-consuming process. It is a lot like the trading world I first joined in the 1970?s.
Another problem is that Dodd Frank has banned the big banks and brokers from taking positions in this paper like they used to. That means there is no final supplier of liquidity, so it is worse than it has ever been.
It is a good rule of thumb that the junk bond yield roughly reflects the market?s default expectations. So the present 9% yield means investors expect approximately 9% of the paper to default.
And here is where you make the money.
Markets tend to wildly overshoot with their expectations. In 2009 junk bonds carried a 25% yield. The actual default rate that followed was only 2%.
Markets then spent five year repricing this reality into these securities. As a result, junk bonds were one of the best investments you could have made back then.
They were the subject of regular strong ?BUY? recommendations by the Mad Hedge Fund Trader. They eventually more than doubled in value. That?s a lot for a bond.
While today?s 9% is nowhere near 25%, we are also in nothing like a 2009 financial collapse. Call the current volatility a correction, a bout of nervousness, a setback, or even a frisson. End of the world stuff it isn?t.
Which leads me to believe that at 9%, you are being fairly compensated for your risk.
You wanted to reach for yield? Now there is some yield to reach for.
9% covers a multitude of sins.