Featured Trade:
(THE MUNI BOND MYTH),
(MUB), (TLT), (JNK), (ACTHX),
(BEWARE THE COMING EQUITY CAPITAL FAMINE)
iShares S&P National AMT-Free Muni Bd (MUB)
iShares Barclays 20+ Year Treas Bond (TLT)
SPDR Barclays High Yield Bond (JNK)
Invesco High Yield Muni A (ACTHX)
https://madhedgefundtrader.com/wp-content/uploads/2019/05/cropped-mad-hedge-logo-transparent-192x192_f9578834168ba24df3eb53916a12c882.png00Mad Hedge Fund Traderhttps://madhedgefundtrader.com/wp-content/uploads/2019/05/cropped-mad-hedge-logo-transparent-192x192_f9578834168ba24df3eb53916a12c882.pngMad Hedge Fund Trader2013-02-12 23:03:552013-02-12 23:03:55February 13, 2013
Have I seen this movie before? Four years ago, analysts were predicting default rates as high as 17% for Junk bonds in the wake of the financial meltdown, taking yields on individual issues up to 25%.
Liquidity in the market vaporized, and huge volumes of unsold paper overhung the market. To me, this was an engraved invitation to come in and buy the junk bond ETF (JNK) at $18. Since then, the despised ETF has risen to $41, and with the hefty interest income, the total return has been over 160%. What was the actual realized default rate? It came in at less than 0.50%.
Fast forward to two years ago (has it been that long?). Bank research analyst Meredith Whitney predicted that the dire straits of state and local finances will trigger a collapse of the municipal bond market that will resemble the ?Sack of Rome.? She believed that total defaults could reach $100 billion. This cataclysmic forecast caused the main muni bond ETF (MUB) to plunge from $102 to $93. Oops! That turned out to be one of the worst calls in the history of the financial markets. But the fees she earned making such a bold prediction landed her on Fortune?s list of the wealthiest women in America.
I didn?t buy it for a second. States are looking at debt to GDP ratios of 4%, compared to 100% for the federal government. They are miles away from the 130% of GDP that triggered distressed refinancing?s by Italy, Greece, Portugal, and Ireland.
The default risk of muni paper is being vastly exaggerated. I have looked into several California issues and found them at the absolute top of the seniority scale in the state's obligations. Teachers will starve, police and firemen will go on strike, and there will be rioting in the streets before a single interest payment to bond holders is missed.
How many municipal defaults have we actually seen in the last 20 years? There have only been a few that I know of. The nearby City of Vallejo, where policemen earn $140,000 a year, is one of the worst run organizations on the planet. Orange County got its knickers in a twist betting their entire treasury on a complex derivatives strategy that they clearly didn't understand, sold by, guess who, Goldman Sachs (GS). The Harrisburg, PA saga continues. To find municipal defaults in any real numbers you have to go back 80 years to the Great Depression. My guess is that we will certainly see a rise in muni bond defaults. But it will be from two to only a dozen, not the hundreds that Whitney is forecasting.
Let me preface my call here by saying that I don?t know much about the muni bond market. It has long been a boring, quiet backwater of the debt markets. At Morgan Stanley, this is where you sent the new recruits with the 'C' average from a second tier school who you had to hire because his dad was a major client. I have spent most of my life working with top hedge funds, offshore institutions, and foreign governments for whom the tax advantages of owning munis have no value.
However, I do know how to use a calculator. Decent quality muni bonds now carry 3% yields. If you buy bonds from your local issuer, you can duck the city, state, and federal tax due on equivalent grade corporate paper. That gives you a pre tax yield of 6%. While the market has gotten a little thin, prices from here are going to get huge support from these coupons.
Since the tax advantages of these arcane instruments are highly local, sometimes depending on what neighborhood you live in, I suggest talking to a financial adviser to obtain some tailor made recommendations. There is no trade for me here. I just get irritated when conflicted analysts give bad advice to my readers and laugh all the way to the bank. Thought you should know.
There are two additional tail winds that munis may benefit from in 2013. No matter what anyone says, your taxes are going up. Balancing the budget without major revenue increases is a mathematical impossibility. That will increase the value of the tax-free aspect of munis. A serious bout of ?RISK OFF? that sends the Treasury market to a new all-time high, as I expect this summer, will cause munis to rise even further.
Perhaps the best way to play this area is through the Invesco High Yield Muni A Fund (ACTHX), which boasts a positively Olympian 5.56% tax-free yield.
This is Not the Muni Bond Market
https://www.madhedgefundtrader.com/wp-content/uploads/2013/02/Sculpture.jpg337258Mad Hedge Fund Traderhttps://madhedgefundtrader.com/wp-content/uploads/2019/05/cropped-mad-hedge-logo-transparent-192x192_f9578834168ba24df3eb53916a12c882.pngMad Hedge Fund Trader2013-02-12 23:02:272013-02-12 23:02:27The Muni Bond Myth
The world is about to suffer an acute shortage of equity capital over the next eight years, which could total $12.3 trillion. That is the conclusion of the McKinsey Global Institute, an affiliate of McKinsey &Co., a great well of long-term economic thinking which I have been drawing from for the last 40 years.
The cause of the coming debacle is quite simple. Investable assets in the emerging world with minimal experience in equity investment are growing four times faster than those in the developed world. While developed countries own 80% of the world?s $196 trillion in assets today, that share is expected to decline to 64% by 2020. This means that, by far, the greatest growth in assets will be in countries where managers have the least experience in equity investment.
The reasons for the waning interest in equities in the West are well known. For a start, the performance of developed stock markets has been terrible, with one ?lost decade? behind us, and another ahead. Aging populations wind down equity investment as they get older, shifting an ever-larger share of their assets into bonds and cash. The rise of defined contribution plans shifts a greater focus on fixed income investments. More money is going into hedge funds and private equities. The regulatory burden of Dodd-Frank is scaring many banks out of stock brokerage into safer managed alternatives. When stocks aren?t being ?sold?, no one buys them.
Anyone who has ever tried to sell equities to emerging market investors, like myself, can tell you the challenges they run up against. Much of the region?s assets are controlled by quasi-government institutions with a much greater debt orientation. Equity issuance is very expensive and tightly regulated. Corporate transparency and government oversight is a joke. No one believes the figures that are coming out of China.
Minority shareholders have no say and few rights, with annual meetings often over in an hour. There also is a long cultural tradition of keeping your wealth tied up in gold and silver instead of paper assets. No surprise then, that most emerging market investors view equities as riskier and more speculative than they are in the West and would rather keep their money elsewhere.
A shortage of equity capital is likely to make stock markets even less attractive than they recently have been. It will force companies to use more leverage, which will create greater volatility in earnings and share prices. A smaller equity cushion will lead to a higher frequency of bankruptcies during hard times. High growth companies, such as in technology, will have a particularly tough time raising capital, and IPO markets could dry up from the lack of money.
The net result of these anti-equity trends is that yields will have to rise substantially to become more competitive with bonds. Companies can achieve this by either raising dividends or watching share prices fall. This may be the reason behind soaring dividend yields globally over the last three years. The price of admission for equity capital hungry corporations is going up, big time. The $100 billion plus equity requirements of troubled European banks only exacerbate this situation.
The only way around this crisis is for investment banks to greatly step up their marketing efforts in the emerging markets, especially in China. The Middle Kingdom?s investable assets are expected to soar 328% from $19.8 trillion to $65 trillion by 2020. That will make it one of the world?s largest markets for investment products in a very short time. Major firms, like Morgan Stanley, Goldman Sachs, JP Morgan, Sogen, and UBS have already made massive investments in the region to boost business there.
To read the McKinsey piece in full, please click here. Better start learning Mandarin if you want to stay in the brokerage business.
What! No Equity Takers in Asia?
https://www.madhedgefundtrader.com/wp-content/uploads/2013/02/Brokers.jpg232298Mad Hedge Fund Traderhttps://madhedgefundtrader.com/wp-content/uploads/2019/05/cropped-mad-hedge-logo-transparent-192x192_f9578834168ba24df3eb53916a12c882.pngMad Hedge Fund Trader2013-02-12 23:01:262013-02-12 23:01:26Beware the Coming Equity Capital Famine
Featured Trade:
(TRADE ALERT SERVICE POSTS NEW ALL TIME HIGH),
(SPY), (IWM), (FCX), (AIG), (FXY), (YCS),
(DON?T GET CAUGHT IN THE NEXT REAL ESTATE BUBBLE),
(PHM), (LEN), (KBH)
(WHY WATER WILL SOON BECOME MORE VALUABLE THAN OIL), (CGW), (PHO), (FIW), (VE), (TTEK), (PNR),
(TESTIMONIAL)
SPDR S&P 500 (SPY)
iShares Russell 2000 Index (IWM)
Freeport-McMoRan Copper & Gold Inc. (FCX)
American International Group, Inc. (AIG)
CurrencyShares Japanese Yen Trust (FXY)
ProShares UltraShort Yen (YCS)
PulteGroup, Inc. (PHM)
Lennar Corp. (LEN)
KB Home (KBH)
Guggenheim S&P Global Water Index (CGW)
PowerShares Water Resources (PHO)
First Trust ISE Water Idx (FIW)
Veolia Environnement S.A. (VE)
Tetra Tech Inc. (TTEK)
Pentair Ltd. (PNR)
https://madhedgefundtrader.com/wp-content/uploads/2019/05/cropped-mad-hedge-logo-transparent-192x192_f9578834168ba24df3eb53916a12c882.png00Mad Hedge Fund Traderhttps://madhedgefundtrader.com/wp-content/uploads/2019/05/cropped-mad-hedge-logo-transparent-192x192_f9578834168ba24df3eb53916a12c882.pngMad Hedge Fund Trader2013-02-12 09:41:382013-02-12 09:41:38February 12, 2013
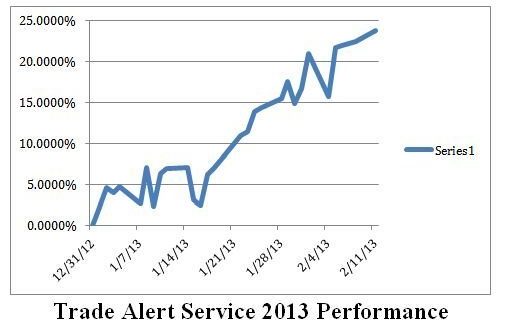
The Trade Alert Service of the Mad Hedge Fund Trader has posted a 23.76% profit year to date, taking it to another new all time high. The 26-month total return has punched through to an awesome 78.81%, compared to a miserable 14% return for the Dow average during the same period. That raises the average annualized return for the service to 36.4%, elevating it to the pinnacle of hedge fund ranks.
My bet that the stock markets would move sideways to up small has paid off big time, as I continued to run sizeable long positions in the S&P 500 and the Russell 2000 (IWM). My substantial short volatility positions are contributing to profits daily. I booked nice profits from holdings in American International Group (AIG) and copper producer, Freeport McMoRan (FCX). I also prudently doubled up my short positions in the Japanese yen.
Is has truly been a month where everything is working. Even my short positions in deep out of the money calls on the (SPY) are breaking. While the (SPY) has been going up, it has not been appreciating fast enough to hurt the position. All told, the last 18 consecutive recommendations of the Trade Alert Service have been profitable. I have eight trades to go to beat this record.
Global Trading Dispatch, my highly innovative and successful trade-mentoring program, earned a net return for readers of 40.17% in 2011 and 14.87% in 2012. The service includes my Trade Alert Service, daily newsletter, real-time trading portfolio, an enormous trading idea database, and live biweekly strategy webinars. To subscribe, please go to my website at www.madhedgefundtrader.com, find the ?Global Trading Dispatch? box on the right, and click on the lime green ?SUBSCRIBE NOW? button.
https://www.madhedgefundtrader.com/wp-content/uploads/2013/02/TA-Performance-2013.jpg338506Mad Hedge Fund Traderhttps://madhedgefundtrader.com/wp-content/uploads/2019/05/cropped-mad-hedge-logo-transparent-192x192_f9578834168ba24df3eb53916a12c882.pngMad Hedge Fund Trader2013-02-12 09:39:392013-02-12 09:39:39Trade Alert Service Posts New All Time High
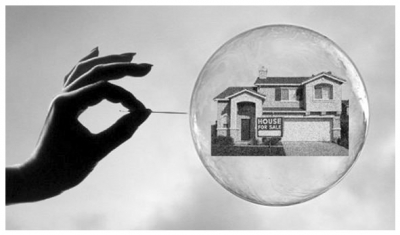
Before you place a down payment on that next home, consider that you are voluntarily becoming dependent on government welfare, reliant on massive subsidies, and may become the next ward of the state.
Don?t kid yourself that the housing market has become anything but another bubble driven by artificially low interest rates and lax lending standards. Without the wholesale privatization of profits and socialization of losses, the current ebullient real estate market would instantly cease to exist. That cruel ending may be a lot closer than you think, as well.
Some 95% of all home mortgages are now bought by the US home mortgage agencies, Fannie Mae and Freddie Mac. That is up from only 35% in 2006. Never mind that both of these institutions are in conservatorship, which is a polite way of saying they are bankrupt, having burned through all of their capital during the housing bust.
Without this source of government funds, there is absolutely no way banks would be lending anywhere near the amount they are, as the spreads have become too minuscule to make it worthwhile. But by selling loans to the government they can offload their risk and skim off handsome fees along the way.
This is why the balance sheet of the Federal Reserve has grown to a mind boggling $3.8 trillion, on its way to $5 trillion, but we are measuring no real growth in the money supply. The money is simply moving from one government account to another, untouched by human hands.
The current pattern of modest appreciation in the most oversold markets, like Miami, Phoenix, and Las Vegas, will continue, as long as the Fed is giving us money for free and the government is bearing all the credit risk. When that ends, things could turn very ugly, very fast.
Most of my hedge fund friends expect ten-year Treasury yields to be back above 4% in two years. That would take the rates for the conventional 30-year fixed rate home loans from 3.50% to 6%, or more. Double the cost of carry on a house, and you halve the affordability. The effects on the secondary market would be devastating.
While many have nice paper profits on houses they bought over the last two years, that all becomes very academic if you can?t sell. The number of homeowners currently delinquent or in foreclosure would soar from the current 6 million to 16 million. That would be piled on top of the 30 million hapless homeowners, who, despite the bounce, are still underwater on their mortgages.
This is not some wild conspiracy theory that I picked up on the Internet. Since congress is in a cost cutting mood, the chances of Fannie Mae and Freddie Mac getting sufficient recapitalization are small. The home mortgage tax deduction is also on the chopping block. At the very least, we can expect it to get pared back to mortgages of $500,000 or less. That would seriously boost the real after tax cost of homeownership, especially on the high priced left and right coasts.
Of course, the good times will continue as long as the Fed is spiking the punchbowl. Buyers are strongly motivated by existing home prices that are half of the new cost of construction, as well as a fraction of 2006 peak prices. As my friends say in New Orleans, where great deals are still to be had, ?Laissez les bons temps rouler? (let the good times roll).
Current guidance says they will maintain ultra low interest rates until the unemployment rate falls below 6.5%, down from the present 7.8%, which we could see in two years. Those driven more by demographic data, like me, don?t see such a turnaround for five more years.
I am not seeing another crash here. A more likely scenario is that we continue to bounce along a bottom for several more years. Tell me how bullish prospective homebuyers will be after we see a 2,000-point plunge in the Dow, which could come as early as this summer.
What this does illustrate is how grotesquely expensive the homebuilding stocks have become, like Lennar (LEN), Pulte Home (PHM), and KB Homes (KB). These stocks are up as much as 700% in 18 months. This entire piece is in response to a question I got yesterday, Should I be buying the homebuilders here. My answer is a full throated ?NO!?
The only bull market you can really count on is the one for rents, which will accelerate, once the long term decline in homeownership resumes.
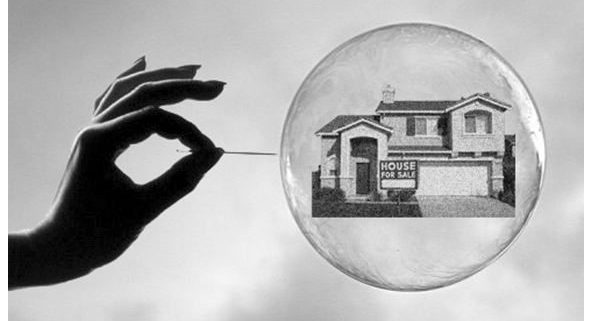
https://www.madhedgefundtrader.com/wp-content/uploads/2013/02/House-in-Bubble-e1537894130784.jpg235400Mad Hedge Fund Traderhttps://madhedgefundtrader.com/wp-content/uploads/2019/05/cropped-mad-hedge-logo-transparent-192x192_f9578834168ba24df3eb53916a12c882.pngMad Hedge Fund Trader2013-02-12 09:36:552018-09-25 16:49:15Don't Get Caught in the Next Real Estate Bubble
If you think that the upcoming energy shortage is going to be bad, it will pale in comparison to the next water crisis. So investment in fresh water infrastructure is going to be a great recurring long-term investment theme. One theory about the endless wars in the Middle East since 1918 is that they have really been over water rights.
Although Earth is often referred to as the water planet, only 2.5% is fresh, and three quarters of that is locked up in ice at the North and South poles. In places like China, with a quarter of the world's population, up to 90% of the fresh water is already polluted, some irretrievably so. Some 18% of the world population lacks access to potable water, and demand is expected to rise by 40% in the next 20 years.
Aquifers in the US, which took nature millennia to create, are approaching exhaustion. While membrane osmosis technologies exist to convert sea water into fresh, they use ten times more energy than current treatment processes, a real problem if you don't have any, and will easily double the end cost of water to consumers. While it may take 16 pounds of grain to produce a pound of beef, it takes a staggering 2,416 gallons of water to do the same. Beef exports are really a way of shipping water abroad in concentrated form.
The UN says that $11 billion a year is needed for water infrastructure investment and $15 billion of the 2008 US stimulus package was similarly spent. It says a lot that when I went to the University of California at Berkeley School of Engineering to research this piece, most of the experts in the field had already been retained by major hedge funds!
At the top of the shopping list to participate here should be the Claymore S&P Global Water Index ETF (CGW), which has appreciated by 14% since the October low. You can also visit the PowerShares Water Resource Portfolio (PHO), the First Trust ISE Water Index Fund (FIW), or the individual stocks Veolia Environment (VE), Tetra-Tech (TTEK), and Pentair (PNR). Who has the world's greatest per capita water resources? Siberia, which could become a major exporter of H2O to China in the decades to come.
https://www.madhedgefundtrader.com/wp-content/uploads/2013/02/Water-Fall.jpg249365Mad Hedge Fund Traderhttps://madhedgefundtrader.com/wp-content/uploads/2019/05/cropped-mad-hedge-logo-transparent-192x192_f9578834168ba24df3eb53916a12c882.pngMad Hedge Fund Trader2013-02-12 09:33:352013-02-12 09:33:35Why Water Will Soon Become More Valuable Than Oil
Featured Trade: (IS IT TIME TO BUY TECHNOLOGY STOCKS), (AAPL), (MSFT), (GOOG), (QQQ), (BAC), (JPM), (XOM), (CAT), (PG), (NFLX), (AN AFTERNOON WITH CALIFORNIA GOVERNOR JERRY BROWN)
Apple Inc. (AAPL)
Microsoft Corporation (MSFT)
Google Inc. (GOOG)
PowerShares QQQ (QQQ)
Bank of America Corporation (BAC)
JPMorgan Chase & Co. (JPM)
Exxon Mobil Corporation (XOM)
Caterpillar Inc. (CAT)
Procter & Gamble Co. (PG)
Netflix, Inc. (NFLX)
https://madhedgefundtrader.com/wp-content/uploads/2019/05/cropped-mad-hedge-logo-transparent-192x192_f9578834168ba24df3eb53916a12c882.png00Mad Hedge Fund Traderhttps://madhedgefundtrader.com/wp-content/uploads/2019/05/cropped-mad-hedge-logo-transparent-192x192_f9578834168ba24df3eb53916a12c882.pngMad Hedge Fund Trader2013-02-11 09:30:502013-02-11 09:30:50February 11, 2013
Call it the shot heard round the world. David Einhorn?s lawsuit against tech goliath Apple (AAPL) has focused a giant spotlight on what has been one of the worst performing stock market sectors of 2013-- large old technology stocks. Could this be the set up for the biggest sector rotation of the year?
Most of the price action in this year can be divided into kinds: big cap banks and industrials, and what I call garbage. So the shares of Bank of America (BAC), JP Morgan (JPM), Caterpillar (CAT), Procter & Gamble (PG), and Exxon (XOM) have been going through the roof. Garbage stocks, best represented by Netflix (NFLX) have done even better, largely driven by the desperate short covering of big hedge funds.
The Einhorn suit resonated with many of the long suffering owners of Apple, which has seen the value of their holdings plunge 38% since the September $706 peak. His basic message is that the company?s many past near death experiences have fostered a depression mentality where there is no such thing as too much cash.
As a result, $130 billion sits in T bills and money market funds earning nothing, the largest such accumulation in history. Just this hoard, alone, would rank as America?s 19th largest company by market capitalization.
Such conservatism in management is laudable. But Einhorn argues that it has been taken to such extremes at Apple that it has crossed the boundary into mismanagement and malfeasance. The activist shareholder wants the company to return money to shareholders in the form of high dividends and stock buybacks. Such action could trigger a rapid doubling in the value of the stock.
The litigation was enough to ignite a 10% in Apple stock last week. I think David is interested in far more than just this. Is this the final bottom for the beleaguered company? Is it time to buy? The NASDAQ Index certainly things so. Check out the chart below and you?ll see that the action in Apple enabled it to bust out of its recent torpor to the upside.
The really interesting possibility is that the rebirth of Apple could have major implications for the market as a whole. Survey the landscape these days, and you find shares that are either extremely overbought, or extremely oversold. If money shifts from the leaders to the laggards, it could give the indexes enough juice to take another, and possibly final leg upward.
I just thought you?d like to know.
Apple: More Than Just a Bounce?
https://www.madhedgefundtrader.com/wp-content/uploads/2013/02/Apple.jpg291267Mad Hedge Fund Traderhttps://madhedgefundtrader.com/wp-content/uploads/2019/05/cropped-mad-hedge-logo-transparent-192x192_f9578834168ba24df3eb53916a12c882.pngMad Hedge Fund Trader2013-02-11 09:28:182013-02-11 09:28:18Is It Time to Buy Technology Stocks?
On my last trip to my lakefront estate at Lake Tahoe, I stopped off at the state capital, Sacramento, to look in on my old friend, Governor Jerry Brown. It is crucial that readers across the country, and indeed, around the world, know what Jerry is thinking. California has always been a ?pathfinder? state, and what starts here is often adopted across the country. This little chat could be a hint of what?s headed your way.
As I bounded up the steps of the marble capitol building, the first thing I noticed was the absence of the previous governor, Arnold Schwarzenegger?s, smoking tent. The governator had it erected on the lawn so he could enjoy long puffs on his stogies and not be in violation of the state ban on indoor smoking. This was in the state that invented the anti-smoking movement.
I have trod a very long path with Jerry Brown. His dad, then Governor Pat Brown, ordered teargas dropped on me from a helicopter while I was at a Berkeley anti-war march nearly half a century ago. He was Secretary of State while I attended the University of California, often going head to head against then governor Ronald Reagan.
I was in Asia during his first two terms as governor from 1975-83, when his girlfriend, Linda Ronstadt, called him the ?moonbeam governor?, a nickname he has yet to live down. Warning: don?t call him that to his face.
I ran into him at the Democratic convention in New York in 1980 when he mounted his second run for the presidency. After he retired and was considered a political has-been, I bumped into Jerry once again when he studied Zen Buddhism in Japan.
In 1999, he was elected mayor of Oakland, a mostly black Bay Area slum near bankruptcy, which many considered ungovernable. He did a spectacular job, fighting corruption, rebuilding the school system, and sparking an economic renaissance. It was like he had nothing left to lose.
To the amazement of many, Jerry ran and won a third term as governor in 2011, taking over the wreckage left by the disastrous reign of Arnold Schwarzenegger. He has been raising eyebrows nationally ever since.
He immediately launched a crash campaign to raise taxes and cut spending. His Proposition 30 succeeded at the polls, raising sales taxes for everyone and boosting income taxes on those earning more than $500,000. The Golden State now has the highest combined federal and state taxes in the country, at 51.5%. The proceeds of the tax hike are solely dedicated to increasing $6 billion in spending on education.
State leaders learned a long time ago that people will pay a premium to live here. They pay double for housing, so why not double taxes? The sunshine has value. As I explain to guests at my strategy luncheons, high earners don?t mind paying an extra dollar in tax when it means they can make and extra $10, or $100, in profits. That has been the case with a technology industry here that has been booming almost non-stop since WWII.
Brown originally studied at a seminary school to become a catholic priest. To this day, he frequently quotes from the Bible, and he gave my Latin a real workout. Citing Luke, Chapter 12, verse 48 with regards to the sharing of the tax burden, ?to those who are given much, much is required.? The seven-year sunset provision for the new income tax also comes from the ?seven years of plenty?, found in the Old Testament.
He argues that this is only fair, since the top 1% of state earners have seen their income increase by 165% since 1980, while the bottom 80% have seen an 8% drop. The top 1% took 10% of state incomes in the seventies. Now it is 22%.
To say Jerry is iconoclastic is a disservice to the word. He is a combative 75 year old who says what he thinks at the drop of a hat, no matter whom it offends, be they friend or foe. He is a mix that is all too rare in this country, a flaming liberal on social issues, while an ironclad conservative on fiscal matters.
He is a staunch advocate for the environment. He appointed the first gay judge in the US. He is about to deliver the toughest anti-gun legislation in the country. He has been a lifelong cheerleader for the alternative energy industry.
Brown has also completed the most ambitious cuts in social spending in the state?s history, including grants for the disabled, child welfare, and Medical. Some 40,000 non-violent inmates were released from prisons into probation to save money. The University of California saw its budget cut by a massive 25%. State employment was chopped by 50,000, and some 50 redundant state boards were eliminated.
Jerry told me that the state?s problems were caused by two bubbles; the Internet one in 2000, and the indiscriminate mortgage lending that followed. That created a budget deficit that ballooned to $27 billion by the time he returned to office, which cut the California?s credit rating to the lowest of the 50 states. In a short 18 months, Brown balanced the budget, and state debt is now rapidly seeing upgrades, reducing borrowing costs.
The governor says that the spending cuts have been very tough to swallow. Even the carpet in his office is falling apart, and he confesses to eating day old tuna sandwiches. On the tax front, he says that ?when you have more in the cookie jar, you have more cookies to give.?
Jerry says his goals as governor were threefold. He eliminated false accounting gimmicks, which shuffled the state?s financial problems under the carpet, where they festered. He only implemented new taxes if people voted for them. And he returned decision making to cities and counties on schools, because the entities closest to problems have best ability to solve them, a policy he calls ?realignment?. Decentralization and devolution of power to local authorities isn?t something you hear about from liberals very often.
He points out that the big growth in state spending didn?t arise from some idealistic social agenda. Three strikes law mandating extremely long sentences caused an explosive growth of the prison system, which expanded from 3% to 11.5% of the state budget since the seventies. ?An aging population is also prompting a substantial increase in medical spending. These two items alone account for the entire increase in state spending for the past 40 years on a GDP adjusted basis.
I asked Jerry what he thought about the efforts by other tax-free states, particularly Texas, to lure business away. He erupted into a tirade. He argued passionately there was absolutely no evidence that people moved to avoid taxes, which amount to only a few thousand dollars a year for millionaires.
The economy here is booming. The best and the brightest minds in the world are pouring into the most creative and innovative place on the planet. There have been 300,000 private sector jobs created during his current tenure. Exports are up 17%. The state draws 50% of global venture capital investment, and files for four times more patents than runner up New York. The one-ton truck now driving around Mars was built in Pasadena.
My obvious last question had to be ?what?s next? for the energetic governor. Might his tax raising, spending cutting habits have a national audience? ?Do I have more offices in mind? I?m not telling,? he answered, with a twinkle in his eye. That is a lot to say for someone who has already held every high office in his home state.
I got a call from my car telling me it was time to get moving if we were going to make it over Donner Pass before it iced up. I said, ?see you next time? to Jerry. There always seems to be a next time with Jerry.
?What a Long, Strange Trip It?s Been.?
https://www.madhedgefundtrader.com/wp-content/uploads/2013/02/Jerry-Brown-2.jpg274569Mad Hedge Fund Traderhttps://madhedgefundtrader.com/wp-content/uploads/2019/05/cropped-mad-hedge-logo-transparent-192x192_f9578834168ba24df3eb53916a12c882.pngMad Hedge Fund Trader2013-02-11 09:23:422013-02-11 09:23:42An Afternoon With California Governor Jerry Brown
Legal Disclaimer
There is a very high degree of risk involved in trading. Past results are not indicative of future returns. MadHedgeFundTrader.com and all individuals affiliated with this site assume no responsibilities for your trading and investment results. The indicators, strategies, columns, articles and all other features are for educational purposes only and should not be construed as investment advice. Information for futures trading observations are obtained from sources believed to be reliable, but we do not warrant its completeness or accuracy, or warrant any results from the use of the information. Your use of the trading observations is entirely at your own risk and it is your sole responsibility to evaluate the accuracy, completeness and usefulness of the information. You must assess the risk of any trade with your broker and make your own independent decisions regarding any securities mentioned herein. Affiliates of MadHedgeFundTrader.com may have a position or effect transactions in the securities described herein (or options thereon) and/or otherwise employ trading strategies that may be consistent or inconsistent with the provided strategies.