Ben Bernanke finally did the deed. He tapered his quantitative easing program, from $85 to $75 billion a month. I thought he would wait until next month for incoming Fed governor Janet Yellen to take the helm, and the responsibility. It was not to be.
The good news for followers of my Trade Alert Service was that it didn?t matter. $85 or $75 billion is really six of one and half dozen of another, almost. As we used to say on the trading desk at Morgan Stanley, just take the difference out of my next paycheck. It is a win-win, which I had expected.
The one certainty today was that the Fed would make a decision. Now that it?s out of the way, stocks can only go up.
Market?s reacted as if there had been no taper at all. Stocks and the dollar rocketed, led by financials, technology, health care, and industrials. Softbank gapped up and is approaching a new high for the year. Bonds, gold, volatility, and the yen collapsed. My model trading portfolio is almost a perfect reflection of what you should be doing with your money.
Big Ben?s incredibly dovish talk we received during the press conference that followed was fantastic news for risk assets everywhere. It means that interest rates will remain lower for longer than most expected. ?Highly accommodative money monetary policy remains appropriate? is still ringing in my ears. This will remain the case until unemployment falls ?well below 6.5%? and inflation returns to 2%. ?The Fed balance sheet will continue to expand.?
What all this does is deliver a ?goldilocks? scenario for the foreseeable future. The potential disasters for January, a Fed taper and a Washington shut down have suddenly gone missing.
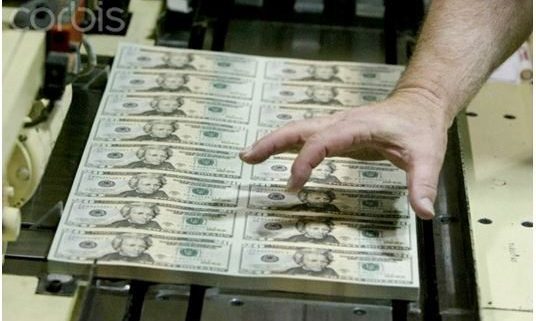
Ben?s Christmas present to us all is a printing press to print money in the markets for the next three months.
That?s Ben! That?s Just What I Wanted!
https://www.madhedgefundtrader.com/wp-content/uploads/2013/12/Money-Printing.jpg339536Mad Hedge Fund Traderhttps://madhedgefundtrader.com/wp-content/uploads/2019/05/cropped-mad-hedge-logo-transparent-192x192_f9578834168ba24df3eb53916a12c882.pngMad Hedge Fund Trader2013-12-19 01:05:242013-12-19 01:05:24I was Wrong...But it Didn?t Matter
This is my 14th consecutive closing Trade Alert, and the 20th including my remaining profitable open positions. I have only six more to go until a break my previous record of 25. It doesn?t get any better than this.
The yen is now in free fall, and the Japanese stock market is going ballistic, as I expected. Both the ProShares Ultra Short Yen double short ETF (YCS) and the Wisdom Tree Japan Hedged Equity ETF (DXJ) have pierced new five-month highs, and loftier levels beckon.
The immediate trigger was a meeting at the Bank of Japan, where the governors voted to maintain their ultra low, 0.1% discount rate. They also reiterated their commitment to growing the money supply by a blistering $600-$700 billion a year, or nearly triple the US monetary easing rate on a per capita GDP basis.
On the same day, we received month old Fed minutes showing a definite lean towards tapering our own quantitative easing. When this eventually does happen, the interest rate differential for dollar/ yen will rise dramatically. Needless to say, this is all terrible news for Japan?s beleaguered currency, as interest rate differentials are the primary drivers of foreign exchange markets.
Given all this, I am going to take profits on my existing short position in the yen through the Currency Shares Japanese Yen Trust (FXY) December, 2013 $101-$104 in-the-money bear put spread. At this mornings shockingly high prices for the spread, we can harvest 83% of the potential profit with one full month still to run to the December 20 expiration.
The outlook for the yen is no so bleak that I want to have plenty of cash to reload on the short side during the slightest recovery. I will move to closer strikes and more distant maturities to maximize your profits. It is now looking like we will soon challenge the 2013 low for the (FXY) of $94.80 and the $72 high for the (YCS).
https://www.madhedgefundtrader.com/wp-content/uploads/2013/11/Woman-Hari-Kari.jpg280396Mad Hedge Fund Traderhttps://madhedgefundtrader.com/wp-content/uploads/2019/05/cropped-mad-hedge-logo-transparent-192x192_f9578834168ba24df3eb53916a12c882.pngMad Hedge Fund Trader2013-11-26 01:03:122013-11-26 01:03:12Taking Profits on the Yen?.Again!
Exactly 84 years ago from yesterday, the Great 1929 stock market crash occurred. The Dow Average plunged a stunning 30 points to 230, a one-day decline of 12%. The ticker tape lagged the market by two hours, and the newly bankrupt were jumping out of downtown windows. I remember it like it was yesterday.
Well not really.
But a number of friends over the decades lived through that fateful day, and relived it for me, men like Sir John Templeton and Tubby Burnham. My grandfather prided himself on never buying a stock in his life, and was deluged by entreaties from reckless and freshly busted relatives to move into his Bay Ridge, Brooklyn basement.
The S&P 500 came just eight points short of my 2013 target of 1,780 yesterday. By the time you read this, it may already be there.
When I made this prediction in January, abuse was hurled upon me. Clearly, the sequester, debt ceiling crisis, taper, sluggish economic growth, a China crash, and a government shutdown were going to collapse the market, taking the (SPX) as low as 300. Gold was the safe place to be, I was told. The only way I could conclude that stocks were headed northward was if I was smoking one of California?s largest agricultural products.
It turns out they were right, but only if you hold your charts upside down.
So it was with some amusement that I listened to the comments of Dr. Jeremy Siegel of the Wharton School of Business. He has been one of the most unremittingly bullish commentators all year, to the point of becoming a Wall Street laughing stock. There is only one catch: he has been dead right. And when people are that right, I sit up and take notice.
Dr. Siegel?s view on the economy mirrors my own. The absence of further spending cuts and tax increases should enable US GDP growth to spring from 2% to 3.5%. At that robust rate the Federal Reserve could completely eliminate quantitative easing with no serious market impact. All surprises will be to the upside. Only a ten year Treasury yield falling to 2% would signal that this scenario has run off the rails.
The Federal Reserve will keep interest rates ultra low for longer than most expect because of its mortal fear of deflation. Endemic and structurally falling prices have the effect of increasing the real debts of individuals and corporations. The central bank clearly wants debt loads to move in the other direction.
While major entitlement reform poses some risk, the likelihood is that the committee convened to make recommendations will simply kick the can down the road, well past the 2014-midterm elections. That?s because both parties believe they can then gain the upper hand. Only one of them can be right.
Dr. Siegel observes that November and December have the calendar working for them as historically positive months. There will be an extra tailwind coming from highly favorable Q4 YOY earnings comparisons. Dividends are up a healthy 10%-15% YOY, and will continue to improve. This action should spill into the first half of 2014.
There is no doubt that the taper has been delayed. In fact, there are no major uncertainties of any kind until well into next year. Periodically, premature fears of tightening will trigger market setbacks. But they will be of the smaller kind, typically 4%-7%.
Welcome to the Goldilocks market.
The only development that could bring this parade to an end would be a second and more prolonged government shutdown, possibly as early as January. But the Republicans have been severely chastised for their behavior in the opinion polls, so it is highly unlikely we will see a repeat, unless we are about to become a one party state.
Welcome to the Goldilocks market.
Welcome to the Goldilocks Market
https://www.madhedgefundtrader.com/wp-content/uploads/2013/10/Goldilocks.jpg348156Mad Hedge Fund Traderhttps://madhedgefundtrader.com/wp-content/uploads/2019/05/cropped-mad-hedge-logo-transparent-192x192_f9578834168ba24df3eb53916a12c882.pngMad Hedge Fund Trader2013-10-30 08:53:582013-10-30 08:53:58When Great Minds Think Alike
I was not surprised to see the belated September nonfarm payroll come in at a miserable 148,000. It clearly shows that companies were already hunkering down with their overheads in the run-up to the recent DC slugfest. The figure had been delayed by the Washington shutdown, which froze all government data releases.
In fact, the job market is weaker than even this number suggests because it includes the one time only addition of hundreds of thousands of part time teachers who went back to work for the new school year.
I think that this will be only the first of many data releases showing that the economy completely fell off a cliff in October. I have received emails from readers all over the country supplying a treasure trove of anecdotal evidence of how bad conditions got. It sounds like business came to a complete standstill in the metro Washington DC area.
If November comes and we suddenly get a whole raft of bad October numbers at once, the talking heads who drive the short term market will go into a tizzy. They?ll predict that the bull market is over, that we are going into a long awaited recession, and that it is time to dump all your stocks. A forecast of ?Dow 3,000? will once again show its ugly face. The net net of all this will likely be a 4.7% or 8% correction in the S&P 500 of the sort I discussed yesterday.
Take the gift.
That?s when you want to jump in with both feet. Because, after the politically induced October hiccup, the economy will roar once again.
The outlook for 2014 is looking mighty damn fine. For the first time in many years, we will be looking at a global synchronized recovery, with the US, Europe, China, and Japan all delivering multi year highs in GDP growth at once. The fiscal drag emanating from falling government spending will be the lowest in years. Corporate profits everywhere will soar.
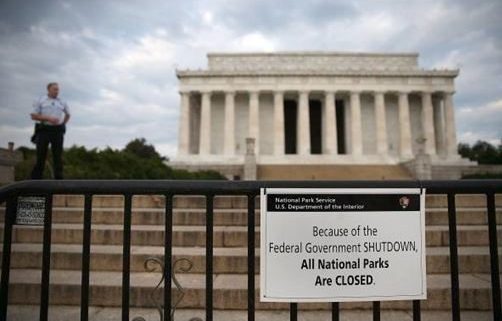
The taper, the reduction of the Federal Reserve?s $85 billion a month in bond buying, is now not slated to start until June. It may not happen at all in 2014 if the jobless rate falls insufficiently and the ruckus in Washington continues. The Fed has clearly concluded that in order to prevent the US from falling back into recession it must continue to pump money into the economy as long as the gridlock lasts.
All of this is a magic formula for higher stock prices. Many of the spectacular gains in share prices we are seeing this year are in fact a front run of next year?s best case scenario. But there will still be more to run. My guess is that we could tack on another 10% to 15% from current levels in the New Year. That takes the (SPX) as high as 2,100.
So buy the next dip with reckless abandon. And write a letter to your congressmen thanking him for being such an ?hole and creating a great entry point in this melting up bull market.
https://www.madhedgefundtrader.com/wp-content/uploads/2013/10/White-House-in-Decay.jpg239569Mad Hedge Fund Traderhttps://madhedgefundtrader.com/wp-content/uploads/2019/05/cropped-mad-hedge-logo-transparent-192x192_f9578834168ba24df3eb53916a12c882.pngMad Hedge Fund Trader2013-10-23 01:05:262013-10-23 01:05:26The Worst is yet to Come
I am completing one of the best trading years of my 45-year career in the stock market. The Trade Alert service is up by a stunning 41.5% so far in 2013 and by 96.55% since inception 35 months ago.
Pretty much every forecast I made for the year came true (click here for ?My 2013 Annual Asset Class Review?). The question now is: ?What to do here??? How do I beat the performance of the ages?
It seems that the world has come around to my point of view on virtually every asset class. Stocks are soaring, lead by the sectors I suggested, technology, industrials, health care, and consumer cyclicals. Since I wrote ?Apple is About to Explode? the shares have been up nine consecutive trading days, and are now 36% above its June lows.
Commodities have, at last, begun their long crawl off the bottom, with copper producer Freeport McMoRan (FCX) massively outperforming the market since August. Gold, silver, and the agricultural commodities have been dead in the water, as expected. Bonds are going nowhere. Oil is falling, as it should. It took a poison gas attack to squeeze me out of my short position there, (thanks a lot Bashar!).
The Washington shutdown came to a big nothing, and translated into ?BUY,? as I expected. Of course, the data flow is going to be gobbledygook for the rest of the year, as different parts of the economy shut down, restart, and then report at different rates. Only privately sourced information, like corporate earnings and the endless torrent of real estate numbers, will be reliable. You can bet that the Federal Reserve is watching these numbers more than usual too.
It looks like we lost about a fifth of our economic growth for the year, while achieving absolutely nothing. For this, the Republicans will have hell to pay next year. More on that later.
There is only one problem with this scenario. When the world agrees with me, I get nervous. Much of my money is made betting against the consensus, not agreeing with it. I am getting run over by bulls on stocks catching up with me from behind. As a result, I have sold out of all of my positions and let my remaining options positions expire well in-the-money. For the first time in years, I am 100% cash. What a bizarre feeling.
Any experienced, seasoned trader will tell you that the best thing to do now is nothing. Maintain your discipline and don?t chase. Buying something that is up ten days in a row is idiotic. Leave that behavior to the wanabees, newbies, and dummies. Just wait for an extreme move in something, anything, and then go the other way.
Let?s take a look at corrections in the S&P 500 this year, which have been few and far between. It has been a market where once you got out, it has really been hard to get back in. Someone else always came by to take your seat. Here were those rare points:
May - 8%
July - 4.7%
September - 4.6%
The primordial, lizard brained trader will look at this chart and come to the same conclusion, regardless of its ticker symbol. They?ll buy once on a 4.6% dip, double up on an 8% dip, and place a stop loss order not far below there.
If the market continues to run away to the upside, then just sit back and watch it. If you already have a monster year, and you should if you have been following the advice of this letter, that?s fine. Let your friends pick up the tab for the next dinner.
Some of the indicators I follow are starting to shout about a top. Individual margin debt is at an all time high. And my buddy, Henry Blodget, of Business Insider sent me the chart below. It shows the funds held in Rydex money market funds, one of the best contrarian indicators out there.
Peaks in assets held by this very low risk family of funds are highly coincident with stock market bottoms, the last two of which were found in November, 2012 and July, 2013. The markets roared after that. Bottoms of assets held in the Rydex funds very roughly coincide with stock market tops, although they may take months to play out. This presages a selloff in risk assets that could start at anytime.
Sometimes, discretion is the better part of valor.
Hey, Save My Place, Will You?
https://www.madhedgefundtrader.com/wp-content/uploads/2013/10/Airplane-Seat.jpg440330Mad Hedge Fund Traderhttps://madhedgefundtrader.com/wp-content/uploads/2019/05/cropped-mad-hedge-logo-transparent-192x192_f9578834168ba24df3eb53916a12c882.pngMad Hedge Fund Trader2013-10-22 09:02:352013-10-22 09:02:35What to Do Now?
By now, you have figured out that I executed a major ?derisking? of my model trading portfolio today, cutting my exposure by two thirds. Most of these positions only had a few basis points in maximum profit left, so bailing here was a no brainer, a case of ?Basic Risk Control 101.? Better to laugh about the market in a few days or weeks, than cry. My profits this year are so huge that they are well worth defending.
There is an eerie silence going on in the markets now. All real news has ceased. The government data releases that dictate the short-term direction of prices have come to a complete halt, thanks to the government shutdown. The rest of the news is all political, which is to say that it is useless. When markets are driven by opinions instead of facts and data, you want to run a mile.
I recently spoke to some Tea Party activists, and the extent to which they hate President Obama is frightening. They would happily subject the country to another Great Depression if it meant they could be rid of the community activist from Chicago for good.
The debt ceiling crisis gives them the means to do exactly that. Therefore, I believe that the current impasse in Washington will last longer than the market expects. What the Tea Party doesn?t understand is that once you shatter confidence, it is very hard to get it back.
As a result, my friends in the high frequency trading community tell me that the risk of a flash crash is rising. All you need is for the wrong comment at the wrong technical point in the charts on the wrong day and a deluge of cascading selling could result. That day could be October 17.
This is clearly a minority view, but it is not impossible. Take a look at how the momentum names, like Netflix (NFLX) and Herbalife (HLF) are getting hammered today and you?ll see what I mean. This was further confirmed by the volatility index (VIX) breaking through $20 today, up more than 50% from a month ago.
So I?ll let valor be the better part of judgment here and move from a serious ?RISK ON? trading book, to one that is more clearly market neutral. That demands I cash in my winnings in short positions in the Japanese yen (FXY), and my long in Apple (AAPL).
As for my long in the Japanese stock market (DXJ), I?ll have to settle for a stop out with a moderate loss. It?s not the first time that I have lost money in Japan, nor certainly the last. This was the ?Bridge Too Far? among my trades this year.
I still am sticking with my medium term bull case, which sees us moving to new highs by yearend. But we could see one big final flush before we turnaround. That?s when I want to jump in wit both hands and go fully invested once again. To best profit from such a scenario, you have to go into the next dump with the most cash possible. Today?s action gets us close to that point.
https://www.madhedgefundtrader.com/wp-content/uploads/2013/10/Fed-Govt-Closed.jpg335502Mad Hedge Fund Traderhttps://madhedgefundtrader.com/wp-content/uploads/2019/05/cropped-mad-hedge-logo-transparent-192x192_f9578834168ba24df3eb53916a12c882.pngMad Hedge Fund Trader2013-10-09 01:04:352013-10-09 01:04:35Cutting Back My Risk
Treasury Secretary, Jack Lew, is warning us that the government will run out of money on Monday. Maybe, by rearranging the deck chairs on the Titanic, he can continue crucial payments, like Social Security and veterans benefits, through October 16. After that, we are officially broke. Bills for what the government has already spent will go unpaid. Welcome to the deadbeat nation.
How have the Republicans responded? By having a senator read Dr. Seuss?s Green Eggs and Ham, a popular children?s book, into the Congressional Record. With news like this, you?d think stocks and other risk assets would be well on their way to zero. Investors have every reason to despair.
Except that they?re not.
Too many traders have seen this movie before. The markets don?t believe it for a second. The 10 year Treasury yield, the specific securities we are about to default on, are actually rising in price in the run up to this disaster, with yields falling a stunning 40 basis points in two weeks. Stocks continue to maintain incredibly lofty heights, a mere 2.4% down from their all time highs.
When the public pronouncements of politicians and the markets contradict each other, I?ll go with the markets every time. Washington has cried wolf once too often.
In the wake of the last debt ceiling crisis two years ago, stocks cratered by a gut churning 25% in two months. Then ensued one of the greatest bull runs of all time, with the S&P 500 (SPY) rising an amazing 640 points, or 60%.
In fact, selling short President Obama has proven highly expensive. Those who bailed in the aftermath of his two election wins missed out on enormous upside stock gains. Traders have since learned the new language of Washington DC: government shutdown means ?BUY.?
The Democrats know that time is on their side and are astutely playing their hand accordingly. They know that the last time the Republicans chained the entrance to the Statue of Liberty they took a big hit in the following midterm elections. So, an offer of a repeat performance is being welcomed by the left with open arms.
The Democrats also know that they are winning the demographics battle. Ever year they pick up 3 million new voters through no effort of their own. Some 2 million young voters turn 21 every year, and 80% of these vote Democratic, when they show up. Another 1 million newly naturalized legal immigrants join the voter rolls, 90% of them back Obama, and they all show up, since citizenship is such a hard fought prize.
That means Democrats will gain some substantial percentage of 12 million votes nationally by 2016. This explains why so many conservatives were honestly shocked by the 2012 Romney loss, fueling the Internet with endless conspiracy theories. Their party was using four-year-old voter data.
If Romney had run in 2008, he would have won. And who have they got to run against Hillary Clinton in the next election, who is leading in the polls with a 60% margin among Republican women?
I?m afraid that if the Republicans continue their current behavior, they will go the route of the Whig Party, which faded into history in 1856. This would be a sad thing, as I support the two party system.
So many across the political spectrum see the Tea Party antics as a giant waste of time, and disrespectful of our democracy. While the Democratic Party is moving towards the middle, the Republicans are moving further to the right.
The most egregious shenanigans in the House and the Senate committed by Republicans are all about proving ideological purity, so they can win primaries against even more conservative contenders, who then blow national elections. The final legacy of the Tea Party may well be that they delivered a Senate to the Democrats when it should have been Republican.
The movement towards an effective one party state would come with considerable costs. The flood of deregulation unleashed by Ronald Reagan in the early 1980?s is still paying huge dividends. I much prefer paying $500 than $4,000 for a trip to Tokyo for my kids. I like no longer having to deal with only AT&T to make my long distance calls, which are now mostly free. They used to cost a fortune. Having 1,000 channels to watch on TV certainly gives me more choices than the original three.
Too bad the deregulators didn?t quit when they were ahead. Only eight years after the repeal of the Glass-Steagall Act eliminated barriers between broking and investment banking, every major financial institution in the US was de facto bankrupt. They are still crawling out of the hole, thanks to a massive government bailout.
I?m sure by now I have lost half of my subscribers, the right leaning half, so I?ll move on before I lose the rest.
What?s the bottom line on all of this? The theatrics in Washington are presenting a mere speed bump in one of the greatest bull markets of all time. The move in the main stock indices is just about to become the fourth largest upward on the books, as it is on the verge of surpassing the tremendous 1942-1946 bull run.
Imagine that! The outlook for public listed companies in the US is now so outrageously positive that it is having a greater impact on share prices than winning WWII! Wow, and double wow! For more reasons why we are in the midst of the greatest bull market of out lifetimes, please click the titles to read ?Why US Stocks Are Dirt Cheap? and ?My 2013 Stock Market Outlook?.
So use the 3%-7% dip we get this time around to scale into your favorite long positions one more time. That is the only entry point the market has permitted since November. We may have to wait all the way until April, 2014 to find a better entry point than that.
That?s what I?m doing.
Shorting Obama Has Proved Expensive
https://www.madhedgefundtrader.com/wp-content/uploads/2013/09/Obama.jpg427341Mad Hedge Fund Traderhttps://madhedgefundtrader.com/wp-content/uploads/2019/05/cropped-mad-hedge-logo-transparent-192x192_f9578834168ba24df3eb53916a12c882.pngMad Hedge Fund Trader2013-09-26 09:04:012013-09-26 09:04:01The Government That Cried Wolf
It?s time to put on your buying boots and throw caution to the wind. The S&P 500 (SPY) is likely to rebound as much as 9% from the recent 1,630 low to as high as 1,780 by the end of December. What?s more, stocks could add another 10%-20% in 2014. The nimble and the aggressive here will be rewarded handsomely. Those who keep their hands in their pockets will sadly watch the train leave the station without them, and shortly be exploring career options on Craigslist.
The move will be driven by the double-barreled improvement in valuation parameters, rising earnings and expanding earnings multiples. S&P 500 earnings are likely to come in this year around $107, modestly above the New Year forecasts. An improving economy could take that number as high as $117 next year.
This is encouraging underweight investors to pay up for stocks for the first time in a very long time. Today?s (SPX) 1,660 print gives you a 15.5 multiple. Boost that to 16.5 times, and the 1,780 number is served up to you like a Christmas turkey on as silver platter. Maintain that multiple, and the (SPX) grinds up to 1,930 by the end of 2014. With earning multiples smack dab in the middle of an historic 9-22 range, this is not an outrageous expectation. This is known in trading parlance as a ?win-win,? and creates a positive hockey stick effect on your P&L.
Of course, there are still many non-believers out there. Reveal yourself as a bull in the wrong quarters, and a torrent of abuse piles upon you. The taper, Syria, the debt ceiling crisis, and another sequester will demolish the economy and send stocks tumbling. There are plenty of Dow 3,000 forecasts out there. Thank you Dr. Doom.
Here?s the wakeup call: you are reading about these risks in this newsletter, and thousands more out there. None of these risks have the ability to surprise the market, as they have been so belabored by the media. They will most likely be solved fairly quickly. Everyone is planning on using these events as a buying opportunity. They are fully priced in. That?s why stocks have failed to pull back more than 7.4% since November, when the Obama reelection shock pared 10% off share prices.
What will be the short-term triggers for the next leg up? I?ll round up the most likely suspects for you.
1) Ben Bernanke?s taper of the largest quantitative easing program in history will either come in smaller than expected, or won?t show up at all. Concerns over weak jobs progress, flaccid economic growth, Syria, zero inflation, and the debt ceiling have cut the knees out from more substantial action. Here?s some quickie math. A $10 billion a month taper leave $75 billion a month on net federal bond buying in place for at least another quarter.
2) Bonds have been falling since April, taking interest rates up. Once the taper is announced, they will rally and limit moves to a new, higher 2.50%-3% range on the ten-year Treasury (TLT).
3) Syria will go away pretty soon, peacefully or otherwise. Despite the humanitarian disaster, nobody here really cares what happens on the other side of the world.
4) The debt ceiling crisis will generate headlines and sound bites for a few weeks, and then get resolved or end with a second sequester. This year?s sequester proved highly stock market positive, as it sent the government?s budget deficit plunging at the fastest rate in history, with the first serious cuts in military spending since the end of the cold war.
5) The economic data flow from Europe is modestly improving. Crises are becoming fewer and farther between.
6) The already great data from Japan is coming in even hotter than expected.
All of this makes US equities the world?s most attractive asset class. For a listing of longer term positive factors which few in the market currently appreciate, please read my early piece (?Why US Stocks Are Dirt Cheap? by clicking here).
This is not your father?s bull market. While interest rates have been moving up at the long end, they are still half of what they were at this point in past market cycles. Five years of balance sheet repair since the financial crisis mean that corporations are carrying only half the debt and leverage seen at previous market peaks.
There will also be no new tax increases for the foreseeable future. The fiscal drag on the economy, which knocked 1% off GDP growth this year, is diminishing rapidly. Remove the dead weight, and US growth could rebound to 3.5% next year.
Dividend yields are far higher, with nearly half of the S&P 500 still yielding more than the 10-year Treasury bond. Investment in stocks, particularly large caps, is safer now than it has been at any time since the Great Depression.
Another big bullish factor could be president Obama?s decision regarding Ben Bernanke?s replacement as chairman of the Federal Reserve. Naming co-chairperson, the ultra dovish Janet Yellen, could add another 20% to the (SPX), with investor expectations of ?QE forever? taking earnings multiples even higher. If mildly hawkish Larry Summers gets the nod, it might chop 10% off the index.
Which sectors will take the lead? Technology is still the area that the world wants to own. Profits are rising faster than in the main market, and they boast large amounts of cash. Look no further than Apple?s (AAPL) $150 billion wad, a third of its total capitalization. It is selling the bottom end of its historical multiple range and at a market discount. I?m not just talking Apple (AAPL), the behemoth that could make it up to $600 next year. Cloud and mobile plays will also be highly sought after.
For those with more pedestrian tastes, you can?t go wrong with plain vanilla industrials and cyclicals, which will continue to appreciate off the back of a stronger economy. Even financials should do well, given an assist from a steepening yield curve, their traditional bread and butter.
What could pee on this parade? Washington, what else? If the government shuts down and stays closed, this could give you your long awaited 10% correction, or more. The last time they threatened this, stocks gave up 25% in just two months. Will this happen? I doubt it. But no one ever went broke underestimating stupidity in our nation?s capitol.
Caveat emptor!
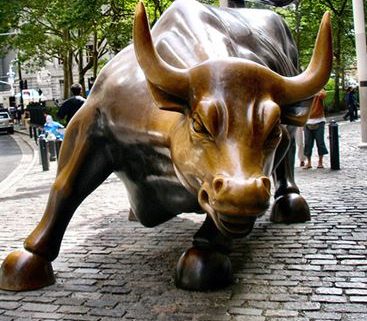
Higher Prices Beckon
https://www.madhedgefundtrader.com/wp-content/uploads/2013/09/Wall-Street-Bull.jpg439367Mad Hedge Fund Traderhttps://madhedgefundtrader.com/wp-content/uploads/2019/05/cropped-mad-hedge-logo-transparent-192x192_f9578834168ba24df3eb53916a12c882.pngMad Hedge Fund Trader2013-09-11 08:01:352013-09-11 08:01:35My 2013 Stock Market Outlook
There?s nothing like coming home and getting slapped in the face with a fresh mackerel the second I step off the plane. That?s what happens when you travel from a continent that is universally positive about US stocks, to one that is largely negative.
Take a look at the chart below from my friends at Bespoke Research, showing that 66% of all investors are now bearish on stocks over the next 30 days, nearly a two year high. That takes us out to mid September, when Ben Bernanke gives us his decision on whether to start tapering and pare back quantitative easing, or not. I don?t think he will do it, but the majority of the market thinks he will.
The economic data do not justify it. Strip out the weekly noise and focus on the longer-term averages, and the picture becomes more clear. During the second half of 2012, monthly job gains averaged 180,000. In the first half of 2013 the number bumped up to 202,000. That is an improvement, but is far shy of the 400,000 in monthly gains seen at this point in past economic cycles.
You also have to consider Bernanke?s inordinate fear of doing a 1937 repeat, when the country fell into the second leg of the Great Depression due to premature easing. That means he will continue to err on the side of over stimulation. Add all this up, and you get no taper in September, December, or even in early 2014. When markets figure this out, they will rocket to new highs.
So why are stocks so weak now? Blame it on the summer doldrums, which is why I spent the last two months sunning my self in Europe. Watching the market action today, it is clear that the ?B? teams are still in charge on the trading desks. Write it off to the fact that the market has gone up for nine months straight and is begging for a rest. It is nothing more than that.
My bet is that we are in for another standard correction. So far, we have breached the 50-day moving average at 1,658, off 3.3% from the recent highs. The largest decline this year has been the 7.3% we saw in May. A 9.5% dump takes us down to 1,552, bang on the 200-day moving average. That?s where you load the boat on the long side for a yearend run to new highs.
Sorry for the delays in my recent posts. As soon as I got home, the hard drive on my iMac promptly blew up. This, no doubt, is thanks to the porters who dropped my luggage at the last 20 hotels I checked into. So I have been working from my six year old backup Windows PC, which I have largely forgotten to use.
What?s that delete button for? And where?s the damn finder?
Welcome Home!
https://www.madhedgefundtrader.com/wp-content/uploads/2013/08/Fight-Fish.jpg257530Mad Hedge Fund Traderhttps://madhedgefundtrader.com/wp-content/uploads/2019/05/cropped-mad-hedge-logo-transparent-192x192_f9578834168ba24df3eb53916a12c882.pngMad Hedge Fund Trader2013-08-21 09:08:412013-08-21 09:08:41Why You should Buy This Dip
I often get asked why I never put out ?BUY? recommendations on consumer discretionary stocks. I promptly send them in search of the latest consumer spending figures at the Bureau of Economic Analysis, which do not paint a pretty picture (click following link ?http://www.bea.gov/newsreleases/national/pi/pinewsrelease.htm).
Since 2008, quarterly spending has come in at a scant 0.5%, the lowest figures since the Great Depression. You can blame deleveraging by the individual. While the government is telling us to spend more to stimulate the economy, we are in fact doing the opposite to put away more cash for a rainy day. They are also taking out an insurance policy against a future financial crash, which could come as early as next year.
You can find this in consumer debt, which saw a zenith of 130% of disposable income as recently as 2007. Today we are back down to 115%, possibly on our way to 70%, the 1970-2000 average. This is also reflected in the savings rate, which has risen from 1.2% in 2005 to 4.9% today, and may hit the long-term average of 8%.
If anything, these numbers are about to worsen dramatically as 80 million baby boomers retire. The over 65 crowd is not exactly known for the big spending, low saving ways, excluding myself.
I always tell people that being a former scientist and math major, I am a numbers guy. Just cut the BS, the spin, the apple and orange comparisons, and the ?independently? financed research, and give me the damn numbers. I can reach my own conclusions, even if you don?t like them.
The figures above are a major part of my own long term forecast for US GDP growth rate of 2.0%-2.5%. Decimating the middle class by shipping 25 million jobs to China assures decades long decline of standards of living. Should you expect anything more? Walmart (WMT) says that it now has a major problem in that its low-end customers are literally running out of money. This is not good for the industries specialized in this area.
Those looking for fodder that the US is coming down with the ?Japan Syndrome? and the two decades of lost economic growth this entails will find fertile ground here. US consumer spending still accounts for 70% of GDP growth. In Japan, it peaked in the late eighties at 20%. So the loss of the consumer will be far more damaging here than it is in the country that is suffering its third decade of flat economic performance.
In stock market terms, this means we may get a little more upside by the end of the year, possibly 70 points in the (SPX), but not much more. Off to a raging bull market we are not. The nimble may be able to profit from this, but for most it will be a snore.
Wake Me Up When the Consumer Returns
https://www.madhedgefundtrader.com/wp-content/uploads/2013/08/Sleep-at-Computer.jpg312467Mad Hedge Fund Traderhttps://madhedgefundtrader.com/wp-content/uploads/2019/05/cropped-mad-hedge-logo-transparent-192x192_f9578834168ba24df3eb53916a12c882.pngMad Hedge Fund Trader2013-08-15 01:03:552013-08-15 01:03:55The Death of the Consumer
Legal Disclaimer
There is a very high degree of risk involved in trading. Past results are not indicative of future returns. MadHedgeFundTrader.com and all individuals affiliated with this site assume no responsibilities for your trading and investment results. The indicators, strategies, columns, articles and all other features are for educational purposes only and should not be construed as investment advice. Information for futures trading observations are obtained from sources believed to be reliable, but we do not warrant its completeness or accuracy, or warrant any results from the use of the information. Your use of the trading observations is entirely at your own risk and it is your sole responsibility to evaluate the accuracy, completeness and usefulness of the information. You must assess the risk of any trade with your broker and make your own independent decisions regarding any securities mentioned herein. Affiliates of MadHedgeFundTrader.com may have a position or effect transactions in the securities described herein (or options thereon) and/or otherwise employ trading strategies that may be consistent or inconsistent with the provided strategies.