
The Terrifying Chart Formation That is Setting Up
The Mad Hedge Fund Trader is seeing its biggest one-day gains since the inception of our Trade Alert Service 11 years ago. By the time you read this, we will have picked up an astounding 11% profit for the entire portfolio in 24 hours.
However, this being Halloween, I don’t want to sound like I’m whistling by the graveyard. But what I am about to say will scare the daylights out of you.
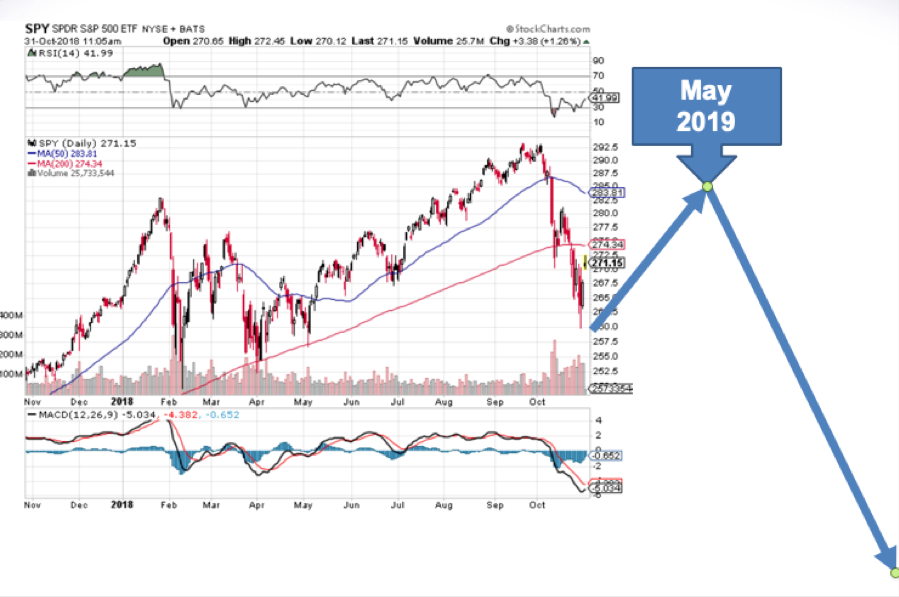
I hate to say I told you so but my prediction a year ago that the bull market would end on May 10, 2019 at 4:00 PM is starting to look pretty good.
If I am right, the charts for the S&P 500 (SPY) are setting up a classic head and shoulders top. The left shoulder was created by the January 2018 rally to $282.
We just saw the head created at the beginning of October at $293. All that remains is to build the right shoulder back up to $282 by the spring. What will then follow is the crying.
This is not a matter of throwing a dart at a calendar or reciting a chant taught to me by a long-dead Yaqui Indian. It is a simple matter of math. Here’s how it goes:
*The Fed Raises funds rate 25 basis points per quarter for the next four quarters to 3.25%
*The Yields Curve Inverts, taking short rates higher than long rates now at 3.15%
*Bond yield spread trades increase massively going into the inversion as traders ramp up the size to make up for shrinking spreads.
*When the spread turns negative, they dump everything, creating an interest rate spike to 4% or 5%.
*Inverted yield curves last an average of 14 months or until February 2020 in this cycle when a recession begins.
*Stock markets peak on average seven months before recessions, and you arrive at Friday, May 10, 2019 at 4:00 PM EST as the date for the demise of the bull market. At that point, it will be ten years and two months old, the longest such move in history.
A lot of people asked why I sent out so few trade alerts during the summer and going into the fall.
In fact, the list of negatives has reached laughable proportions:
*Longest bull market in history
*In the face of rising interest rates
*In the face of rising oil prices
*Rising inflation
*Nothing else to buy
*Only bull market in the world
*Valuations approaching two-decade highs
*Overwhelmingly concentration in big cap tech
*Double top in the market on an Equal Weight S&P 500 chart
*Record retail inflows into ETFs
*Recession has already started in the auto industry
*Recession has already started in the housing industry
*Rotation to value defensive stocks underway
*Massive unicorn IPOs planned in 2019- $215 billion
*Slowing GDP Growth 4.2% to 3.5%
*Large amount of economic growth sucked forward from 2019 as businesses accelerate Chinese imports to beat the tariffs
*The same is going on in China to buy our exports
Should you throw up your hands, dump all your stocks, and hide out in cash?
Absolute not! In fact, the last six months of a bull market are often the most profitable. Many tech stocks like Micron Technology (MU) and Advanced Micro Devices (AMD) have dropped by half in recent months. That means they have to double to get back to their old highs.
Other big quality stocks such as Amazon (AMZN) and Netflix (NFLX) have plunged by 30% and only have to appreciate by 43% to hit highs. It is, in fact, the best entry point for large-cap tech stocks since 2015 with valuations at a three-year low.
If I am wrong, the trade war with China plunges us into recession and ends the bull market sooner. Almost all the “worry” items on the list above are getting worse by the day.
Save That Date!