• support@madhedgefundtrader.com
  • Member Login
Mad Hedge Fund Trader
  • Home
  • About
  • Store
  • Luncheons
  • Testimonials
  • Contact Us
  • Click to open the search input field Click to open the search input field Search
  • Menu Menu
Mad Hedge Fund Trader

February 28, 2011 - My Take on the Euro

Diary

Featured Trades: (MY TAKE ON THE EURO), (FXE), (SPY)


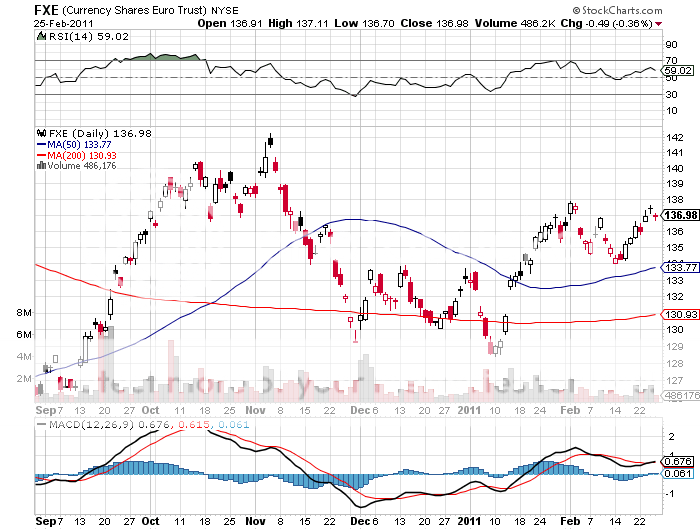
1) My Take on the Euro. Entering 2011 as the currency that everyone loved to hate, the Euro has staged a dramatic comeback, much to the chagrin of hedge fund managers and traders alike. Since January, the troubled currency has rallied ten cents from $1.28 to $1.38. Is this the beginning of something big? Or has it shot its wad and headed for a spill?

I vote for the later. The euro is essentially winning the best deck chair on the Titanic contest, the fastest horse at the glue factory, and the prettiest girl at the ugly ball. It's really all about interest rate differentials. At the end of last year, the US economy was growing gangbusters, while Europe was in intensive care. That sent medium and long term American interest rates skyward, while those in Europe languished.

Now the tables have turned. High oil prices are starting to act as a drag on the US, causing economists to rapidly pare back forecasts. Treasury bonds have come back from the dead, bringing the yield on the ten year from 4.70% down to 4.4%. In the meantime, European Central Bank officials have been jawboning the Euro up, threatening interest rate hikes to deal with imagined inflation, no matter that such a policy would be insane to pursue. Hence, we are seeing Euro strength and dollar weakness.

There is another wrinkle to the Euro story here. You would think that high oil prices would be Euro negative, as the continent is a massive importer from that troubled part of the world. But what do Arabs do with the dollars they get for this oil? They buy Euros in order to keep their reserves in a diversified spread. That is why the lurch in crude to $112 in Europe was accompanied by the Euro move to $1.38. This is why the traditional flight to safety bid for the dollar failed to show this time, as it has in all previous oil crises. Some of this spill over buying also explains why the Japanese yen has recently been strong, holding on to the ?81 handle, despite its dismal fundamentals.

How does this party end? US stocks rally once again, US bonds tank, and oil takes a rest, falling well back into the nineties. That could then take the Euro back down to the bottom of its ten dent trading range. A put on the Euro has become a de facto call on US stocks. That's when we test the lower end of the European currency's recent trading range.
-

-

This Party Will Not End Well for the Euro

https://madhedgefundtrader.com/wp-content/uploads/2019/05/cropped-mad-hedge-logo-transparent-192x192_f9578834168ba24df3eb53916a12c882.png 0 0 Mad Hedge Fund Trader https://madhedgefundtrader.com/wp-content/uploads/2019/05/cropped-mad-hedge-logo-transparent-192x192_f9578834168ba24df3eb53916a12c882.png Mad Hedge Fund Trader2011-02-28 02:00:022011-02-28 02:00:02February 28, 2011 - My Take on the Euro
Mad Hedge Fund Trader

February 28, 2011 - Goldcorp Coins it in the Gold Trade

Diary

Featured Trades: (GOLDCORP COINS IT IN THE GOLD TRADE)


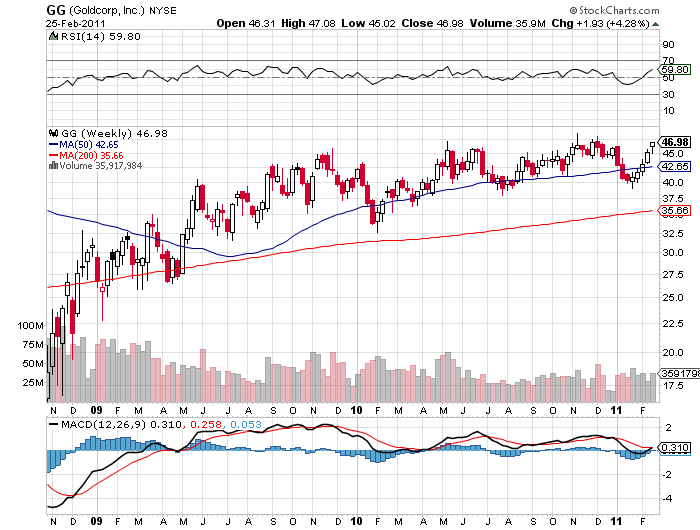
3) Goldcorp Coins it in the Gold Trade. I managed to touch base with Canadian miner Goldcorp's CEO, Charles Jeannes, who's stock I have been shamelessly pushing for the last three years (click here). When I last spoke to him two and a half years ago, back when the yellow metal was trading at $950, he made the then outrageous claim that gold would soon break $1,050 to make an all-time high.

Some $450 later, and you never saw a happier man. The company has been aggressively cutting costs, making acquisitions, and disposing of non core assets. This will lead to a production increase of 60% to 4 million ounces a year over the next five years.? Goldcorp is currently extracting the barbarous relic in Canada, the Dominican Republic, Guatemala, Mexico, Argentina, and the US. Both physical and investment demand are soaring. This will continue, as all the gold and gold backed instruments in the world only add up to 1% of global financial assets.

Goldcorp's average cost is $274/ounce, giving it elephantine profit margins that enabled it to bring in a net $791 million in profits last year. Costs are growing at 6% a year, well below the 15% industry average. The company just doubled its dividend. Talk about a license to print money.

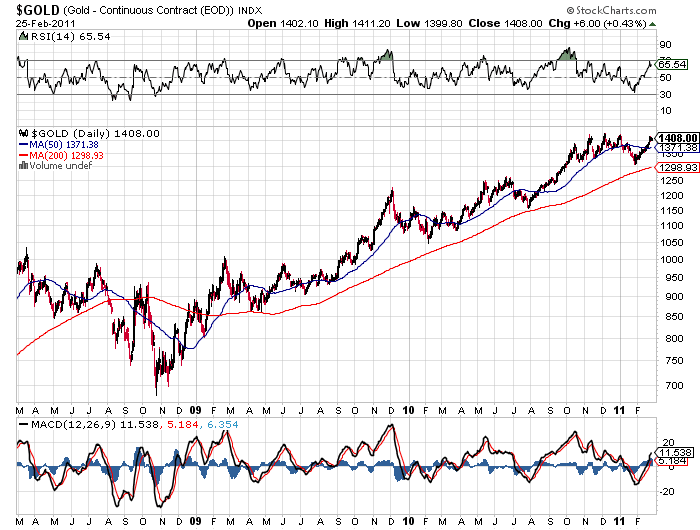
I have been a huge bull on gold since I put out my call to buy it more than three years ago at $800. While I continue to believe that we will steadily appreciate in coming years to the old inflation adjusted high of $2,300, I also think the glory days are behind us. We'll probably only see single digit, or small double digit annual returns getting us there. My only trading play this year was on the short side, which proved immediately profitable. That is on par with high yield junk bonds or distressed muni bonds, but nothing like last year's blistering 28% appreciation.

-

-

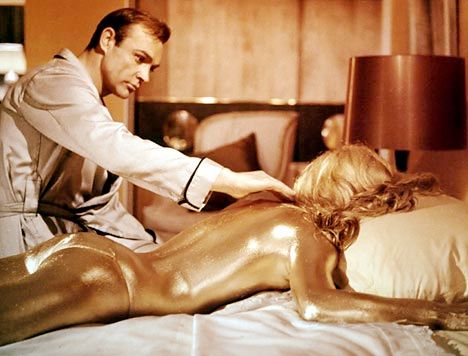
No Need to Massage the Profits Here


https://madhedgefundtrader.com/wp-content/uploads/2019/05/cropped-mad-hedge-logo-transparent-192x192_f9578834168ba24df3eb53916a12c882.png 0 0 Mad Hedge Fund Trader https://madhedgefundtrader.com/wp-content/uploads/2019/05/cropped-mad-hedge-logo-transparent-192x192_f9578834168ba24df3eb53916a12c882.png Mad Hedge Fund Trader2011-02-28 01:40:192011-02-28 01:40:19February 28, 2011 - Goldcorp Coins it in the Gold Trade
Mad Hedge Fund Trader

February 25, 2011 - My Victory Lap on Oil

Diary

(SPECIAL $100 OIL ISSUE)

Featured Trades: (MY VICTORY LAP ON OIL)


2) My Victory Lap on Oil. One of the boldest predictions that I made in my January 6 asset class forecast for 2011 was that oil would soon hit $100/barrel (click here for the link). My precise words were 'Probably $30 of the current $90 price reflects monetary demand, on top of $60 worth of actual demand from consumers. That will help it grind to $100 sometime in early 2010, and we could spike as high as $120.'

OK, I got the 'grind' part wrong. As it turns out, we have rocketed $18 in a week to a high of $103.40. Brent is up $28 this year. When I made this prediction,? I received tanker fulls of abuse, citing the glut of crude in storage at Cushing, Oklahoma, a slow US economic growth rate, a full strategic petroleum reserve, rapidly progressing conservation measures, and the threat posed by a newly discovered domestic 100 year supply of natural gas. In any case, alternative green energy sources will soon be replacing oil.

Well, there is only two days' worth of supply at Cushing, and they're full because the Canadian tar sands companies have been bringing new supplies on stream. The economy grew at a 4% rate, rather than the 2% many thought. Natural gas is nice, but it will take ten years of infrastructure building and deregulation before it starts to compete with oil. I can assure you that not a drop of SPR is coming on to the market. And alternatives are not going to be making a dent in our energy mix any time soon.

What is my just reward for this call? With gasoline well on its way to $5/gallon, my all-electric Nissan Leaf is looking pretty good, even if delivery has now been pushed back to May.

-

-

https://madhedgefundtrader.com/wp-content/uploads/2019/05/cropped-mad-hedge-logo-transparent-192x192_f9578834168ba24df3eb53916a12c882.png 0 0 Mad Hedge Fund Trader https://madhedgefundtrader.com/wp-content/uploads/2019/05/cropped-mad-hedge-logo-transparent-192x192_f9578834168ba24df3eb53916a12c882.png Mad Hedge Fund Trader2011-02-25 01:50:482011-02-25 01:50:48February 25, 2011 - My Victory Lap on Oil
Mad Hedge Fund Trader

February 24, 2011 - The True Cost of High Oil

Diary

Featured Trades: (THE TRUE COST OF HIGH OIL), (OIL), (USO)


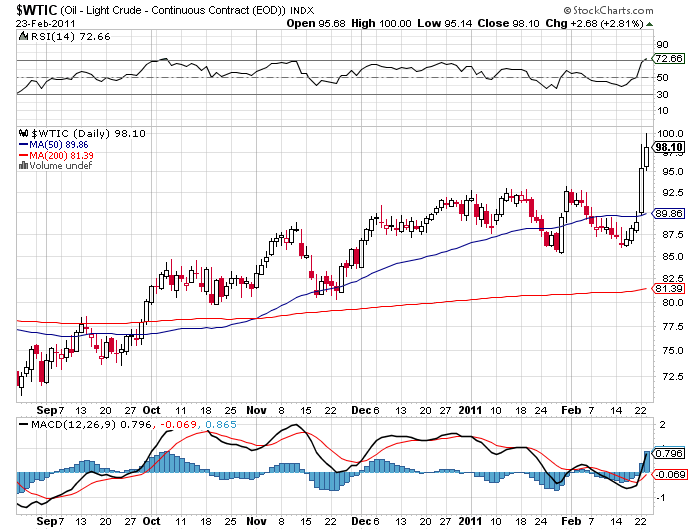
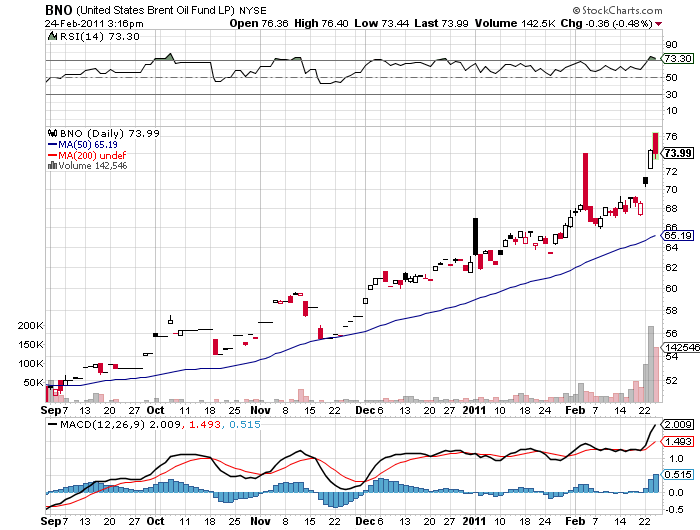
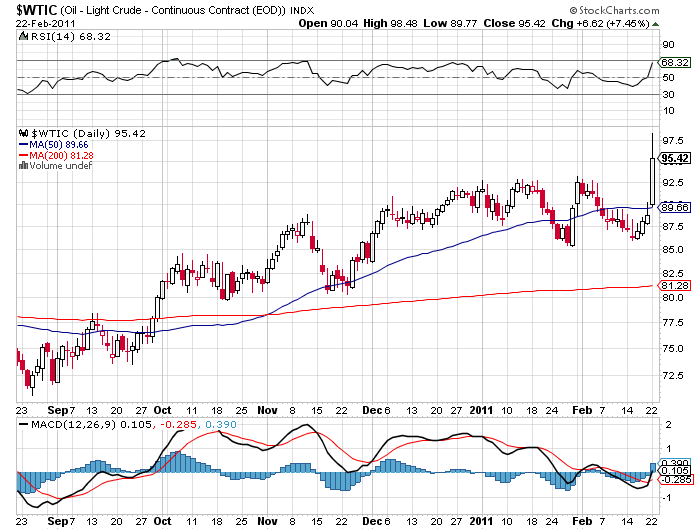
1) The True Cost of High Oil. Economists are furiously downsizing their economic growth forecasts for 2011 in the wake of the oil price spike, both for the US and for the world at large. Since last week, West Texas crude prices have soared $12 from $86 to $98. Each $1 increase in the price of oil jumps gasoline prices by 2.5 cents. Each one cent rise in the cost of gasoline takes $1 billion out of the pockets of consumers.

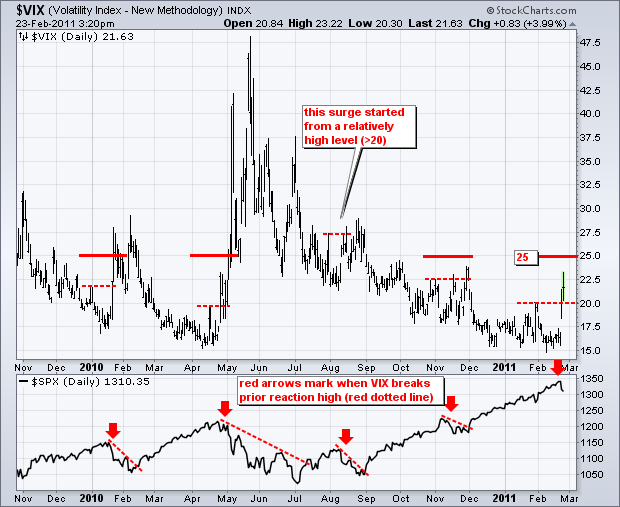
If oil stays at this price, it removes $30 billion from the pockets of consumers. At $110/barrel, it short changes them by $60 billion, or? 41% of GDP. If you wonder why hedge fund managers have lurched into an aggressive '?RISK OFF' mode, are throwing their babies out with the bathwater, and why the volatility index is spiking to three month highs, this is why.

-

-

-

https://madhedgefundtrader.com/wp-content/uploads/2019/05/cropped-mad-hedge-logo-transparent-192x192_f9578834168ba24df3eb53916a12c882.png 0 0 Mad Hedge Fund Trader https://madhedgefundtrader.com/wp-content/uploads/2019/05/cropped-mad-hedge-logo-transparent-192x192_f9578834168ba24df3eb53916a12c882.png Mad Hedge Fund Trader2011-02-24 02:00:002011-02-24 02:00:00February 24, 2011 - The True Cost of High Oil
Mad Hedge Fund Trader

February 24, 2011 - How Far Will the Market Fall?

Diary

Featured Trades: (HOW FAR WILL THE MARKETS FALL?), (VIX), (SPX), (SPY)


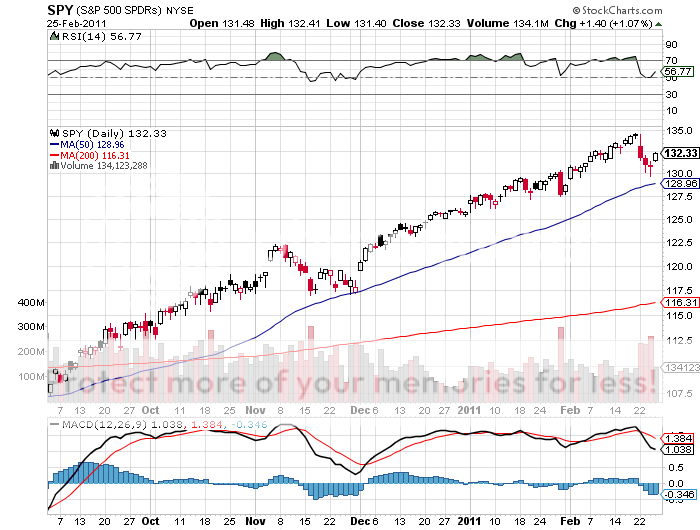
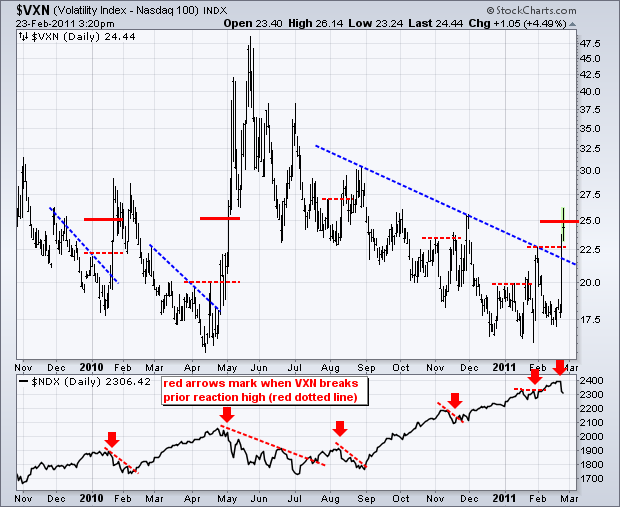
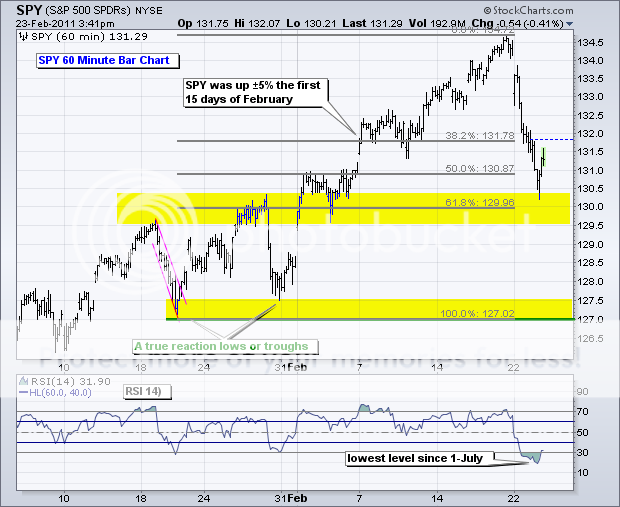
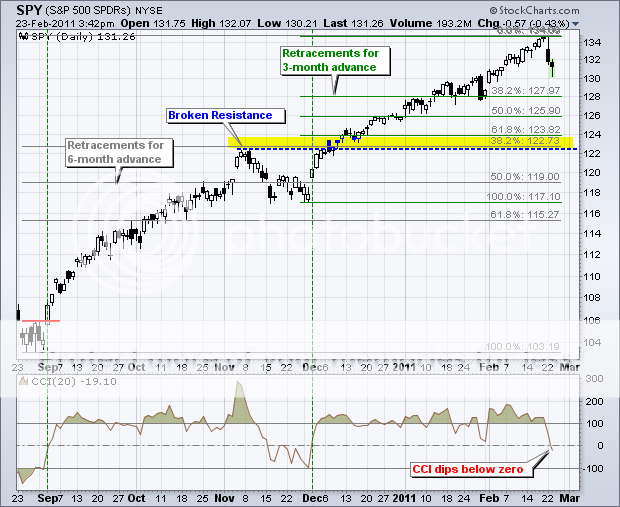
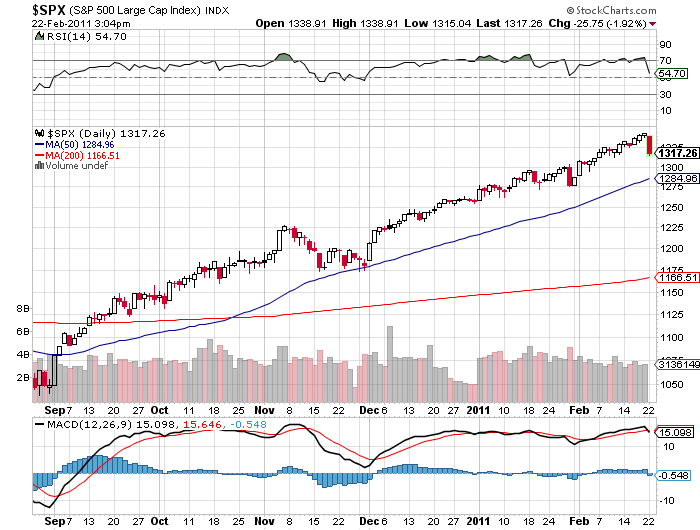
2) How Far Will the Market Fall? Now that we are solidly in 'RISK OFF' mode, traders, managers, and investors are asking how much downside we are looking at. It is safe to say that those who were piling on longs with reckless abandon are now potentially staring into the depths of a great chasm. I have included charts below showing the important Fibonacci support levels. Let's take a look at how far down is down.

*1,300 '? The first big figure. Already broken intraday, but it held the first time.

*1,286 '? The 50 day moving average, the no brainer, most bullish target. The 'buy the dip' crowd takes a first bite here.

*1,280 '? 38.2% Fibonacci support level.

*1,260 '? 50% Fibonacci support level.

*1,230 '? Broken resistance from the November high. Europe blows up again. Take your pick: Spain, Ireland, Britain, Portugal'?

*1,167 '? The 200 day moving average. It must hold for the bull market to stay intact. This is where $5/gallon takes us. Double dip recession talk reemerges. The 'buy the dip' crowd takes a second bite.

*1,117 '? The November low. The 'buy the dip' crowd throws up on its shoes and pukes out the last two 'buys'. We spike down, triggering another 'flash crash.'

*1,000 '? The next really big figure. Ben Bernanke, with the greatest reluctance, announces QE3. Bond prices soar, taking ten year yields to 2%. Homes prices collapse again, triggering a secondary banking crisis.

*666 '? The Saudi regime falls, and 12 million barrels a day disappears from the market for the indefinite future. Unemployment hits 15%. Obama is toast. Your broker turns bearish and tells you to sell everything. Welcome to the Great Depression II. It starts raining frogs.

-

-

But Will He Bounce?

https://madhedgefundtrader.com/wp-content/uploads/2019/05/cropped-mad-hedge-logo-transparent-192x192_f9578834168ba24df3eb53916a12c882.png 0 0 Mad Hedge Fund Trader https://madhedgefundtrader.com/wp-content/uploads/2019/05/cropped-mad-hedge-logo-transparent-192x192_f9578834168ba24df3eb53916a12c882.png Mad Hedge Fund Trader2011-02-24 01:50:112011-02-24 01:50:11February 24, 2011 - How Far Will the Market Fall?
Mad Hedge Fund Trader

February 23, 2011 - The S&P 500 is Cruising for a Bruising

Diary

Featured Trades: (S&P 500 IS CRUISING FOR A BRUISING)


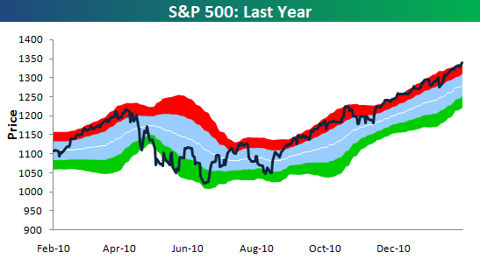
2) The S&P 500 is Cruising for a Bruising.? How overbought is the stock market? My friends at the Bespoke Investment Group produced this chart of the S&P 500 showing that it has remained in nosebleed territory for nearly six months now, except for a few fleeting months in November. This is why many hedge fund managers have been tearing their hair out, become addicted to Maalox, or are contemplating going into the restaurant business, especially if they have been playing from the short side for the past six months. It has been such a straight line move that it hasn't allowed many traders in.

The light blue area in the chart represents one standard deviation above or below the 50 day moving average, which yesterday was at 1,284.? The red area shows where the market is more than one standard deviation above the average, while the green is more than one standard deviation below. Not only that, each individual sector in the (SPX) is overbought, with consumer discretionary, materials, and energy the most overbought.

Just to reach the nearest oversold area, the market has to drop to 1,240, down 100 points, or 7.5% from last night's close. Just thought you'd like to know.

-

-

https://madhedgefundtrader.com/wp-content/uploads/2019/05/cropped-mad-hedge-logo-transparent-192x192_f9578834168ba24df3eb53916a12c882.png 0 0 Mad Hedge Fund Trader https://madhedgefundtrader.com/wp-content/uploads/2019/05/cropped-mad-hedge-logo-transparent-192x192_f9578834168ba24df3eb53916a12c882.png Mad Hedge Fund Trader2011-02-23 01:50:592011-02-23 01:50:59February 23, 2011 - The S&P 500 is Cruising for a Bruising
Mad Hedge Fund Trader

February 23, 2011 - A Buying Opportunity is Setting Up for the Ags

Diary

Featured Trades: (BUY THE DIP IN THE AGS), (DBA), (CORN), (MOS), (POT), (AGU), (ANDE), (CPO)


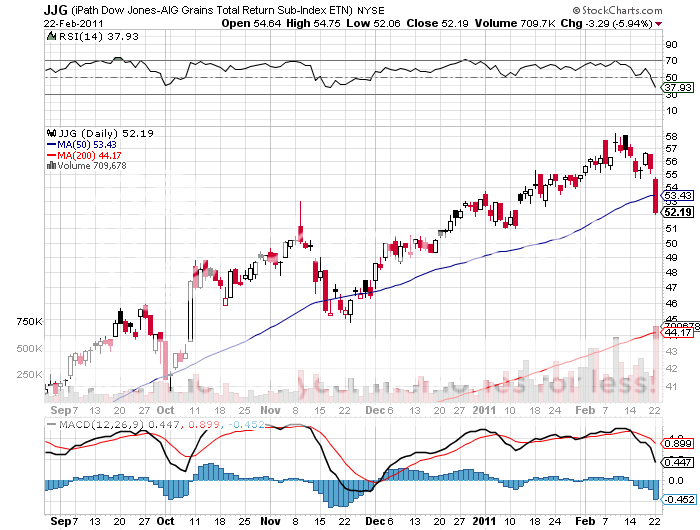
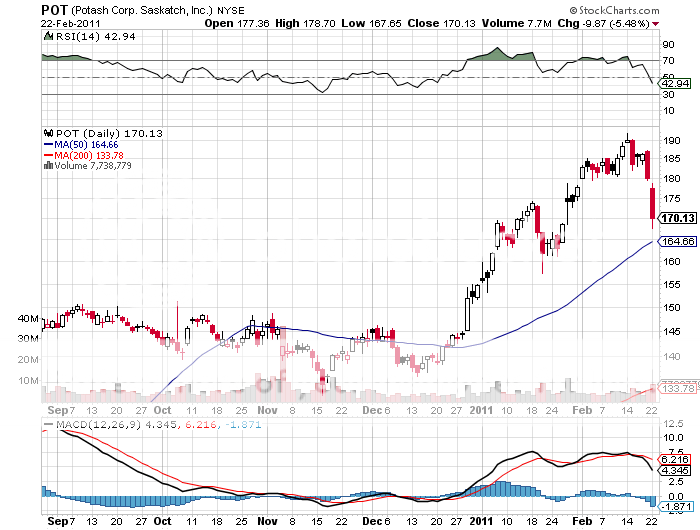
3) A Buying Opportunity is Setting Up for the Ags. In January, I wimped out of my hefty long position in the grain ETF (JJG), hoping to sidestep a potential sell off going into a dreaded US Department of Agriculture crop report, which last year triggered limit down moves. The report turned out to be benign, and I ended up sidestepping an 18% pop in the security.

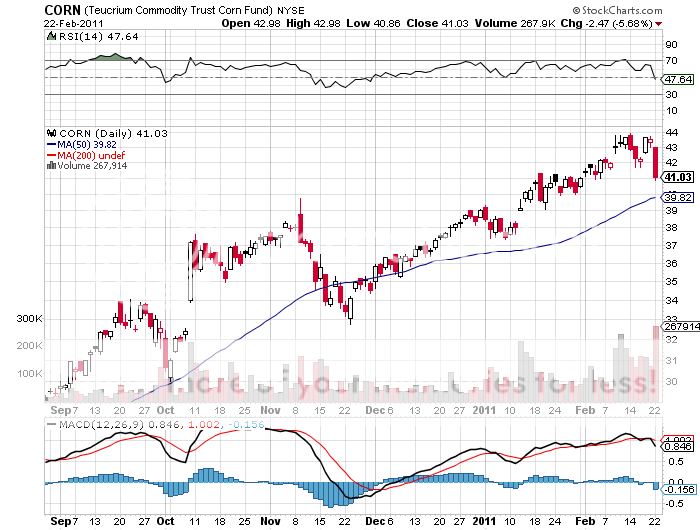
It is now six weeks later, and we have our limit down moves across the entire ag space. But this time it is a global '?RISK OFF' trade triggered by the calamitous events in Libya. I just received word that a close friend working there for an oil major was safely airlifted to Malta, while another reader emails me that Khadafi is dynamiting pipelines to prevent them falling into the hands of rebels. A declaration of 'force majeure' does little to calm investors. Given that the ags have been among the best performers this year, it only makes sense that a flight to safety delivers to them the worst drubbing.

If you are still holding your position in this space, don't sweat too many bullets. This is but a kink in an upward trajectory that has possibly another two years to run. The world is still making people faster than the food to feed them. Almost every major supplier around the world is facing disruption. Supplies are at multi decade lows. A hungrier, more calorie addicted middle class is still burgeoning in emerging markets. Did I mention the threat to the food supply by global warming and melting glaciers? Food driven inflation isn't going away anytime soon.

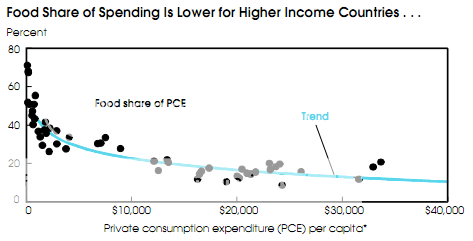
If you have any doubts, take a look at the chart below of the percentage of annual income spent on food by country. It starts with a low of 7% for Americans, and goes hyperbolic to 75% for several African countries. When you already spend 75% of your income on food, the only way to cope with a further 50% price increase is to eat less. Not easy when you are surviving on 1,000 calories a day. Expect higher prices, political instability, hoarding, and mass suffering to result.

I have been a huge bull on the ag space since I put out my watershed piece last June, a call that turned out to be immensely profitable for everyone who participated (click here for 'Going Back Into the Ags'). Use the current distress to add to your ag positions, or pick them up if you have not already done so. Look at my favorites in the space the ag ETF (DBA), the corn ETF (CORN), and equities Mosaic (MOS), Potash (POT), and Agrium (AGU). When I see a short term bottom, I'll try to shoot out a trade alert, if I am clever enough to spot it.

You might also add a couple of new names, like Andersons, Inc.? (ANDE), which is involved in crop storage and fertilizer. Also visit and Corn Products International (CPO), which is benefiting from consumer flight from record high sugar prices towards cheaper high fructose corn syrup.

-

-

-

-

Here's Where I Want to Buy the Dip


https://madhedgefundtrader.com/wp-content/uploads/2019/05/cropped-mad-hedge-logo-transparent-192x192_f9578834168ba24df3eb53916a12c882.png 0 0 Mad Hedge Fund Trader https://madhedgefundtrader.com/wp-content/uploads/2019/05/cropped-mad-hedge-logo-transparent-192x192_f9578834168ba24df3eb53916a12c882.png Mad Hedge Fund Trader2011-02-23 01:40:442011-02-23 01:40:44February 23, 2011 - A Buying Opportunity is Setting Up for the Ags
Mad Hedge Fund Trader

February 23, 2011- Quote of the Day

Diary

'Right now, the US is the best looking horse in the glue factory,' said Erskine Bowles, co-chair of the National Commission on Fiscal Responsibility and Reform

https://madhedgefundtrader.com/wp-content/uploads/2019/05/cropped-mad-hedge-logo-transparent-192x192_f9578834168ba24df3eb53916a12c882.png 0 0 Mad Hedge Fund Trader https://madhedgefundtrader.com/wp-content/uploads/2019/05/cropped-mad-hedge-logo-transparent-192x192_f9578834168ba24df3eb53916a12c882.png Mad Hedge Fund Trader2011-02-23 01:00:552011-02-23 01:00:55February 23, 2011- Quote of the Day
Mad Hedge Fund Trader

February 21, 2011 - Reflections on Morgan Stanley's 75th Anniversary

Diary

Featured Trades: (MORGAN STANLEY), (MS)


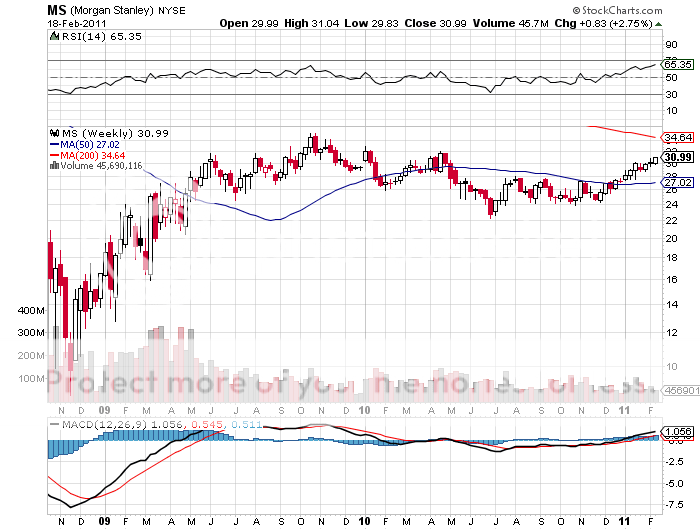
1) Reflections on Morgan Stanley's 75th Anniversary. The three elder statesmen I saw on TV ringing the opening bell at the NYSE couldn't have been more representative of the evolution of Morgan Stanley (MS) over the past three quarters of a century. When I joined just after the 35th anniversary, it was a small, white shoe private partnership with a lock on the cream of investment banking clients like IBM, AT & T, and General Motors.

A great nephew of the original JP Morgan still worked there, was his spitting image, and was trotted out to impress admiring clients. Neatly framed on the wall in the chairman's office was US Steel (X) share certificate No.1, signed by Andrew Carnegie himself, which the firm's antecedents midwifed into existence. One of the first deals I worked on was the breaking up of Ma Bell into the baby bells.

Parker Gilbert was chairman, the son of one of a handful of men who rebuilt the firm from the wreckage of the Great Crash and the passage of the Glass Steagle Act. I knew him well as one of the blue bloods who ran the firm, a genteel, polished, Ivy Leaguer, who exuded fine breeding and confidence. I once spent an afternoon with him in the back of a Daimler limousine driving around London, shopping for thousands of dollars' worth of high end fishing gear, so he could accept an invitation to a Scottish private estate perfectly appointed. If Parker hadn't landed the top job at MS, he probably would have been running another exclusive gentleman's club, like the Jockey Club or the New York Yacht Club.

John Mack was one of a new generation of brash, street fighting, in your face, bare knuckled traders who forced the firm, kicking and screaming all the way, to make a fortune in proprietary trading. Mack, known internally as 'Mack the Knife', was of Lebanese origin, and could not have been more at odds with Morgan Stanley's elitist origins. He once lured a star trader away from Solomon Brothers, and then fired him on the first day. The few female employees we had then cried in his mercurial presence. But there is no doubt that the profits Mack reeled in saved the firm from a takeover down the road, rescuing it from the fate of Solomon Brothers, Kidder Peabody, Dillon Read, and Drexel Burnham, assuring its place in the big league today.

I was one of the few who bridged the two generations, comfortable from my journalism days with moving in Olympian circles, but coming from humble, rural origins. We took the 1987 crash in stride, but during the dark days of the financial crisis, when the share price plunged below $6, it seemed the firm was out for the count. Mack saved the firm a second time, successfully demanding a huge equity infusion from the Mitsubishi Group in Japan (great move, John!), while simultaneously holding at bay the wolves from Wall Street and Washington. What better year to have a junkyard dog as CEO than 2008?

James Gorman joined well after I left, and appears to be a modern day 'suit'. A professional and talented manager to be sure, but lacking the flash, the panache, and the balls of earlier generations. He is symbolic of the class of professional administrators who have been brought on board to run what has essentially become a gigantic utility.

I have seen MS grow from 1,000 to 60,000 employees. The dividend today is more than the total market capitalization of the company back then. Parker summed it up all nicely when he said his 'mind was blown' by the present size of the firm and how far it has gone. I have no doubt Morgan Stanley will be around for another 75 years. And if you believe in the continued existence of Wall Street, as I do, as I do, this would be a great stock to own for your grandkids' 529 educational investment plans.

-

https://madhedgefundtrader.com/wp-content/uploads/2019/05/cropped-mad-hedge-logo-transparent-192x192_f9578834168ba24df3eb53916a12c882.png 0 0 Mad Hedge Fund Trader https://madhedgefundtrader.com/wp-content/uploads/2019/05/cropped-mad-hedge-logo-transparent-192x192_f9578834168ba24df3eb53916a12c882.png Mad Hedge Fund Trader2011-02-21 02:00:032011-02-21 02:00:03February 21, 2011 - Reflections on Morgan Stanley's 75th Anniversary
Mad Hedge Fund Trader

February 21, 2011 - Learning to Love Hedge Funds

Diary

Featured Trades: (LEARNING TO LOVE HEDGE FUNDS)


3) Learning to Love Hedge Funds. The Wall Street Journal has put together the best history of hedge funds I have found so far. They start with the legendary Fortune Magazine editor, Winslow Jones, who created the first fund out of a shabby office on Broadway in 1948, and generated monster returns over the next 20 years. I learned for the first time that the industry standard 20% performance bonus was borrowed from ancient Phoenician sea captains who kept a fifth of the profits from successful voyages. Jones must have had an historical bent.

They cover the second generation titans, George Soros, Julian Robertson, and Michael Steinhardt, who made their debut in the sixties. I count myself among the third generation along with Paul Tudor Jones and Louis Bacon, who launched funds in the late eighties, when there were still fewer than 200 funds and $25 million was still considered a lot of money. The really big money showed up in the nineties when the pension funds found them.

The Journal then navigates us through the big crisis that followed, including Long Term Capital, Amaranth, and Lehman Brothers. It also correctly points out that the industry's avoidance of ratings agencies kept most funds out of hot water during the financial crisis. Today there are over 10,000 hedge funds, thought to manage some $2.9 trillion which dominate all financial markets. To read the well researched article in full, please click here.

Hedge Funds Do Have Their Advantages

https://madhedgefundtrader.com/wp-content/uploads/2019/05/cropped-mad-hedge-logo-transparent-192x192_f9578834168ba24df3eb53916a12c882.png 0 0 Mad Hedge Fund Trader https://madhedgefundtrader.com/wp-content/uploads/2019/05/cropped-mad-hedge-logo-transparent-192x192_f9578834168ba24df3eb53916a12c882.png Mad Hedge Fund Trader2011-02-21 01:40:412011-02-21 01:40:41February 21, 2011 - Learning to Love Hedge Funds
Page 1 of 3123

tastytrade, Inc. (“tastytrade”) has entered into a Marketing Agreement with Mad Hedge Fund Trader (“Marketing Agent”) whereby tastytrade pays compensation to Marketing Agent to recommend tastytrade’s brokerage services. The existence of this Marketing Agreement should not be deemed as an endorsement or recommendation of Marketing Agent by tastytrade and/or any of its affiliated companies. Neither tastytrade nor any of its affiliated companies is responsible for the privacy practices of Marketing Agent or this website. tastytrade does not warrant the accuracy or content of the products or services offered by Marketing Agent or this website. Marketing Agent is independent and is not an affiliate of tastytrade. 

Legal Disclaimer

There is a very high degree of risk involved in trading. Past results are not indicative of future returns. MadHedgeFundTrader.com and all individuals affiliated with this site assume no responsibilities for your trading and investment results. The indicators, strategies, columns, articles and all other features are for educational purposes only and should not be construed as investment advice. Information for futures trading observations are obtained from sources believed to be reliable, but we do not warrant its completeness or accuracy, or warrant any results from the use of the information. Your use of the trading observations is entirely at your own risk and it is your sole responsibility to evaluate the accuracy, completeness and usefulness of the information. You must assess the risk of any trade with your broker and make your own independent decisions regarding any securities mentioned herein. Affiliates of MadHedgeFundTrader.com may have a position or effect transactions in the securities described herein (or options thereon) and/or otherwise employ trading strategies that may be consistent or inconsistent with the provided strategies.

Copyright © 2025. Mad Hedge Fund Trader. All Rights Reserved. support@madhedgefundtrader.com
  • Privacy Policy
  • Disclaimer
  • FAQ
Scroll to top