Featured Trades: (JAPAN'S RECOVERY STARTS EARLY), (EWJ)
2) Japan Recovery Starts Early. It looks like the second half of the 'V' shaped recovery of the Japanese economy, the leg up, is starting sooner than expected.
Long time readers of this letter already know that in the wake of the March tsunami that hit Japan there would be an immediate collapse of the Japanese economy, followed by a very sharp rebound (click here for? 'When to Buy Japan?').
Industrial production has now risen for three consecutive months. Mitsubishi Electric has revised up its earnings for the rest of the year. Hitachi, the worst affected of the major industrial groups with the largest presence in Northern Japan, is almost back to full operation.
Some analysts credit the rapid recovery to Japan's unique industrial organization, which encourages cooperation between competitors during times of emergency. I saw the same in the aftermath of the 1995 Kobe earthquake.
Whatever the reason, the upshot for the rest of us will be a positive impact on the global economy. When the earthquake hit, one of the worst effected was not a Japanese car manufacturer, but General Motors, which lost its supply of transmissions for the Chevy Volt and other essential components. Now, if I can only get the missing floor mats for my new Nissan Leaf!
-
Do You See My Floor Mats Anywhere in There?
https://madhedgefundtrader.com/wp-content/uploads/2019/05/cropped-mad-hedge-logo-transparent-192x192_f9578834168ba24df3eb53916a12c882.png00Mad Hedge Fund Traderhttps://madhedgefundtrader.com/wp-content/uploads/2019/05/cropped-mad-hedge-logo-transparent-192x192_f9578834168ba24df3eb53916a12c882.pngMad Hedge Fund Trader2011-08-09 01:50:062011-08-09 01:50:06August 9, 2011 - Japan Recovery Starts Early
Featured Trades: (WHY I'VE BEEN WRONG ON THE MARKET), (SPX)
3) Why I've Been Wrong About the Market.On Friday I was fairly convinced that we are close to a bottom in the market at 1,166. As I write this the next day, I am staring at the (SPX) futures ticking down to 1,114.60.
I have been following global financial markets since the late sixties, and at my current advanced age, I don't get surprised very often. But I have to tell you that the 20.4%, 235 point plunge over the last two weeks has been a shocker. It is one of the most out of the blue moves that I have every seen, like the Kennedy assassination in 1963, Japan's overnight rebalancing of 50% of the Nikkei Index in 2,000, or 9-11 in 2001.
The recent market action reminds me of the mathematics of wave action in an Oceanography class that I took long ago. Several random, independent events coming from different sources a combining to amplify each other. The end result is a selling tsunami.
Of course, the finger prints of the high frequency traders are all over this move. Their computer algorithms flick billions in capital around to take profits measured in pennies and held for microseconds, arbitraging between exchange mainframes. The wider the spreads, the more of this kind of capital gets sucked into the market, the bigger and more violent the market moves. Spreads are now at 2 ? year highs, hence the 600 point daily ranges.
I have been warning readers all year that the risk of a flash crash was high. There is a reason why the flash crashes are always to the downside. We don't see flash melt ups. After a doubling of the equity indexes since 2009, it is the only natural move from a purely mathematical point of view.
The problem for you and I is that this kind of trading renders traditional market tools useless, like fundamental technical analysis useless, at least for the short term. You might as well take your income and balance sheet analysis, McClellan oscillators, and RSI's and throw them in the garbage can.
A rogue computer doesn't care that the price earnings multiple for the S&P 500 is a bargain at 12 times, and that you should get some sort of support at appropriate Fibonacci levels. While you usually see a battle fought around a 50 and 200 day moving averages that can last days or weeks, the market this time traded like they weren't there at all.
The only protection from this is to completely bail on the market and go into cash. This is why my cash positions have been running at the 80%-90% level in recent months, versus a 150% long portfolio last November. It is also why I have not been doubling up on the downside. Better to live to fight another day than lean against the Titanic.
-
There Goes My Research
https://madhedgefundtrader.com/wp-content/uploads/2019/05/cropped-mad-hedge-logo-transparent-192x192_f9578834168ba24df3eb53916a12c882.png00Mad Hedge Fund Traderhttps://madhedgefundtrader.com/wp-content/uploads/2019/05/cropped-mad-hedge-logo-transparent-192x192_f9578834168ba24df3eb53916a12c882.pngMad Hedge Fund Trader2011-08-09 01:40:152011-08-09 01:40:15August 9, 2011 - Why I've Been Wrong About the Market
Featured Trades: (BUY THE SUNHATS WHEN IT'S RAINING), (SPX)
1) Buy the Sun Hats When It's Raining. I don't think that we are going into recession immediately. I believe that we can eke out a few more quarters of 2% ish type growth before we put in the final top of the great bull market of 2009-2012. I think a real crash of the 50% variety will be a 2012 affair, not something that is on the plate in front of us staring back.
There are two big positive developments which the lagging economic indicators have yet to see. The Ford and GM earnings told us that a serious recovery is going on in the automobile industry. Total car production of 13.5 million units for the US market is looking like a sure thing this year. Also, economic data from Japan show the second half of the 'V' type recovery is starting earlier than expected. I think that the macro statistics may begin to reflect these turnarounds from September. This is what the July nonfarm payroll told us.
If we really were in recession we would already see it in hundreds of leading indicators, from rail car loadings, to FedEx deliveries, to sea container utilization rates. But the signs are just not there. Recessions don't pop up out of the blue; they are lumbering, slow, developing behemoths, like turning supertankers.
If that is the case, then stocks are a screaming 'BUY' here after a gut churning 17 point, 12.6% plunge in the (SPY) in a mere two weeks. I think that much of the decline can be attributed to program and high frequency trading, margin calls, forced liquidation, and other Wall Street fun and games. Investors also have a bitter aftertaste from our near miss with default and the bilious negotiations that increased the debt ceiling. Everyone is trading like a repeat of the 2008 debacle is imminent, and will probably continue to do so for the next 20 years. This is what people who were in the market from 1930-50 tell me.
Notice that today the low of the S&P 500 September futures was at 1,166. This was not just some random number. It exactly corresponds to a 61.8% retracement of the entire move from August, 2011 to the April 29, 2011 top. A ton of technical buying kicks in here.
Lift their heavy hand off the market, and it should bounce back up, like holding a basketball under water. If I am wrong, then you should at least expect an oversold technical bounce back up to the (SPY) 200 day moving average at $128, and then fail. If I am right, then the market will make it up to the last high at $135, and then double top, or make a new marginal high by year end. That leaves a potential 16% to the upside, something certainly worth taking a bite out of.
So it might be worth sticking your toe in the water here and start picking up some small, limited risk positions in equities, such as through the options. That way, if it gets bitten off by a shark, at least you still have nine left.
In the Marine Corp., after you crash a plane, the first thing they do is stick you back into another one, once you have been found to have acted responsibly. If they don't, the fear takes hold, and you stay grounded for life. The same is true for trading.
-
-
It's the Second Mouse That Gets the Cheese
https://madhedgefundtrader.com/wp-content/uploads/2019/05/cropped-mad-hedge-logo-transparent-192x192_f9578834168ba24df3eb53916a12c882.png00Mad Hedge Fund Traderhttps://madhedgefundtrader.com/wp-content/uploads/2019/05/cropped-mad-hedge-logo-transparent-192x192_f9578834168ba24df3eb53916a12c882.pngMad Hedge Fund Trader2011-08-08 02:00:242011-08-08 02:00:24August 8, 2011 - Buy the Sun Hats When It's Raining
Featured Trades: (RIP FOR AMERICA'S TRIPPLE A RATING), (TLT), (TBT)
2) RIP for America's Triple A Rating. At long last, after months of warnings, leaks, hand wringing, and speculation, Standard and Poor's has at last downgraded US Treasury bonds a notch to AA+. The change was the most telegraphed ratings change in history.
You can bet this weekend saw a flurry of emergency board meetings across the country. Many institutions are only permitted to own AAA debt securities, and rules will need to be changed quickly to permit their continued residence in institutional portfolios.
I don't expect to see any major market impact, beyond a day or two. The fact is that America's financial health has been sliding down hill for the last 30 years. Standard & Poor's should have made the downgrade during 1980-82, when Ronald Reagans quadrupled the national debt, from $1 trillion to $4 trillion.
It should have downgraded Uncle Sam's debt a second time when George W. Bush doubled it again from $5 trillion to $10.5 trillion. It turns out that cutting taxes while starting two new wars is not a great budget balancing strategy. If any other country were issuing bonds with this balance sheet, I reckon they would catch a single 'A' rating at best.
I suspect that the timing of the downgrade now was more of a political than analytical decision. It's not that Standard & Poor's has any great credibility here. It totally missed the 2008 financial collapse. During the credit boom, it handed out triple 'A' ratings with reckless abandon to subprime securities that were clearly junk. To this day, I am amazed that the shoddy practices of the ratings agencies didn't get the principals sued out of existence or put in jail.
Sovereign debt downgrades from triple 'A' are not without precedent. In every case the change turned out to be a deep lagging indicator, a classic case of closing the barn door after the horses have bolted. One need look no further than Japan, whose downgrade was greeted with no more than a yawn.
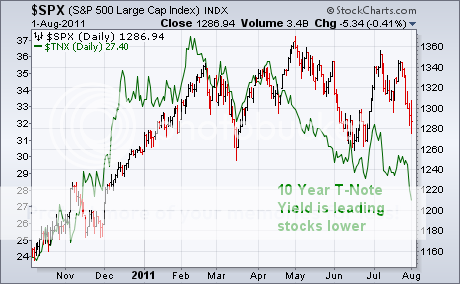
Today, the Japanese government can borrow all it wants at 1.01% for ten years, and a pitiful 1.90% for 30 years, less than half of what the US government currently pays. The true irony here is that Standard & Poor's made its move the day after ten year Treasury bond yields matched a 40 year low at 2.35%.
It may turn out that America's long heralded debt downgrade is the first boring thing that happened this month.
Present Japanese Yield Curve
Debt Downgrade? No Problem Here
-
An AA+ Rating? Really!
https://madhedgefundtrader.com/wp-content/uploads/2019/05/cropped-mad-hedge-logo-transparent-192x192_f9578834168ba24df3eb53916a12c882.png00Mad Hedge Fund Traderhttps://madhedgefundtrader.com/wp-content/uploads/2019/05/cropped-mad-hedge-logo-transparent-192x192_f9578834168ba24df3eb53916a12c882.pngMad Hedge Fund Trader2011-08-08 01:50:142011-08-08 01:50:14August 8, 2011 - RIP for America's Triple A Rating
Featured Trades: (THE JULY NONFARM PAYROLL: ROCKETING BACK UP TO ZERO)
3) The July Nonfarm Payroll: Rocketing Back Up to Zero. The monthly nonfarm payroll report finally surprised to the upside, the much watched figure coming in at +117,000, well above a consensus of +90,000. The headline unemployment rate is back down 0.1% to 9.1%. May and June saw healthy revisions up of +56,000 jobs.
Private sector hiring soared to +159,000. That was partially offset by what has become a permanent drag from government cuts of -37,000. The end of the partial shutdown of the state government in Minnesota was a big factor. The strongest sectors were in health care, +31,000, retail, + 26,000, and manufacturing, +24,000.
Some 6.2 million hapless souls have been unemployed for six months or longer.
While a definite improvement over past months, we are anything but back in the pink. To accommodate population growth and an outflow of new college graduates, the economy needs to create at least 150,000 new jobs a month. Seasonal adjustment excludes 1.2 million school teachers who are fired at the end of the school year, only to be mostly rehired in the following year.
My view is that the nonfarm payroll report has become too politicized to be of any real value. It now has a market impact of only two days at most. The US is suffering from a long term structural unemployment issue that no one can do anything about.
If corporations had more cash, such as from a tax free offshore profit repatriation, they would simply invest it in China, India, and Brazil, as they have done. If wealthy individuals had more money through a tax cut, they would just buy more gold, or keep the cash. The economic growth rate in the US is just too low to attract new investment needed to create jobs. The new customers are in emerging markets, not here.
https://madhedgefundtrader.com/wp-content/uploads/2019/05/cropped-mad-hedge-logo-transparent-192x192_f9578834168ba24df3eb53916a12c882.png00Mad Hedge Fund Traderhttps://madhedgefundtrader.com/wp-content/uploads/2019/05/cropped-mad-hedge-logo-transparent-192x192_f9578834168ba24df3eb53916a12c882.pngMad Hedge Fund Trader2011-08-08 01:40:012011-08-08 01:40:01August 8, 2011 - The July Nonfarm Payroll: Rocketing Back Up to Zero
Featured Trades: (HERE'S WHERE TO WATCH FOR THE TURN),
(GLD), (FXF), (FXY), (TLT)
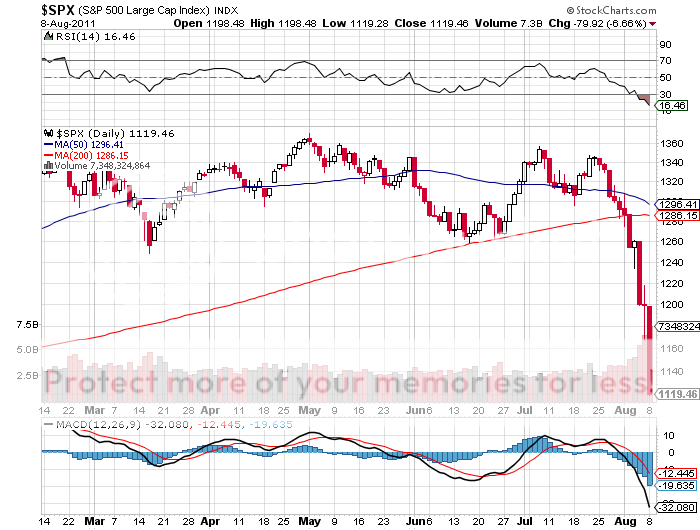
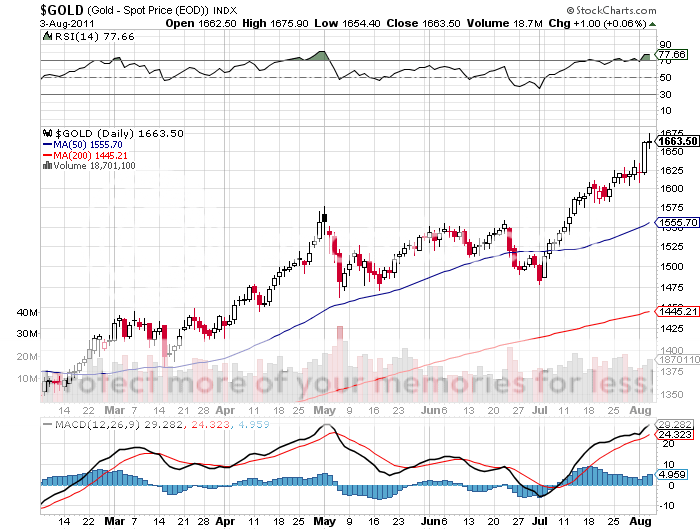
1) Here is Where to Watch for the Turn. What to say about Thursday's market? The 'RISK OFF' trade had its finest hour. The Dow average WAS down 512 points, NASDAQ (QQQ) cratered by 135 points, oil (USO) was off $6, and copper (CU) got smacked for 34 cents. Emerging markets (EEM) quickly morphed into submerging markets. Gold (GLD) provided no refuge today, dropping $45 in hours, and silver (SLV) gave back $4 in the blink of an eye.
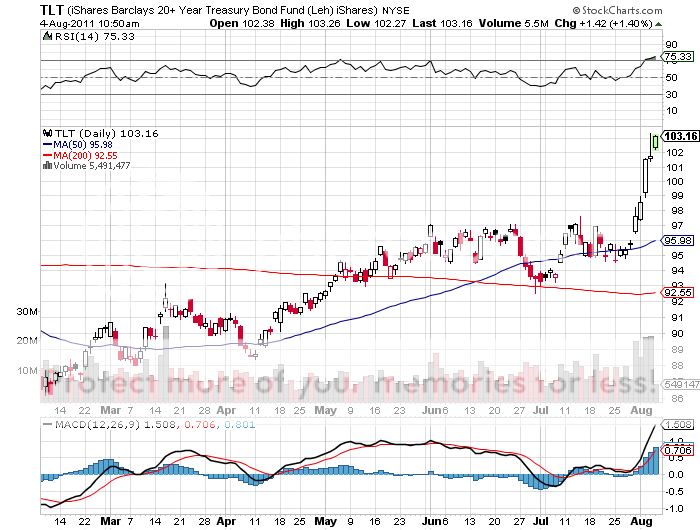
Only Treasury securities provided a safe haven, with overnight paper briefly showing negative interest rates. The yield on ten year Treasury bonds plummeted to 2.42%, nearly matching its 30 year low set last year.
Global contagion was back on the table, with credit default swaps for France blasting through to all-time highs. The European Central Bank's folly of raising interest rates in the face of a weak economy is now bearing its bitter fruit.
The confirmation of the 'head and shoulders' formation on the charts has triggered a an entire new round of selling by technically driven programs, clearly putting the 1,160 target on the downside in play. Margin clerks on Wall Street and the futures markets in Chicago were having a field day.
US stocks have lost $1.3 trillion in market cap in two weeks. This is on the coattails of the government sucking $2.4 trillion out of the global economy in the debt ceiling compromise. Gee, do you think there is a connection?
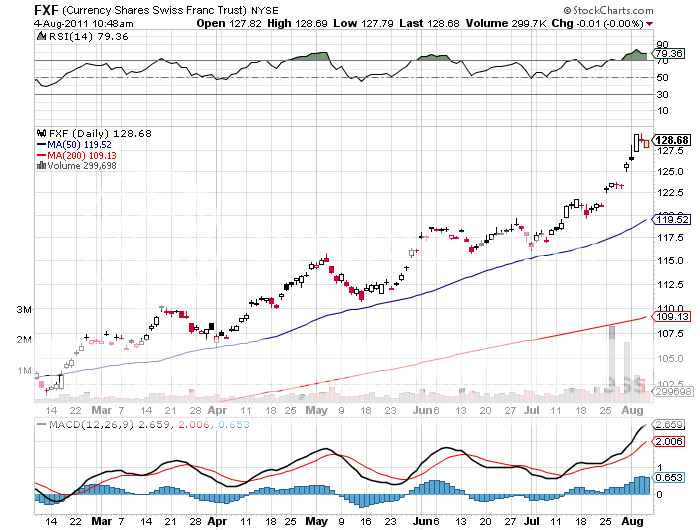
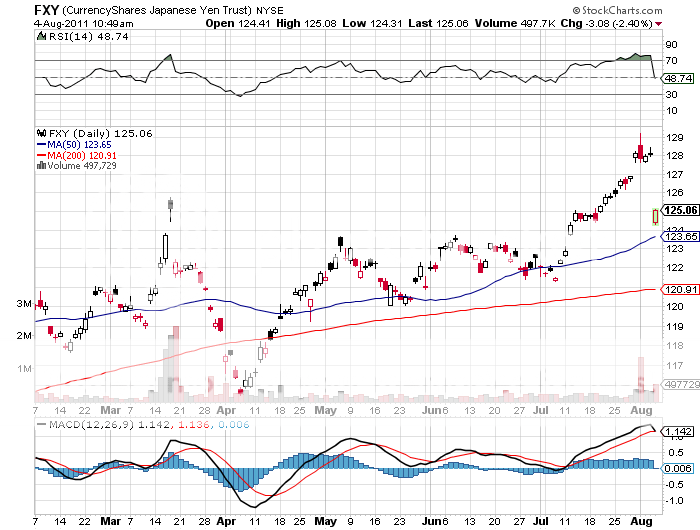
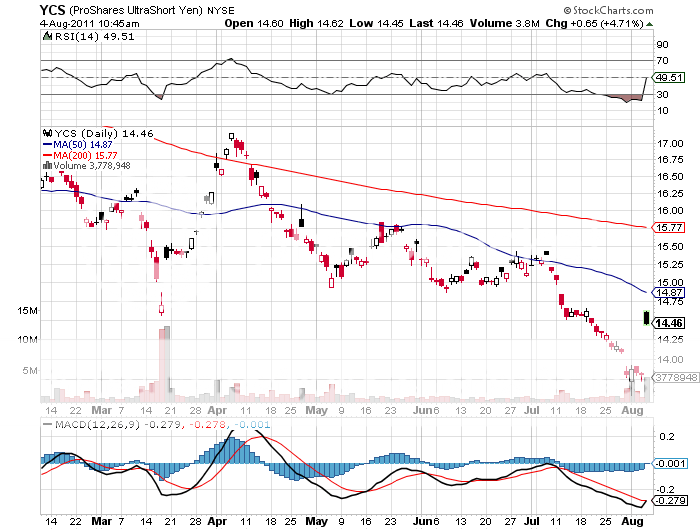
Here is where to watch for the next major turn in the markets. The traditional safe havens of gold, the Swiss franc, the yen, and Treasury bonds, have all posted hyperbolic moves to the upside over the past two weeks.
Now gold is making topping noises, the yen has seen a major reversal, and the Swiss franc has stalled. The fact that this is all happening in August makes all of these big moves suspect.
We may be seeing the first cracks in this monolithic 'RISK OFF' trade in the Japanese yen today. The Bank of Japan finally awoke from its long slumber, moving into the foreign exchange markets with a major intervention, gapping the yen down three and a half handles against the dollar. The leveraged short yen ETF (YCS) soared.
Further hope was engendered by the weekly jobless claims, which showed a loss of only 1,000. This is the second week in a row at the 400,000 level. Talk about being stuck on the 50 yard line.
JP Morgan dramatically ratcheted down its forecast for Q3 from 2.50% to 1.50%. Q4 was chopped from 3% to 2.5%. It now believes that we can expect no more than 2% growth in the first half of next year. Unemployment will stay at 9% through the end of 2012. It expects no movement by the Federal Reserves on interest rates until 2013.
I can't tell you how many people tried to get me to buy today. The fact that I ignored them is the only reason I still have ten fingers, as catching a falling knife did not appeal. If you believe that this is just a correction in a bull market, then this is a fantastic place to buy, and the rout will be over in a few days.
If, in fact, the next recession has already begun, then we have just seen the first 12% of a 50% move down that will last three years. That is because there will be no safety net in the next crash in the form of TARP, supplementary budgets, or QE3. The Tea Party wouldn't hear of it. I thought this worst case scenario wouldn't start until next year, but I could be wrong.
-
-
-
-
https://madhedgefundtrader.com/wp-content/uploads/2019/05/cropped-mad-hedge-logo-transparent-192x192_f9578834168ba24df3eb53916a12c882.png00Mad Hedge Fund Traderhttps://madhedgefundtrader.com/wp-content/uploads/2019/05/cropped-mad-hedge-logo-transparent-192x192_f9578834168ba24df3eb53916a12c882.pngMad Hedge Fund Trader2011-08-05 02:00:592011-08-05 02:00:59August 5, 2011 - Here is Where to Watch for the Turn
2) Report From Europe, Part V. My first morning in the Swiss mountain hamlet of Zermatt, home to the Matterhorn, I was awoken by an army platoon outside my door, fully armed with fixed bayonets.
No, I was not being arrested for past indiscretions in the idyllic Alpine paradise. My often inflammatory opinions had not even triggered an international incident worthy of military action. It was in fact, the traditional religious holiday of Corpus Christie, and the entire town was conducting a parade past my hotel, brass band and all, at 6:00 am.
Was It Something I Said?
-
I was here to launch my annual assault on the Matterhorn, at 14,692 feet, one of the highest in Europe, and taller than any in the continental US. At 11,000 feet I was driven back by howling 50 mile an hour winds and snow. Some 30 climbers a year die in accidents in the Zermatt area every year, and I was not about to make it 31. Many tumble down the mountain's 3,000 foot sheer face and disappear into crevasses, never to be found again.
Back in town I stopped at the Chamber of Commerce to pick up my 40 year visitor's loyalty pin. I have been trying to summit the peak since the sixties. The pin entitles me to free concerts at the 18th century church and other such frills.
Maybe Next Year
-
When I first arrived here, the town was overrun with American college students, backpacking around Europe on shoestring budgets, using their Eurail passes to sleep on overnight trains to save the cost of a Youth Hostel. Alas, the age has passed, and today they are gone.
The weak dollar means that the only young Americans you see are the children of hedge fund managers and Fortune 500 CEO's flaunting Rolex watches and daddy's American Express platinum card, acting as obnoxious as they can. The locals are relieved.
The Strong Swiss Franc Forced Some Economies
-
Since the Matterhorn has some mystical hold over the Japanese as the world's most perfect mountain, tour groups are here en masse. At one traditional Swiss restaurant I saw one very loud, drunken fellow stagger from table to table, annoying every guest.
I knew from hard earned experience that this red faced guy was going to throw up any minute.? I asked the owner why he didn't throw him out. He said that the miscreant was the tour guide, if he left, his 20 big spending customers would depart with him, and he couldn't afford to lose the business.
Can I Make a Collect Call to the 16th Century?
-
Zermatt has been a transit point for those traveling between Northern and Southern Europe for thousands of years. During WWII refugees fleeing fascist Italy were guided to the edge of the glacier never seen again. Hundreds are thought to be still entombed in the many crevasses.
On a previous trip, search and rescue was sent out to retrieve a newly discovered body. After sifting through his pockets and dating the coins, authorities realized that the unfortunate victim had been there for at least 400 years.
I always avoid the cheesy souvenir shops, as most of their offerings are now made in China, and I already have enough Swiss Army knives to last a lifetime. Instead, I do my shopping at the local hardware store and supermarket, loading up on my favorite mustard, chocolate bars, and a few cow bells.
After five days of climbing lesser, easier peaks, I boarded the vintage cog railway for a return to modern civilization. I'll be back next year for another Matterhorn attempt, more plates of bratwurst and r??sti potatoes, and those great Swiss lagers.
https://madhedgefundtrader.com/wp-content/uploads/2019/05/cropped-mad-hedge-logo-transparent-192x192_f9578834168ba24df3eb53916a12c882.png00Mad Hedge Fund Traderhttps://madhedgefundtrader.com/wp-content/uploads/2019/05/cropped-mad-hedge-logo-transparent-192x192_f9578834168ba24df3eb53916a12c882.pngMad Hedge Fund Trader2011-08-05 01:50:342011-08-05 01:50:34August 5, 2011 - Report From Europe, Part V
Featured Trades: (THE HEAD AND SHOULDERS IS IN), (SPX), (VIX),
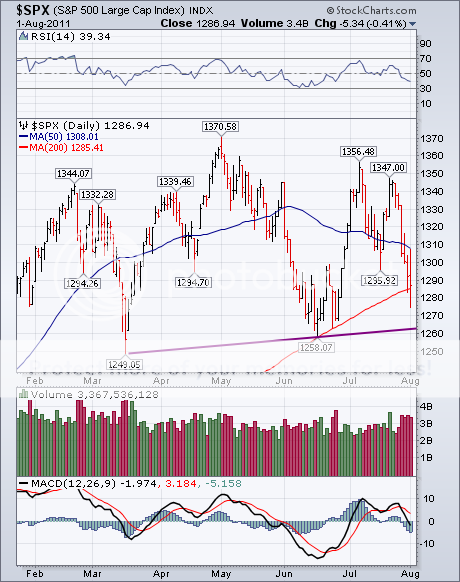
1) The Head and Shoulders Is In. Much of the selling that took the Dow down 265 points on Tuesday was generated by a clear 'head and shoulders top' pattern setting up on the charts. This occurs when you see three consecutive peaks on a chart, with the middle 'head' higher than the two 'shoulders'. This formation often presages more substantial movement on the downside. The number most mentioned by technicians today is 1160 in the S&P 500.
This has been a stunning move, barely escaping the nine consecutive down days not seen since 1978. What amazed everyone was the way the selling drove the indexes through 200 day moving averages like a hot knife through butter. Usually you see a battle fought between bulls and bears around these levels that can last days or weeks. In (SPX)'s case, this happened at 1284. The McClellan oscillator became more oversold than it was at the March, 2009 lows.
The day was saved by a mishmash of data on the jobs front that was just positive enough to cause the selling to abate and permit a 28 point rally in the (SPX). Virtually all the buying was short covering.
The Challenger Report showed job cuts up 60% to 66,414, continuing 16 months of continuous rises. The pharmaceuticals shed the most workers (13,493), followed by retail (11,245), and government (9,389). The greatest losses were in the East. Cisco announced enormous cuts, followed by Merck, and Borders went out of business completely. But ADP private sector employment in July was up 114,000, with 56,000 job gains in small business.
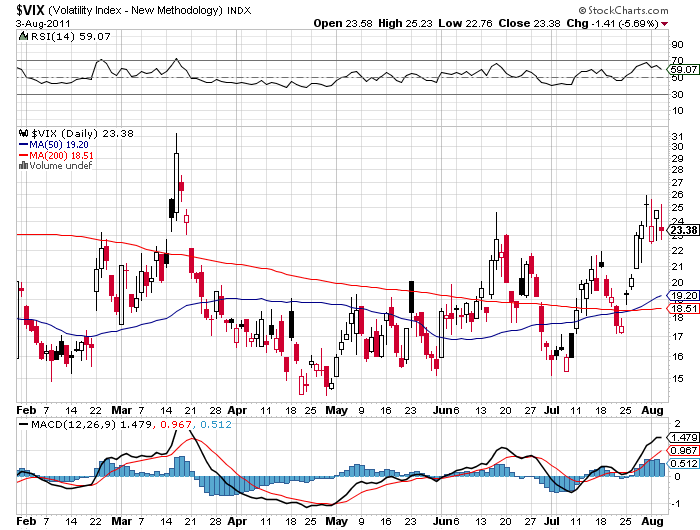
The great mystery in all this is the volatility index (VIX). With a 120 point drop in nine days, you would expect it to rocket well into the $40's. Instead it struggled to top $25 and is now falling. This means that few are buying insurance for further downside moves. There are two possible explanations. The market bottomed today after a good capitulation sell off, sending (VIX) traders into profit taking mode. Or, the big down move is ahead of us, like the next 90 points down to 1160, and the insurance has yet to be bought. I'll let you know which one it is when I figure it out.
One thing I know for sure. Great fortunes are not made selling markets down eight days in a row. We may get the answer when the big enchilada- the July nonfarm payroll figure- comes out on Friday. The consensus now is for a gain of 90,000. Any better than that and the market could surprise to the upside.
-
https://madhedgefundtrader.com/wp-content/uploads/2019/05/cropped-mad-hedge-logo-transparent-192x192_f9578834168ba24df3eb53916a12c882.png00Mad Hedge Fund Traderhttps://madhedgefundtrader.com/wp-content/uploads/2019/05/cropped-mad-hedge-logo-transparent-192x192_f9578834168ba24df3eb53916a12c882.pngMad Hedge Fund Trader2011-08-04 02:00:132011-08-04 02:00:13August 4, 2011 - The Head and Shoulders Is In
Featured Trades: (DO YOU REMEMBER WHEN'..?), (GLD), (INDU), (USO), (FXF)
3) Do You Remember When'?.?The stock market managed to eke out a modest 29 point gain today, the first time in nine trading days. If it had closed down a ninth day, it would have been the first time since 1978.
I remember those days well. The Dow average then was trading at 700. Gold (GLD) was at $180 an ounce. The Euro (FXE) would not be created for 20 years, but the Swiss franc (FXF) was floating around 32 cents. Today it is 75 cents. Crude (USO) was priced at $14 a barrel, and gasoline was a mere 65 cents a gallon.
The Chevette five door hatchback was the top selling car in the US. And we all had mutton chop sideburns.
Yes, I Remember Them Well
https://madhedgefundtrader.com/wp-content/uploads/2019/05/cropped-mad-hedge-logo-transparent-192x192_f9578834168ba24df3eb53916a12c882.png00Mad Hedge Fund Traderhttps://madhedgefundtrader.com/wp-content/uploads/2019/05/cropped-mad-hedge-logo-transparent-192x192_f9578834168ba24df3eb53916a12c882.pngMad Hedge Fund Trader2011-08-04 01:40:022011-08-04 01:40:02August 4, 2011 - Do You Remember When'..?
Featured Trades: (WHAT THE MARKETS ARE TELLING US), (SPX), (TLT), (TBT)
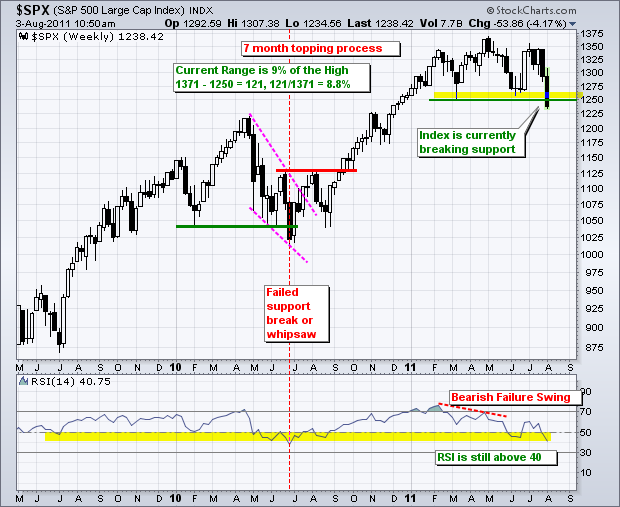
1) What the Markets Are Telling Us. I spent the morning doing a round robin with hedge fund trader friends of mine trying to figure how we all got this so horribly wrong. I did this as the (SPX) was ticking down to 1249 and bond yields cratered to a one year lows at 2.62%.
The uproar of the debt debacle distracted us from what was really driving the markets, the economy. While listening to the hostage drama, where the Tea Party threatened to put a bullet in the head of the world economy unless it got its way, the economic data began a rapid deterioration.
Q2 GDP was marked down to 1.3%, with an even worse revision for Q1 down to 0.9%. This is not a development friendly to asset prices anywhere, and delivered us a huge 'RISK OFF' trade.
Everyone to a man was positioned for a relief rally on the passage of the debt compromise. That's why when the rally came, up to 1,307, it lasted only 15 minutes. When too many crowd one side of the canoe, it flips over. This is why we are all swimming in red ink. Usually, I am watching this happening to other traders, not myself.
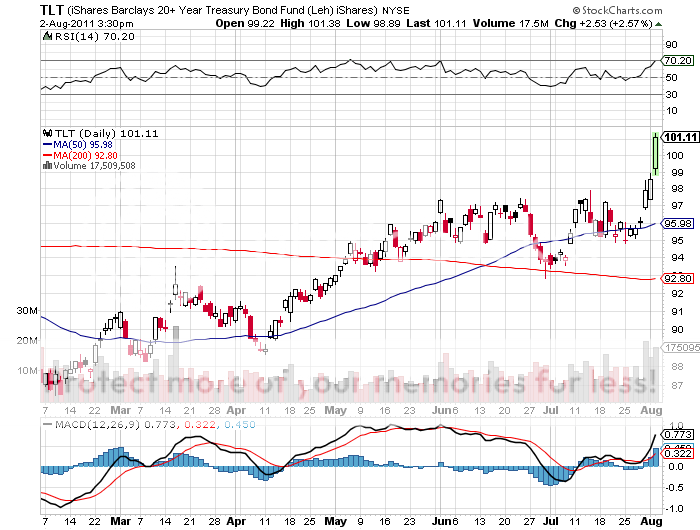
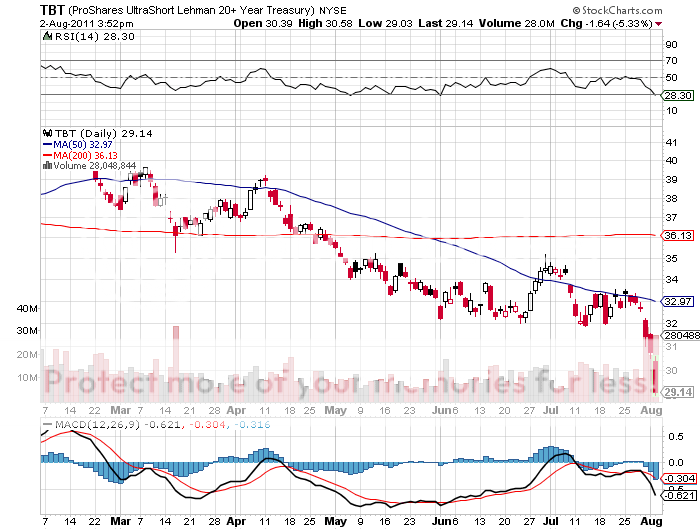
Instead of focusing on the postponement of a downgrade of US Treasury bonds, the markets instead are discounting the chopping of US growth by a third for the next decade that the congressional compromise assures. This is why bonds have soared by six points in a week. Good thing I covered my short call position on the (TLT) on July 22.
What the bond market is telling us is even more interesting. It is proof that the government is borrowing too little money, not too much. The Chinese are kicking themselves that they didn't buy 100% of our monthly bond issuance, instead of only the 50% they did, as prices are now rocketing to 30 year highs. This makes arguments that foreign investors will boycott American debt seem ridiculous. I challenge anyone to point to a market anywhere in the world that disagrees with this obvious conclusion.
The technical damage in the market is compelling, with the S&P 500 trading well below its 200 day moving average. US stocks are about to give up their year. What remains is to see whether the March low can hold here at 1249. If it doesn't, then look out below.
-
-
-
-
Too Many Traders Got Into the Same Canoe
https://madhedgefundtrader.com/wp-content/uploads/2019/05/cropped-mad-hedge-logo-transparent-192x192_f9578834168ba24df3eb53916a12c882.png00Mad Hedge Fund Traderhttps://madhedgefundtrader.com/wp-content/uploads/2019/05/cropped-mad-hedge-logo-transparent-192x192_f9578834168ba24df3eb53916a12c882.pngMad Hedge Fund Trader2011-08-03 02:00:512011-08-03 02:00:51August 3, 2011 - What the Markets Are Telling Us
Legal Disclaimer
There is a very high degree of risk involved in trading. Past results are not indicative of future returns. MadHedgeFundTrader.com and all individuals affiliated with this site assume no responsibilities for your trading and investment results. The indicators, strategies, columns, articles and all other features are for educational purposes only and should not be construed as investment advice. Information for futures trading observations are obtained from sources believed to be reliable, but we do not warrant its completeness or accuracy, or warrant any results from the use of the information. Your use of the trading observations is entirely at your own risk and it is your sole responsibility to evaluate the accuracy, completeness and usefulness of the information. You must assess the risk of any trade with your broker and make your own independent decisions regarding any securities mentioned herein. Affiliates of MadHedgeFundTrader.com may have a position or effect transactions in the securities described herein (or options thereon) and/or otherwise employ trading strategies that may be consistent or inconsistent with the provided strategies.