While the Diary of a Mad Hedge Fund Trader focuses on investment over a one week to six-month time frame, Mad Day Trader, provided by Jim Parker, will exploit money-making opportunities over a brief ten minute to three day window. It is ideally suited for day traders, but can also be used by long-term investors to improve market timing for entry and exit points.
While the Diary of a Mad Hedge Fund Trader focuses on investment over a one week to six-month time frame, Mad Day Trader, provided by Jim Parker, will exploit money-making opportunities over a brief ten minute to three day window. It is ideally suited for day traders, but can also be used by long-term investors to improve market timing for entry and exit points.
Featured Trade: (FRIDAY FEBRUARY 14 SYDNEY, AUSTRALIA STRATEGY LUNCH), (THREE CHARTS THAT WILL TURN THE MARKETS), (TLT), (TBT), (FXY), (YCS), (SPX), (BAC), (C), (GLD), (GRAPES OF WRATH REDUX), (TESTIMONIAL)
iShares 20+ Year Treasury Bond (TLT)
ProShares UltraShort 20+ Year Treasury (TBT)
CurrencyShares Japanese Yen Trust (FXY)
ProShares UltraShort Yen (YCS)
S&P 500 Index (SPX)
Bank of America Corporation (BAC)
Citigroup Inc. (C)
SPDR Gold Shares (GLD)
https://madhedgefundtrader.com/wp-content/uploads/2019/05/cropped-mad-hedge-logo-transparent-192x192_f9578834168ba24df3eb53916a12c882.png00Mad Hedge Fund Traderhttps://madhedgefundtrader.com/wp-content/uploads/2019/05/cropped-mad-hedge-logo-transparent-192x192_f9578834168ba24df3eb53916a12c882.pngMad Hedge Fund Trader2014-02-05 01:07:092014-02-05 01:07:09February 5, 2014
I wrote at length yesterday about why this is not a new bear market, but a traditional 7%-10% correction instead. Now, I?ll show you three charts that will call the exact turnaround.
The ten-year Treasury bond (TLT), (TBT) is clearly the lead contract. It has, far and away, been the most accurate in anticipating the future direction of all asset classes. Get this one right, and everything else falls into line.
Take a look at the chart for the (TLT) below, which has clearly broken the 200 day moving average. I think that this is a false breakout, and that we are not trading in a new $108-$112 trading range that prevailed last spring. Note that while the 200-day average is busted, the 200-week is still putting up fierce resistance. This may well be the line in the sand that counts.
Next, take a look at the chart for the Japanese yen (FXY), (YCS). This is crucial because the yen is the world?s funding currency, thanks to its zero interest rates. When traders are in ?RISK OFF? MODE, they dump their positions in all asset classes and buy yen to repay their broker loans. This forces the yen to appreciate against the US dollar, something the Japanese government is loathe to seeing. This occurs on a scale of trillions of dollars.
When investors throw caution to the wind and pile back into ?RISK ON? portfolios, the reverse happens. They borrow yen and sell them to finance new positions, sending the yen down. Weakness in the yen is therefore the first place you will see a recovery in global markets.
The yen chart bellows shows that it is taking a run at its 200 day moving average at $97.91. That is only $1.70 up from here, and in line with ?100 to the dollar in the cash market, another important resistance level.
My expectation is that the yen will fail here and return to its longer-term downtrend, bringing a major 6% rally against the greenback to an end. That will send a great flashing green light to traders that the buyers strike is over and that its time to get back to work.
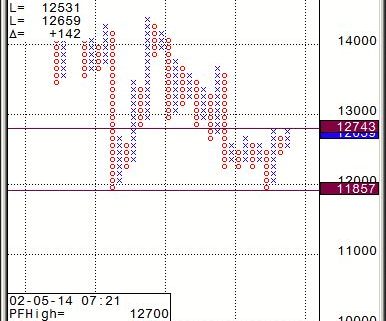
You see a very similar inverse chart with the S&P 500 (SPX). The bottom here also appears to be the 200 day moving average at 1,708, a mere 32 points below today?s low. That is only one bad day away. Watch for a rally from here to trigger simultaneous sell offs in the Treasury bond and yen markets.
You can play this game all day long. A confirming move of a top in interest rates would be a big rally in bank shares, which need higher interest rates to make more money. So keep a laser focus on Bank of America (BAC) and Citigroup (C). At the same time, gold (GLD) will once again get thrown out with the trash, since higher rates punish holders here with a greater opportunity cost.
This all may happen sooner than you think. The Friday January nonfarm payroll neatly sets up a double top in the volatility index at $21. Get a good number, like over 200,000, and see substantial back month revisions up, and volatility will collapse back to the mid teens. Everything else I described above will come to pass.
However, I won?t find out what transpired until Saturday. When the Department of Labor releases the anxiously awaited report, I should be fast asleep in my first class cabin somewhere over French Polynesia on my way to New Zealand. Send me an email on what happens.
The Nonfarm What?
https://www.madhedgefundtrader.com/wp-content/uploads/2014/02/Hula-Girls.jpg269409Mad Hedge Fund Traderhttps://madhedgefundtrader.com/wp-content/uploads/2019/05/cropped-mad-hedge-logo-transparent-192x192_f9578834168ba24df3eb53916a12c882.pngMad Hedge Fund Trader2014-02-05 01:05:332014-02-05 01:05:33Three Charts That Will Turn the Markets
While the Diary of a Mad Hedge Fund Trader focuses on investment over a one week to six-month time frame, Mad Day Trader, provided by Jim Parker, will exploit money-making opportunities over a brief ten minute to three day window. It is ideally suited for day traders, but can also be used by long-term investors to improve market timing for entry and exit points.
As a potentially profitable opportunity presents itself, John will send you an alert with specific trade information as to what should be bought, when to buy it, and at what price. This is your chance to ?look over? John Thomas? shoulder as he gives you unparalleled insight on major world financial trends BEFORE they happen.
Position Update - (UNG)
Second Chance to buy the United States Natural Gas Fund (UNG) July, 2014 $23 puts (not a new position ? only for those who missed the first time)
Strategy Update
2-4-2014
expiration date: July 18, 2014
Portfolio weighting: 5%
Number of contracts:? 30
Those who missed their chance to buy the United States Natural Gas Fund (UNG) July, 2014 $23 puts last week now get a second bite at the apple. Another winter storm has taken the puts all the way down to $1.50 this morning.
Warm weather will return and the (UNG) will take another dive. Supply will catch up with demand, and we have six months to wait it out with this position. Expect a lot of volatility. This is why they call this contract the ?widow maker.?
A Second Bite of the Apple
https://www.madhedgefundtrader.com/wp-content/uploads/2013/01/Gas-Fire.jpg346452Mad Hedge Fund Traderhttps://madhedgefundtrader.com/wp-content/uploads/2019/05/cropped-mad-hedge-logo-transparent-192x192_f9578834168ba24df3eb53916a12c882.pngMad Hedge Fund Trader2014-02-04 11:49:382014-02-04 11:49:38Trade Alert - (UNG) Position Update, February 4, 2014
While the Diary of a Mad Hedge Fund Trader focuses on investment over a one week to six-month time frame, Mad Day Trader, provided by Jim Parker, will exploit money-making opportunities over a brief ten minute to three day window. It is ideally suited for day traders, but can also be used by long-term investors to improve market timing for entry and exit points.
While the Diary of a Mad Hedge Fund Trader focuses on investment over a one week to six-month time frame, Mad Day Trader, provided by Jim Parker, will exploit money-making opportunities over a brief ten minute to three day window. It is ideally suited for day traders, but can also be used by long-term investors to improve market timing for entry and exit points.
Featured Trade: (THREE CORRECTIONS FOR THE PRICE OF ONE), (TLT), (TBT), (SPY), (CHINA?S VIEW OF CHINA), (FXI), (EEM) (FEBRUARY 12 AUCKLAND NEW ZEALND STRATEGY LUNCH)
iShares 20+ Year Treasury Bond (TLT)
ProShares UltraShort 20+ Year Treasury (TBT)
SPDR S&P 500 (SPY)
iShares China Large-Cap (FXI)
iShares MSCI Emerging Markets (EEM)
https://madhedgefundtrader.com/wp-content/uploads/2019/05/cropped-mad-hedge-logo-transparent-192x192_f9578834168ba24df3eb53916a12c882.png00Mad Hedge Fund Traderhttps://madhedgefundtrader.com/wp-content/uploads/2019/05/cropped-mad-hedge-logo-transparent-192x192_f9578834168ba24df3eb53916a12c882.pngMad Hedge Fund Trader2014-02-04 01:06:032014-02-04 01:06:03February 4, 2014
I love this market action. For me, it means that we are setting up ideal entry points for a broad range of asset classes that will deliver another +67% year.
It will set up for you too, if you continue to read this letter.
What the market is in fact doing is giving us three corrections for the price of one. Remember the traditional September swoon that never happened, the worst trading month of the year? How about the forgotten ritual October crash? And the November dip that always precedes the December yearend rally?
Well guess what? After forgetting how to go down for the longest period of time, we are getting all three downturns compressed into a single big one. That will give us a start finish decline of 7.2% in the (SPX) down to 1730, in line with every correction of the past two years (see chart below), and worst case the proverbial 10% textbook correction.
If my assumptions are correct, then in a worst-case scenario we are already 75% through this pullback on a price basis, and 65% on a time basis. Needless to say, selling short stocks here is out of the question. That train left the station at New Years.
After sitting on my hands, shuffling the papers around my desk several times, and going for my umpteenth coffee refill, I finally pulled the trigger on my iShares Barclays 20+ Year Treasury Bond Fund June, 2014 $106 puts trade. It finally entered no brainer territory.
It hit me what had been driving markets this year, but it took a ten-pound sledgehammer to do it.
Bonds have had it absolutely right this year. They took off right out of the gate on January 2 and never looked back.
Stocks on the other hand have been much more confused and disoriented, like an airplane pilot doing aerobatics on Instrument Flight Rules. They initially rose a little bit, right along with bonds, which almost never happens. You knew that wasn?t going to last.
Then they flat lined for two weeks. It took almost a month before traders realized that the punch bowl was gone and it was time to head into ?RISK OFF? mode. The tardy call can be traced to the fact that you calculate your average stock traders? IQ by taking a bond trader?s and then dividing by two.
What all this means is that the bond market has been correctly calling market direction two weeks before the stock market has. This is bound to continue.
There is another factor to consider here. Bond traders have now seen a whopping great eight point rally in a month, taking the yield on the ten year Treasury bond down a massive 45 basis points, from 3.05% to 2.61%. That is just too much profit to sit on.
That is a world ending performance for bonds. Except that Armageddon, it is not. So the pros that got this one right are increasingly going to be sellers on rallies from here on.
Don?t forget that the Federal Reserve will probably continue to knock $10 billion off of its quantitative easing program every six weeks if the economic data continues to come in, as I expect. That could drop its monthly bond purchases from $85 billion a month in December to only $35 billion by June. This is not good for the (TLT). It?s nice to see all of those lunches at the Federal Reserve Bank of San Francisco with the new chairman, Janet Yellen, finally paying off.
If I am wrong on this one, it will be only by a couple of basis points, with the ten year possibly making it to the high 2.50%?s. The global synchronized economic recovery is still on schedule. The economic data and corporate earnings are just too good to see yields drop to 2.50% or lower.
Bull markets don?t die of old age, they die from recessions, and there is absolutely none on the horizon. The weakness in emerging markets is happening because some of their growth is moving back to the US. That is bad for them and great for us. I never liked their food anyway.
Markets also don?t peak at the middle of historic valuation range of 9-22. We are now at 14.5 if the $120/share earnings forecast for 2014 is good.
Profit margins are at all time highs, and rising (see chart below). The heart-rending volatility we have seen so far in 2014 is therefore technical in nature, and not fundamentally driven. It is just a matter of a few days or weeks until the fundamentals reassert themselves, as they always do.
Strip out the drag of government spending, and the private sector is growing at a positively meteoric 5.1% annual rate.
That could happen as early as Friday, when a blockbuster nonfarm payroll is expected to hit. The shocking 84,000 December number reported in January was a weather driven anomaly. Expect this week?s January figure to come in strong, as well as providing big upward revisions to the December report.
Which brings me to the iShares Barclays 20+ Year Treasury Bond Fund June, 2014 $106 put. Only a global synchronized recession would prevent the (TLT) from trading below $103.58, my breakeven point on an expiration basis, over the next five months. Those who can?t buy options can substitute the ProShares Ultra Short 20+ Treasury ETF (TBT) instead.
If the (TLT) makes it back to unchanged on the year at $101 by the June 20 expiration, this position will be up $5,418, or $5.41% for our notional $100,000 portfolio. If it makes it down to $101 sooner, we will make even more money, as there will still put some remaining time value in the put option.
That is up 108% from my initial cost. For that I am willing to take a few basis points of heat for a few days or weeks. It is an ideal buy and hold position, like, for example, you were just about to take a long trip to New Zealand and Australia.
Sounds like a no brainer to me!
The Fat Lady is Singing for the Bond Market
00Mad Hedge Fund Traderhttps://madhedgefundtrader.com/wp-content/uploads/2019/05/cropped-mad-hedge-logo-transparent-192x192_f9578834168ba24df3eb53916a12c882.pngMad Hedge Fund Trader2014-02-04 01:05:212014-02-04 01:05:21Three Corrections for the Price of One
Legal Disclaimer
There is a very high degree of risk involved in trading. Past results are not indicative of future returns. MadHedgeFundTrader.com and all individuals affiliated with this site assume no responsibilities for your trading and investment results. The indicators, strategies, columns, articles and all other features are for educational purposes only and should not be construed as investment advice. Information for futures trading observations are obtained from sources believed to be reliable, but we do not warrant its completeness or accuracy, or warrant any results from the use of the information. Your use of the trading observations is entirely at your own risk and it is your sole responsibility to evaluate the accuracy, completeness and usefulness of the information. You must assess the risk of any trade with your broker and make your own independent decisions regarding any securities mentioned herein. Affiliates of MadHedgeFundTrader.com may have a position or effect transactions in the securities described herein (or options thereon) and/or otherwise employ trading strategies that may be consistent or inconsistent with the provided strategies.