While the Diary of a Mad Hedge Fund Trader focuses on investment over a one week to six-month time frame, Mad Day Trader, provided by Jim Parker, will exploit money-making opportunities over a brief ten minute to three day window. It is ideally suited for day traders, but can also be used by long-term investors to improve market timing for entry and exit points. Read more
As a potentially profitable opportunity presents itself, John will send you an alert with specific trade information as to what should be bought, when to buy it, and at what price. This is your chance to ?look over? John Thomas? shoulder as he gives you unparalleled insight on major world financial trends BEFORE they happen. Read more
As a potentially profitable opportunity presents itself, John will send you an alert with specific trade information as to what should be bought, when to buy it, and at what price. Read more
While the Diary of a Mad Hedge Fund Trader focuses on investment over a one week to six-month time frame, Mad Day Trader, provided by Jim Parker, will exploit money-making opportunities over a brief ten minute to three day window. It is ideally suited for day traders, but can also be used by long-term investors to improve market timing for entry and exit points. Read more
While the Diary of a Mad Hedge Fund Trader focuses on investment over a one week to six-month time frame, Mad Day Trader, provided by Jim Parker, will exploit money-making opportunities over a brief ten minute to three day window. It is ideally suited for day traders, but can also be used by long-term investors to improve market timing for entry and exit points. Read more
Global Market Comments
October 21, 2014
Fiat Lux
Featured Trade:
(10 SIGNS OF A MARKET BOTTOM),
(SPY), (IWM), (TLT), (FXE),
(HOW TO SELL SHORT A CALL SPREAD),
(SIGN UP NOW FOR TEXT MESSAGING OF TRADE ALERTS)
SPDR S&P 500 ETF (SPY)
iShares Russell 2000 (IWM)
iShares 20+ Year Treasury Bond (TLT)
CurrencyShares Euro ETF (FXE)

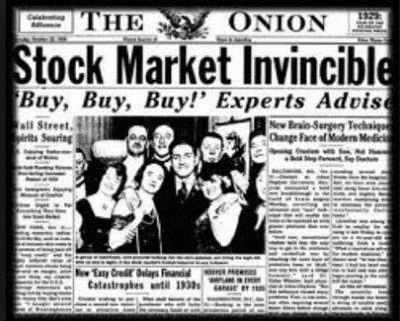
Bottom? Bottom? Where?s the market bottom?
The talking heads on TV have been working overtime speculating on where the worst move down in the stock market in three years will take us.
It all may sound like intelligent prognosticating to you.
As for me, I know they are guessing.
So I shall share with you my ten benchmark indicators that you can closely track to decide for yourself whether stocks are headed for perdition, or are soaring skyward once again.
1) Ten year Treasury bond yields start to rise, and break out above 2.30% (they are now at 2.18%).
2) The US dollar begins to appreciate once again, taking the Euro ETF (FXE) below $125.
3) Inflation expectations start to rise in Europe. Watch the monthly CPI numbers out of France and Italy, which have recently been negative.
4) Fed funds futures start to rise from near zero.
5) The price of crude oil stabilizes. Watch Brent, which will have the sharpest move up once recovery begins.
6) The small cap index, the Russell 2000 (IWM), starts to outperform the S&P 500 (SPY) on the upside. Smaller companies led the retreat on the downside, and should lead a new recovery as traders like me cover shorts (I already have).
7) Cyclical stocks, like airlines (DAL) outperform defensive stocks like soap and shampoo makers (PG) we already captured this with a (DAL) Trade Alert.
8) The junk bond market (HYG) starts to appreciate.
9) The macro data stream delivers a series of positive numbers.
10) People quit talking about the market bottom, and start opining about the next market top.
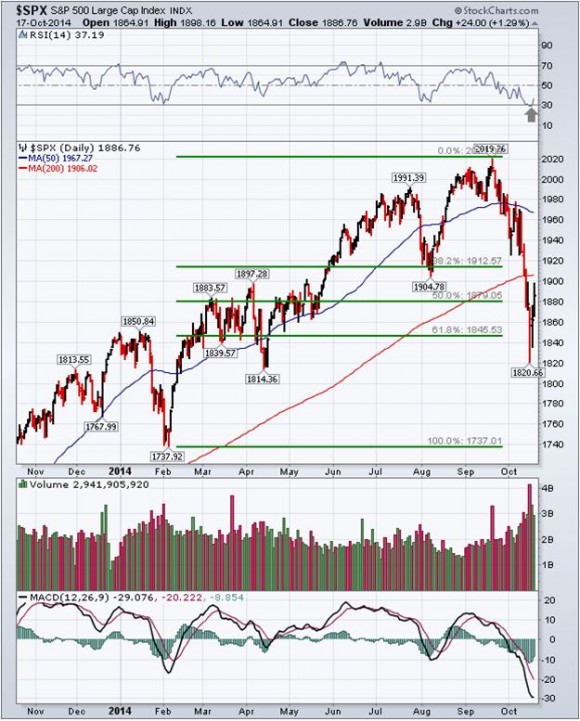
As you have probably figured out buy now with my flurry of recent Trade Alerts, I am leaning towards the probability that the bottom for stocks is already in. It?s all about oil.
I spent my weekend running numbers on the impact that cheap energy will have on the economy, and they are truly staggering. I list a few points below:
1) If oil stays down in this area, it will deliver a savings of $12,000 per family in gasoline, heating bills (being from California, I have only heard about these) and electricity.
2) The increased spending this will generate will add 1% to US GDP growth next year, as the cost of energy is pervasive through all industries, either directly, or indirectly.
3) This amounts to a $1.1 trillion stimulus package for the US economy, larger than the one we got in 2009. Think of it as a QE 4.
I rest my case.
![Infrared Picture]() Watch the Signs (My Infrared Picture)
Watch the Signs (My Infrared Picture)

It?s time to teach some old dogs some new tricks.
This is a bet that the S&P 500 does not climb to a new all time high by the November 21 expiration in 24 trading days.
I think that we need to chop around here a bit and consolidate within a wide range before the (SPY) starts its New Year run to all time highs.
Not wanting to leave a single penny on the table, I want to profit from this likely outcome. Therefore, I am adding a short position in the S&P 500 (SPY) November, 2014 $197-$202 out-of-the-money vertical call spread this morning.
The maximum profit point for this short position is anywhere below $197 in the (SPY), which is above the 50 day moving average. That is 5.7% above the Friday close.
When you sell short a security, your broker places the cash proceeds in your account, and leaves it there as collateral for the position. You give it back when you come out of the position at a later date, hopefully a lesser amount when the trade is profitable.
As long as the (SPY) doesn?t close above $197, you will be able to keep the entire $0.49 premium that you received in cash on the short sale. This cash you receive will be immediately credited to your account and left there until the options expire.
The upside breakeven point for the position is $197.49 (The $197 strike, plus the $0.49 premium you took in on the initial sale).
You can sell short this vertical call spread anywhere in a $0.40-$0.60 range and have a reasonable expectation of making money on this trade.
This is a new kind of position for my Trade Alert followers. It has exactly the same risk profile and margin requirement as buying an S&P 500 (SPY) November, 2014 $197-$202 deep in-the-money vertical put spread.
It does also give us some downside protection with which we can protect our existing long positions in case the market decides to take another swoon. We are just one US Ebola case from the next 300 point plunge in the Dow Average, and there are certain to be more. There is no shortage of morons on this earth.
If the (SPY) has already put in its final bottom and continues to appreciate, you will think you have died and gone to heaven, because your remaining substantial long positions in (BAC), (SPY), and short in the (FXE) will cause your P&L to soar.
You might then take a small loss on your short (SPY) call spread. But then, nobody complains when they buy fire insurance and their house doesn?t burn down. In the meantime, you get the benefit from time decay on this position.
Why am I doing this, other than to educate you on some new tricks of the trade?
Liquidity for deep out of the money puts has become so poor, and the market dislocations so great, that I can actually make more money now on shorting call spreads than buying put spreads, even though they are mirror images of each other.
If you don?t believe me, then try pricing out the (SPY) November $197-$202 deep in-the-money vertical bear put spread and see what you get. Mathematically, they should be the same. But the bid and offered spreads on the puts are wide enough to drive a Ferrari F-50 through.
It's the market makers way of reaching into your pocket and lifting out your wallet.
If all of this sounds too complicated, then just stand aside and watch how this position plays out. Then, maybe you can do it the next time, if conditions permit.


As a potentially profitable opportunity presents itself, John will send you an alert with specific trade information as to what should be bought, when to buy it, and at what price. This is your chance to ?look over? John Thomas? shoulder as he gives you unparalleled insight on major world financial trends BEFORE they happen. Read more
As a potentially profitable opportunity presents itself, John will send you an alert with specific trade information as to what should be bought, when to buy it, and at what price. Read more