While the Diary of a Mad Hedge Fund Trader focuses on investment over a one week to six-month time frame, Mad Day Trader, provided by Jim Parker, will exploit money-making opportunities over a brief ten minute to three day window. It is ideally suited for day traders, but can also be used by long-term investors to improve market timing for entry and exit points.
As a potentially profitable opportunity presents itself, John will send you an alert with specific trade information as to what should be bought, when to buy it, and at what price. Read more
https://www.madhedgefundtrader.com/wp-content/uploads/2011/10/slider-05-trader-alert.jpg316600Mad Hedge Fund Traderhttps://madhedgefundtrader.com/wp-content/uploads/2019/05/cropped-mad-hedge-logo-transparent-192x192_f9578834168ba24df3eb53916a12c882.pngMad Hedge Fund Trader2014-02-03 12:52:582014-02-03 12:52:58Trade Alert - (TLT) February 3, 2014
While the Diary of a Mad Hedge Fund Trader focuses on investment over a one week to six-month time frame, Mad Day Trader, provided by Jim Parker, will exploit money-making opportunities over a brief ten minute to three day window. It is ideally suited for day traders, but can also be used by long-term investors to improve market timing for entry and exit points.
https://madhedgefundtrader.com/wp-content/uploads/2019/05/cropped-mad-hedge-logo-transparent-192x192_f9578834168ba24df3eb53916a12c882.png00Mad Hedge Fund Traderhttps://madhedgefundtrader.com/wp-content/uploads/2019/05/cropped-mad-hedge-logo-transparent-192x192_f9578834168ba24df3eb53916a12c882.pngMad Hedge Fund Trader2014-02-03 12:03:062014-02-03 12:03:06February 3, 2014 - MDT - Candel All Working Orders
While the Diary of a Mad Hedge Fund Trader focuses on investment over a one week to six-month time frame, Mad Day Trader, provided by Jim Parker, will exploit money-making opportunities over a brief ten minute to three day window. It is ideally suited for day traders, but can also be used by long-term investors to improve market timing for entry and exit points.
While the Diary of a Mad Hedge Fund Trader focuses on investment over a one week to six-month time frame, Mad Day Trader, provided by Jim Parker, will exploit money-making opportunities over a brief ten minute to three day window. It is ideally suited for day traders, but can also be used by long-term investors to improve market timing for entry and exit points.
While the Diary of a Mad Hedge Fund Trader focuses on investment over a one week to six-month time frame, Mad Day Trader, provided by Jim Parker, will exploit money-making opportunities over a brief ten minute to three day window. It is ideally suited for day traders, but can also be used by long-term investors to improve market timing for entry and exit points.
Those who followed my advice to buy the United States Natural Gas Fund (UNG) July, 2014 $23 puts at $1.68 yesterday are now in the enviable position of owning a security that is running away to the upside.
At this morning?s high the puts traded at $2.40, a one day gain of an eye popping 43%. I am getting emails from a lucky few that they got in as low as $1.55 after receiving my Trade Alert.
The question is now what to do about it.
I just called friends around the country, and it appears that a warming trend is in place that could last all the away into mid February. It is starting in Florida and Texas and gradually working its away north, although they are still expecting eight inches of snow in Chicago this weekend.
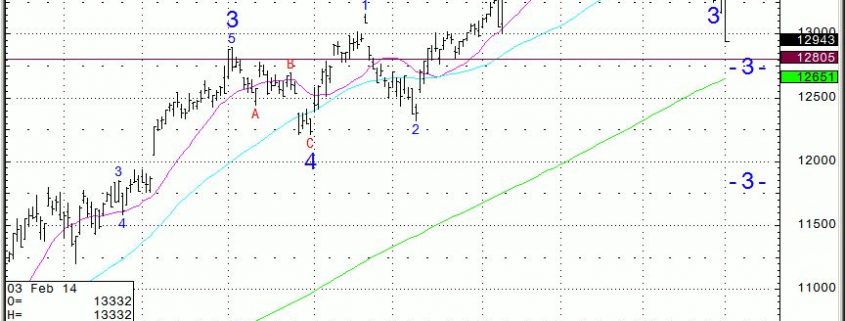
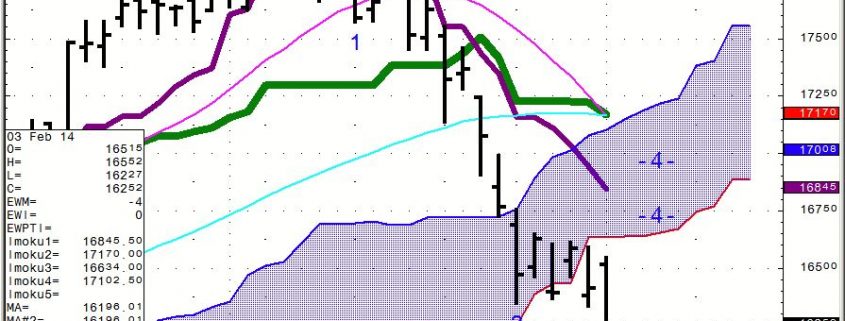
Mad Day Trader Jim Parker is confirming as much with his proprietary trading model chart, which I have included below. He says that we put in an excellent medium term high in the UNG on Thursday at $27. This morning we tested daily support at $23.26 and it held the first time.
But with warmer weather, this is almost certain to break on a future downside push. Then we train out sites on the 18-day moving average at $22.25. After that, $22.07 is in the cards, the top of the gap that we broke through only as recently as January 27, only four days ago.
There, our United States Natural Gas Fund (UNG) July, 2014 $23 puts, with a present delta of 40% (forget this if you don?t speak Greek), should be worth $2.83. You might get more, if implied volatilities for the puts rise on the downside, which they almost always do.
That would be a one-day profit of 68%, adding $3,000 to the value of our notional $100,000 model trading portfolio, or 3% to our performance this year, which I would be inclined to take.
Now it is time to get clever. It would be wise to enter a limit day order to sell your $23 puts right now at the $2.68 price. Since the first visit to these lower numbers usually happens on a big downside spike, the result of stop loss dumping of panic longs accumulated by clueless short term traders this week, you might get lucky and get filled on the first run. If you don?t, keep reentering the limit order every day until it does get done, or until we change our strategy.
This has been one of my best trades in years, and it appears that a lot of followers managed to successfully grab the tiger by the tail.
If there was ever a time to upgrade to Jim Parker?s Mad Day Trader service, it is now. He will see the breakdowns and the reversals with his models faster than I, and get his Trade Alerts out quicker. Why wait for the middleman, who is me? These fast, technically driven markets are where Jim really earns his pay.
If you want to get a pro rata upgrade from your existing newsletter or Global Trading Dispatch subscription to Mad Hedge Fund Trader PRO, which includes Mad Day Trader, just email Nancy in customer support at nmilne@madhedgefundtrader.com.
Do it quick because she is about to get overwhelmed.
Now We?re Cooking with Gas
https://www.madhedgefundtrader.com/wp-content/uploads/2012/04/Natural-gas.jpg300400Mad Hedge Fund Traderhttps://madhedgefundtrader.com/wp-content/uploads/2019/05/cropped-mad-hedge-logo-transparent-192x192_f9578834168ba24df3eb53916a12c882.pngMad Hedge Fund Trader2014-02-03 01:05:422014-02-03 01:05:42Now We?re Cooking With Gas (UNG)
As a potentially profitable opportunity presents itself, John will send you an alert with specific trade information as to what should be bought, when to buy it, and at what price. This is your chance to ?look over? John Thomas? shoulder as he gives you unparalleled insight on major world financial trends BEFORE they happen.
Position Update - (UNG)
Long position United States Natural Gas Fund (UNG) July, 2014 $23 puts at $1.68 or best
Strategy Update
1-31-2014
expiration date: July 18, 2014
Portfolio weighting: 5%
Number of contracts:? 30
(UNG) $23 puts cost basis at?????$1.68
Those who followed my advice to buy the United States Natural Gas Fund (UNG) July, 2014 $23 puts at $1.68 yesterday are now in the enviable position of owning a security that is running away to the upside.
At this morning?s high the puts traded at $2.40, a one day gain of an eye popping 43%. I am getting emails from a lucky few that they got in as low as $1.55 after receiving my Trade Alert.
The question is now what to do about it.
I just called friends around the country, and it appears that a warming trend is in place that could last all the away into mid February. It is starting in Florida and Texas and gradually working its away north, although they are still expecting eight inches of snow in Chicago this weekend.
Mad Day Trader Jim Parker is confirming as much with his proprietary trading model, the chart from which I have included below. He says that we put in an excellent medium term high in the UNG on Thursday at $27. This morning we tested daily support at $23.26 and it held the first time.
But with warmer weather, this is almost certain to break on a future downside push. Then we train out sites on the 18-day moving average at $22.25. After that, $22.07 is in the cards, the top of the gap that we broke through only as recently as January 27, only four days ago.
There our United States Natural Gas Fund (UNG) July, 2014 $23 puts, with a present delta of 40% (forget this if you don?t speak Greek), should be worth $2.83. You might get more, if implied volatilities for the puts rise on the downside, which they almost always do.
That would be a one-day profit of 68%, adding $3,000 to the value of our notional $100,000 model trading portfolio, or 3% to our performance this year, which I would be inclined to take.
Now it is time to get clever. It would be wise to enter a limit day order to sell your $23 puts right now at the $2.68 price. Since the first visit to these lower numbers usually happens on a big downside spike, the result of stop loss dumping of panic longs accumulated by clueless short term traders this week, you might get lucky and get filled on the first run. If you don?t keep reentering the limit order every day until it does get done, or until we change our strategy.
This has been one of my best trades in years, and it appears that a lot of followers managed to successfully grab the tiger by the tail.
If there was ever a time to upgrade to Jim Parker?s Mad Day Trader service, it is now. He will see the breakdowns and the reversals with his models faster than I, and get his Trade Alerts out quicker. Why wait for the middleman, who is me? These fast, technically driven markets are where Jim really earns his pay.
If you want to get a pro rata upgrade from your existing newsletter or Global Trading Dispatch subscription to Mad Hedge Fund Trader PRO, which includes Mad Day Trader, just email Nancy in customer support at nmilne@madhedgefundtrader.com, or call her now at 888-716-1115.
Do it quick because she is about to get overwhelmed.
Now We?re Cooking With Gas
https://www.madhedgefundtrader.com/wp-content/uploads/2012/04/Natural-gas.jpg300400Mad Hedge Fund Traderhttps://madhedgefundtrader.com/wp-content/uploads/2019/05/cropped-mad-hedge-logo-transparent-192x192_f9578834168ba24df3eb53916a12c882.pngMad Hedge Fund Trader2014-01-31 14:05:282014-01-31 14:05:28Trade Alert - (UNG) Strategy Update - January 31, 2014
While the Diary of a Mad Hedge Fund Trader focuses on investment over a one week to six-month time frame, Mad Day Trader, provided by Jim Parker, will exploit money-making opportunities over a brief ten minute to three day window. It is ideally suited for day traders, but can also be used by long-term investors to improve market timing for entry and exit points.
https://madhedgefundtrader.com/wp-content/uploads/2019/05/cropped-mad-hedge-logo-transparent-192x192_f9578834168ba24df3eb53916a12c882.png00Mad Hedge Fund Traderhttps://madhedgefundtrader.com/wp-content/uploads/2019/05/cropped-mad-hedge-logo-transparent-192x192_f9578834168ba24df3eb53916a12c882.pngMad Hedge Fund Trader2014-01-31 12:51:562014-01-31 12:51:56January 31, 2014 - MDT - VIX Trade Alert Update
Legal Disclaimer
There is a very high degree of risk involved in trading. Past results are not indicative of future returns. MadHedgeFundTrader.com and all individuals affiliated with this site assume no responsibilities for your trading and investment results. The indicators, strategies, columns, articles and all other features are for educational purposes only and should not be construed as investment advice. Information for futures trading observations are obtained from sources believed to be reliable, but we do not warrant its completeness or accuracy, or warrant any results from the use of the information. Your use of the trading observations is entirely at your own risk and it is your sole responsibility to evaluate the accuracy, completeness and usefulness of the information. You must assess the risk of any trade with your broker and make your own independent decisions regarding any securities mentioned herein. Affiliates of MadHedgeFundTrader.com may have a position or effect transactions in the securities described herein (or options thereon) and/or otherwise employ trading strategies that may be consistent or inconsistent with the provided strategies.