As a potentially profitable opportunity presents itself, John will send you an alert with specific trade information as to what should be bought, when to buy it, and at what price. Read more
While the Diary of a Mad Hedge Fund Trader focuses on investment over a one week to six-month time frame, Mad Day Trader, provided by Jim Parker, will exploit money-making opportunities over a brief ten minute to three day window. It is ideally suited for day traders, but can also be used by long-term investors to improve market timing for entry and exit points. Read more
While the Diary of a Mad Hedge Fund Trader focuses on investment over a one week to six-month time frame, Mad Day Trader, provided by Jim Parker, will exploit money-making opportunities over a brief ten minute to three day window. It is ideally suited for day traders, but can also be used by long-term investors to improve market timing for entry and exit points. Read more
Global Market Comments
April 24, 2015
Fiat Lux
Featured Trade:
(WEDNESDAY APRIL 29 GLOBAL STRATEGY WEBINAR),
(THE RECESSION IS OVER!),
(PLEASE USE MY FREE DATA BASE SEARCH)

The earnings announced for Q1 so far have been miserable, pummeled by a weak Euro, terrible weather and the West Coast port strike. But rather than collapse, global equity markets have punched through to new highs.
It isn?t just the United States that is performing this magic trick. Most European indexes (HEDJ) have blasted through to new eight-year highs.
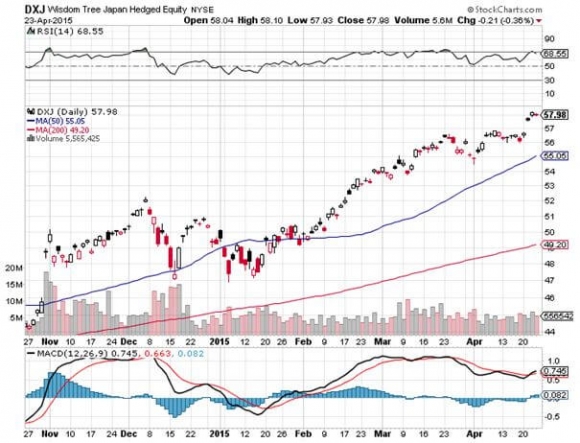
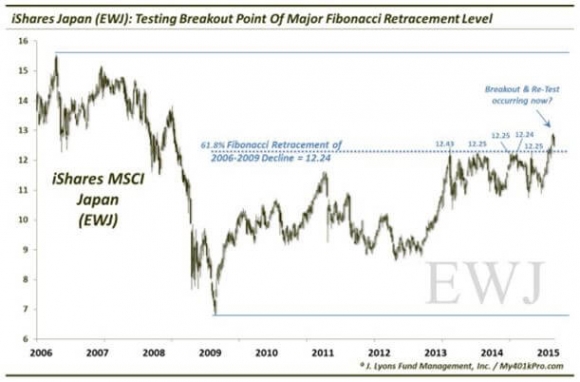
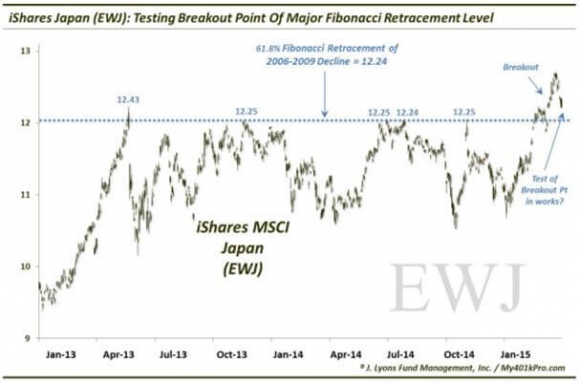
Even more impressive is the Nikkei average?s breakout to a new 15-year summit, making short work of key long-term Fibonacci levels that have been holding the Japanese stock index back for months.
That totally works for me, as I am keeping 10% of my model-trading portfolio in the Wisdom Tree Japan Hedged Equity ETF (DXJ), and another 10% short the Currency Shares Japanese Yen Trust ETF (FXY).
What gives?
The hard truth is that the American economy suffered a recession during January to March, and that recession is now over. Call it the mini recession that came and went so fast that you missed it if you blinked.
What happens next is that the weather improves and the men on strike go back to work. If the Euro does continue to fall, it will only be the last 10% of a 45%, seven-year move from $1.60 to $0.88. It is rather late in the game to sell short the Euro. In other words, it is almost over.
So, there is nothing left for stocks to do but discount a new economic recovery. In layman?s terms, that means ?Go up.?
For economic historians, such as myself, this was a most peculiar recession. For a start, no one knew it was happening. By the time they did, it was over. Interest rates never moved an iota. Unemployment fell. And stocks maintained their relentless push northward.
Man, this is my kind of recession!
So, what happens next?
Stocks go up more, but not by much. We haven?t had a clearing, capitulation type sell off since October. Since we never went down by more than 4% this year, that means the gains from here will be modest as well. I?m thinking that the S&P 500 (SPY) might reach $215 by June.
That?s why I took the bold move of buying the S&P 500 SPDR?s (SPY) May, 2015 $215-$218 in-the-money vertical bear put spread yesterday. As long as the index trades below $215 on the May 15 expiration day, in 15 trading days, I will get to keep the maximum potential profit or some 12.6% on the trade in only 3 weeks.
Not bad.
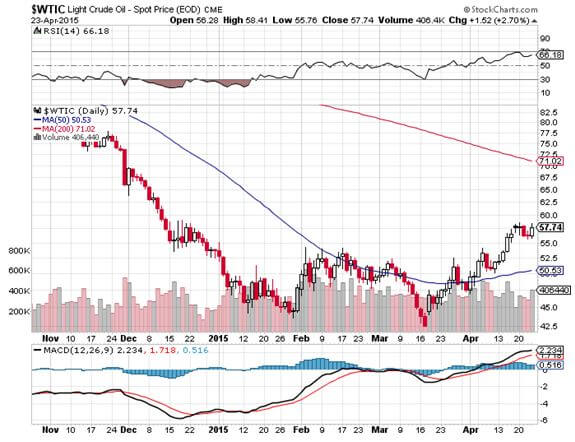
If you don?t believe me, then take a look at the price of Texas tea. Since it bottomed on March 17, the price of crude has rocketed by an awesome 37%, from $42.50 to $58, one of the sharpest moves in history.
This set energy stocks, and my favorite, solar shares, on fire, which played a major role in supporting the indexes at their lofty levels. At this point, the entire world is hoping to buy energy on the next dip and turn their holdings into energy portfolios.
Let me toy with your mind a little bit more. With another economic recovery on hand, the Federal Reserve is going to have to raise interest rates sooner or later (Hey Janet! Call me!).
However, just as this bull market is unlike any other, so may be the next interest rate cycle. When the headline unemployment rate hits 5% next year, the Fed will boost rates, but only by ?%. After that, we may see a second, and possibly a third ?% hike.
Then they will be done. Interest rates will peak at 1% and then a new recession, possibly only another ?mini? one, will prompt a rapid decent in interest rates down to zero. In other words, the next entire interest rate cycle may have Fed funds go from 0.25% to 1%, and then down to 0%.
Pshaw! You may say. But consider this: Deflation is still everywhere. There is no hint of wage pressure whatsoever. Commodity prices have just staged a modest rally, but are still a fraction of their old highs.
And as long as Janet Yellen heads the Federal Reserve, which is another 4-9 years at the very least, there will be no interest rate increases until we have proof of real inflation. That leaves us with only the above-mentioned token interest rate rises for the foreseeable future.
Let me throw one more idea out there for you to chew over.
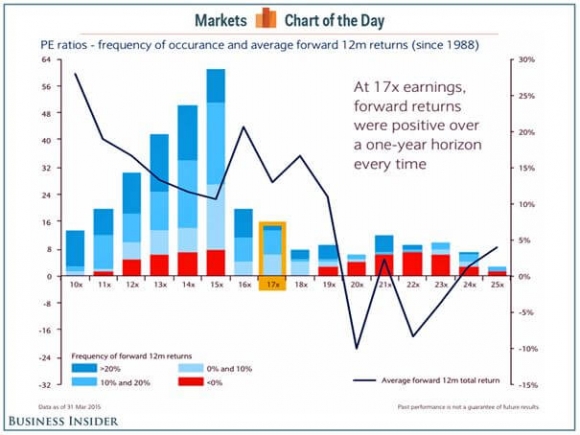
Take a look at the chart below from my friends at Business Insider. Every time stocks traded at a 17X multiple since 1988, shares generated a positive return over the following 12 months.
That certainly makes stocks look like a ?BUY? to me!
![Magician]() Stocks at These Levels Requires No Magic Trick
Stocks at These Levels Requires No Magic Trick

While the Diary of a Mad Hedge Fund Trader focuses on investment over a one week to six-month time frame, Mad Day Trader, provided by Jim Parker, will exploit money-making opportunities over a brief ten minute to three day window. It is ideally suited for day traders, but can also be used by long-term investors to improve market timing for entry and exit points. Read more
As a potentially profitable opportunity presents itself, John will send you an alert with specific trade information as to what should be bought, when to buy it, and at what price. This is your chance to ?look over? John Thomas? shoulder as he gives you unparalleled insight on major world financial trends BEFORE they happen. Read more
As a potentially profitable opportunity presents itself, John will send you an alert with specific trade information as to what should be bought, when to buy it, and at what price. This is your chance to ?look over? John Thomas? shoulder as he gives you unparalleled insight on major world financial trends BEFORE they happen. Read more
While the Diary of a Mad Hedge Fund Trader focuses on investment over a one week to six-month time frame, Mad Day Trader, provided by Jim Parker, will exploit money-making opportunities over a brief ten minute to three day window. It is ideally suited for day traders, but can also be used by long-term investors to improve market timing for entry and exit points. Read more
p>As a potentially profitable opportunity presents itself, John will send you an alert with specific trade information as to what should be bought, when to buy it, and at what price. Read more