As a potentially profitable opportunity presents itself, John will send you an alert with specific trade information as to what should be bought, when to buy it, and at what price. Read more

As a potentially profitable opportunity presents itself, John will send you an alert with specific trade information as to what should be bought, when to buy it, and at what price. This is your chance to ?look over? John Thomas? shoulder as he gives you unparalleled insight on major world financial trends BEFORE they happen. Read more
As a potentially profitable opportunity presents itself, John will send you an alert with specific trade information as to what should be bought, when to buy it, and at what price. Read more
While the Diary of a Mad Hedge Fund Trader focuses on investment over a one week to six-month time frame, Mad Day Trader, provided by Bill Davis, will exploit money-making opportunities over a brief ten minute to three day window. It is ideally suited for day traders, but can also be used by long-term investors to improve market timing for entry and exit points. Read more
Global Market Comments
January 27, 2016
Fiat Lux
Featured Trade:
(2015 TRADE ALERT REVIEW),
(AAPL), (GILD), (GS), (PANW), (IWM), (SPY),
(GLD), (TLT), (LINE), (VIX), (XIV),
(SIGN UP NOW FOR TEXT MESSAGING OF TRADE ALERTS)
Apple Inc. (AAPL)
Gilead Sciences Inc. (GILD)
The Goldman Sachs Group, Inc. (GS)
Palo Alto Networks, Inc. (PANW)
iShares Russell 2000 (IWM)
SPDR S&P 500 ETF (SPY)
SPDR Gold Shares (GLD)
iShares 20+ Year Treasury Bond (TLT)
Linn Energy, LLC (LINE)
VOLATILITY S&P 500 (^VIX)
VelocityShares Daily Inverse VIX ST ETN (XIV)

When is the Mad Hedge Fund Trader a genius, and when is he a complete moron?
That is the question readers have to ask themselves whenever their smart phones ping, and a new Trade Alert flashes on their screens.
I have to confess that I wonder myself sometimes.
So I thought I would run my 2015 numbers to find out when I was a hero, and when I was a goat.
The good news is that I was a hero most of the time, and a goat only occasionally. Here is the cumulative profit and loss for the 100 Trade Alerts that I closed during calendar 2015, listed by asset class.
Profit by Asset Class
Equities +32.90%
Foreign Exchange +8.82%
Energy +0.48%
Precious Metals -1.51%
Volatility -3.14%
Fixed Income -5.63%
The first thing you will notice is that the above numbers total +31.62%, compared to the +38.87% profit that I reported as my 2015 performance.
That?s because we mark all positions to market daily, like a real hedge fund does, including the first and last days of the years. The P&L figures above are for only closed trades, hence the -7.25% shortfall.
All in all, some 71% of my Trade Alerts were profitable last year, less than in 2014, but still beating all competitors. That?s better than a poke in the eye with a sharp stick.
Crucial in 2015 was to stop out of losers quickly. I followed that discipline most of the time, but not always. Sometime you can?t, like when the Dow opens down 1,200 points, which it did in the summer.
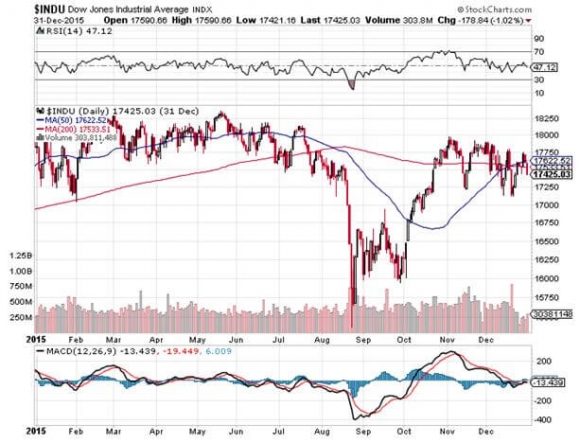
Equities were far and away my most successful asset class in 2015, thanks to the tremendous volatility we endured. They accounted for 73 of my Trade Alerts, generating an impressive +32.90% profit.
Some 63% of my equity trades were profitable, with almost all of the losers showing up in the final quarter of the year, when the indexes flip flopped their way to a small annual loss.
The first half of 2015 saw me putting the pedal to the metal with an aggressive ?RISK ON? approach, picking up Apple (AAPL), Gilead Sciences (GILD), Goldman Sachs (GS), Palo Alto Networks (PANW), the Russell 2000 (IWM), and the S&P 500 (SPY).
Then I executed an abrupt about turn, ?selling in May, and going away?. That got me out of the biotech and cyber security sectors at the absolute top.
We even made money on the short side, with positions in trouble QUALCOMM (QCOM) and expiring AT&T (T).
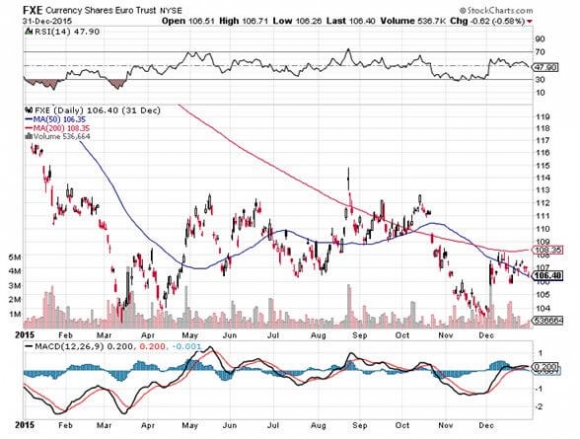
The foreign exchange market was a nice little earner for me, chipping in a +8.52%, with 13 Trade Alerts.
Seeing a coming tidal wave of European quantitative easing, I totally nailed the collapse in the Euro (FXE) against the dollar early in the year. Betting against the Japanese yen (FXY) also helped.
However, in the run up to the Federal Reserve?s first interest rate hike in a decade, foreign currency trading opportunities became few and far between.
Incredibly, I picked up a modest 0.48% trading energy, with only a single trade in Linn Energy (LINE). But my big call here was to avoid the sector like the plague. A lot of fingers were lost catching falling knives, with near weekly calls for the bottom in oil by others.
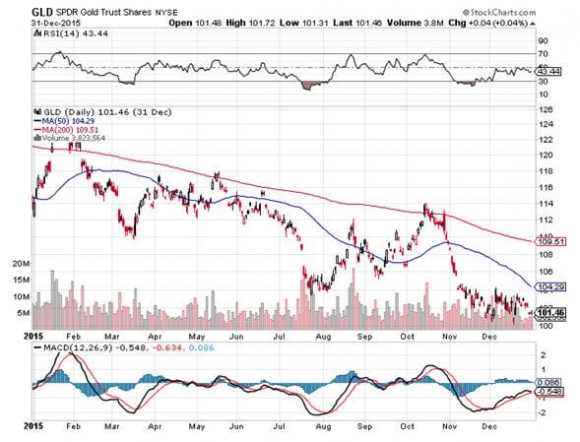
Mercifully, I only executed one trade in gold (GLD) in 2015, and that one was a loser for -1.51%. But we chopped a lot of wood here putting in a major long-term bottom, and I now think the opportunities in precious metals will be to the upside.
Trading the Volatility Index (VIX) was a nightmare in 2015, and it cost me -3.14%. But I was able to limit my losses by making money selling short those big upward spikes during the fourth quarter through the (XIV).
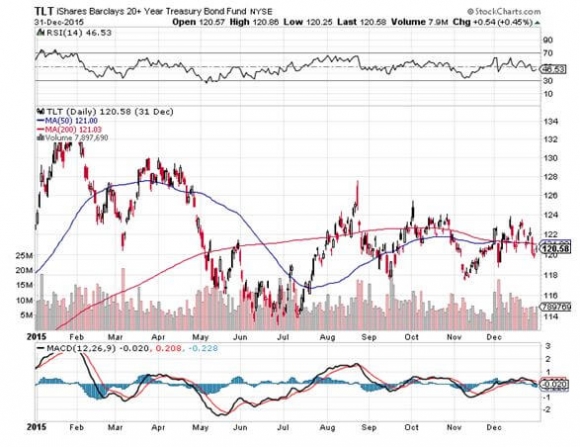
Fixed income (TLT) was my big loser last year, thanks to a single trade, a short position on the fateful August 24 flash crash. The rest of the eight trades I executed for the year was profitable, and on the short side.
All in all, it was a pretty good year.
What was my best trade of 2015? I made 2.47% with a long position in Apple in April in the run up to a positive earnings report.
And my worst trade of 2015? I got hit with a horrific 5.59% speeding ticket with a short position in the S&P 500 (SPY) during the October melt up which I held on to just a bit too long.
But I lived to fight another day, making all the money back the following month.
After a rocky start, 2016 promises to be another great year. That is, provided you ignore my advice on fixed income. But who knows? It is a different world now, with a fresh array of opportunities.
As of yesterday?s writing, I was up +1.98% on the year, compared to a heart rending plunge in the Dow Average of -10.7%. It was the worst start to trading in market history.
Up small in a market crash? I?ll take that all day long. I bet you will too.

Here is a complete list of every trade I closed last year, sorted in chronological order.
|
2015 Trade Alert Summary |
? | ? | ? | |
| ? | ? | ? | ? | ? |
|
Date |
? |
Asset |
Long/ |
Profit/ |
|
Closed |
Position |
Class |
Short |
Loss |
| ? | ? | ? | ? | ? |
|
1/6/15 |
(IWM) 2/$103-$118 call spread |
equities |
long |
-4.78% |
|
1/8/15 |
(FXE) 2/$122-$124 put spread |
equities |
long |
2.01% |
|
1/8/15 |
(FXE) 2/$120-$122 put spread |
equities |
long |
2.33% |
|
1/8/15 |
(BAC) 2/$16 calls |
equities |
long |
-1.82% |
|
1/9/15 |
(GILD) 1/$85-$90 call spread |
equities |
long |
1.36% |
|
1/9/15 |
(TBT) short Treasury Bond ETF |
fixed income |
long |
-2.51% |
|
1 |
(OXY) 2/$70-$75 call spread |
equities |
long |
-2.66% |
|
1/14/15 |
(BAC) 2/$15-$16 call spread |
equities |
long |
-1.84% |
|
1/21/15 |
(BAC) 2/$14-$15 call spread |
equities |
long |
-0.24% |
|
1/29/15 |
(QCOM) 2/$75-$80 put spread |
equities |
long |
2.13% |
|
2/2/15 |
(SPY) 2/$189-$194 call spread |
equities |
long |
0.80% |
|
2/2/15 |
(IWM) 2/$107-$112 callspread |
equities |
long |
1.22% |
|
2/2/15 |
(LINE) unit |
MLP |
long |
-3.72% |
|
2/4/15 |
(AA) 2/$17-$18 put spread |
equities |
long |
0.25% |
|
2/6/15 |
(T) 2/$35-$37 put spread |
equities |
long |
1.20% |
|
2/20/15 |
(GILD) 2/$87.50-$92.50 call spread |
equity |
long |
1.84% |
|
2/20/15 |
(SPY) 2/$199-$202 call spread |
equity |
long |
1.96% |
|
2/20/15 |
(FXY) 2/$84-$87 put spread |
foreign exchange |
long |
1.33% |
|
3/2/15 |
(IWM) 4/$116-$120 call spread |
equity |
long |
1.67% |
|
3/6/15 |
(CSCO) 3/$27-$29 call spread |
equity |
long |
0.35% |
|
3/6/15 |
(SPY) 3/$200-$204 call spread |
equity |
long |
0.52% |
|
3/6/15 |
(FXE) 4/$112-$115 put spread |
foreign exchange |
long |
2.02% |
|
3/9/15 |
(GLD) 3/$107-$112 call spread |
precious metals |
long |
-0.59% |
|
4/9/15 |
(FXE) 4/$109-$112 put spread |
foreign exchange |
long |
1.64% |
|
4/10/15 |
(IWM) 4/$116-$119 call spread |
equity |
long |
1.64% |
|
4/15/15 |
(GS) 4/$175-$180 call spread |
equity |
long |
1.40% |
|
4/15/15 |
(FCX) 5/$16-$17 call spread |
equity |
long |
2.25% |
|
4/23/15 |
(LEN) 5/$45-$49 call spread |
equity |
long |
-2.81% |
|
4/27/15 |
(FXY) 6/$82-84 put spread |
foreign exchange |
long |
0.65% |
|
4/28/15 |
(AAPL) 5/$115-120 call spread |
equity |
long |
2.47% |
|
4/29/15 |
(FXE) 5/$99-$102 call spread |
foreign exchange |
long |
1.68% |
|
4/30/15 |
(FCX) 5/$17 calls |
equity |
long |
1.25% |
|
4/30/15 |
(DXJ) Japan Hedged Equity ETF |
equity |
long |
0.29% |
|
4/30/15 |
(GOOG) 5/$520-$540 call spread |
equity |
long |
-2.25% |
|
5/1/15 |
(PANW) 5/$125-$135 call spread |
equity |
long |
1.44% |
|
5/1/15 |
(IWM) 5/$119-$122 call spread |
equity |
long |
-0.92% |
|
5/6/15 |
(AAPL) 6/$115-$120 call spread |
equity |
long |
-1.08% |
|
5/12/15 |
(SPY) 5/$215-$218 put SPREAD |
equity |
long |
1.18% |
|
5/12/15 |
(SPY) 5/$212-$215 put spread |
equity |
long |
0.67% |
|
5/12/15 |
(UVXY) Proshares Ultra VIX ETF |
volatility |
long |
1.02% |
|
5/15/15 |
(DXJ) Japan Hedged Equity ETF |
equity |
long |
0.10% |
|
5/15/15 |
(GS) 5/$185-$190 call spread |
equity |
long |
1.38% |
|
5/15/15 |
(SPY) 5/$213-$216 put spread |
equity |
long |
1.79% |
|
5/22/15 |
(UVXY) Proshares Ultra VIX ETF |
volatility |
long |
-1.70% |
|
6/3/15 |
(SPY) 6/$202-$207 call spread |
equities |
long |
0.00% |
|
6/5/15 |
(FXE) 6/$113-$116 put spread |
foreign exchange |
long |
1.29% |
|
6/17/15 |
(FXY) 7/$83 put |
foreign exchange |
long |
0.95% |
|
6/19/15 |
(SPY) 6/$201-$204 call spread |
equities |
long |
1.51% |
|
6/19/15 |
(SPY) 6/$214-$217 put spread |
equities |
long |
0.79% |
|
7/24/15 |
(FXY) 8/$82-$84 put spread |
equity |
long |
1.65% |
|
7/29/15 |
(AAPL) 8/$110-$115 call spread |
equity |
long |
1.56% |
|
7/29/15 |
(SPY) 8/$195-$200 call spread |
equity |
long |
1.58% |
|
8/12/15 |
(SPY) 8/$214-$217 put spread |
equity |
long |
1.88% |
|
8/13/15 |
(TLT) 8/$125-$128 put spread |
fixed income |
long |
0.76% |
|
8/17/15 |
(SPY) 8/$214-$217 put spread |
equity |
long |
1.92% |
|
8/20/15 |
(SPY) 9/$214-$217 put spread |
equity |
long |
1.36% |
|
8/20/15 |
(FXE) 9/$112-$115 put spread |
foreign exchange |
long |
0.51% |
|
8/21/15 |
(IWM) 9/$125-$128 put spread |
equity |
long |
1.00% |
|
8/21/15 |
(SPY) 9/$215 puts |
equity |
long |
1.62% |
|
8/24/15 |
(LEN) 9/$50-$52.50 call spread |
equity |
long |
-2.59% |
|
8/24/15 |
(SPY) 9/$190-$195 call spread |
equity |
long |
-1.61% |
|
8/24/15 |
(TLT) 9/$128-$131 put spread |
fixed income |
long |
-1.52% |
|
8/24/15 |
(FXY) 9/$80-$82 put spread |
foreign exchange |
long |
-4.85% |
|
8/28/15 |
(SPY) 9/$204-$208 put spread |
equity |
long |
-0.70% |
|
9/1/15 |
(SPY) 9/$207-$210 put spread |
equity |
long |
1.64% |
|
9/3/15 |
(SPY) 9/$171-$176 call spread |
equity |
long |
1.94% |
|
9/3/15 |
(XIV) Short Volatility ETN |
volatility |
long |
1.03% |
|
9/8/15 |
(SPY) 9/$174-$179 call spread |
equity |
long |
0.86% |
|
9/9/15 |
(SPY) 9/$204-$207 put spread |
equity |
long |
0.74% |
|
9/11/15 |
(XIV) Short Volatility ETN |
volatility |
long |
0.67% |
|
9/21/15 |
(HD) 10/$105-$110 call spread |
equity |
long |
0.62% |
|
9/22/15 |
(SPY) 10/$204-$207 put spread |
equity |
long |
1.19% |
|
9/24/15 |
(SPY) 10/$203-$206 put spread |
equity |
long |
2.18% |
|
9/25/15 |
(XIV) Short Volatility ETN |
equity |
long |
0.97% |
|
9/28/15 |
(SPY) 10/$202-$205 put spread |
equity |
long |
1.33% |
|
9/29/15 |
(SPY) 10/$201-$204 put spread |
equity |
long |
2.07% |
|
9/30/15 |
(SPY) 10/$175-$180 call spread |
equity |
long |
0.40% |
|
10/2/15 |
(XIV) Short Volatility ETN |
equity |
long |
0.47% |
|
10/5/15 |
(SPY) 10/$198-$201 put spread |
equity |
long |
-5.59% |
|
10/5/15 |
(SPY) 10/$199-$202 put spread |
equity |
long |
-4.68% |
|
10/7/15 |
(TSLA) 11/$200-$220 call spread |
equity |
long |
-0.60% |
|
10/7/15 |
(TLT) 10/$130-$133 put spread |
fixed income |
long |
2.16% |
|
10/20/15 |
(SPY) 11/$207-$210 put spread |
equity |
long |
-0.72% |
|
10/29/15 |
(TLT) 11/$128-$133 puts spread |
fixed income |
long |
1.50% |
|
11/3/15 |
(SPY) 11/$213-$216 put spread |
equities |
long |
-0.12% |
|
11/6/15 |
(TLT) 11/$125-$128 put spread |
fixed income |
long |
1.00% |
|
11/11/15 |
(AAPL) 12/$105-$110 call spread |
equity |
long |
-0.17% |
|
11/20/15 |
(SPY) 12/$185-$190 call spread |
equity |
long |
0.92% |
|
11/23/15 |
(FXE) 12/$111-$114 put spread |
foreign exchange |
long |
1.33% |
|
11/30/15 |
(FXY) 12/$82-$84 put spread |
foreign exchange |
long |
1.12% |
|
12/3/15 |
(TLT) 12/$124-$127 put spread |
fixed income |
long |
1.55% |
|
12/4/15 |
(XIV) |
equity |
long |
0.84% |
|
12/8/15 |
(TLT) 1/$112-$115 call spread |
fixed income |
long |
0.81% |
|
12/9/15 |
(FXE) 12/$108-$111 put spread |
foreign exchange |
long |
-1.70% |
|
12/11/15 |
(MSFT) 1/$50-$52.50 call spread |
equity |
long |
0.48% |
|
12/11/15 |
(JPM) 1/$60-$65 call spread |
equity |
long |
-1.51% |
|
12/11/15 |
(BAC) 1/$15-$16 call spread |
equity |
long |
-0.46% |
|
12/14/15 |
(FXE) 1/$108-$111 put spread |
foreign exchange |
long |
-1.99% |
|
12/15/15 |
(XIV) Short Volatility ETF |
equity |
long |
0.58% |
![John Thomas - Beach]() What a Year!
What a Year!

![Bear Crossing]() Looks Like We?re In New Territory
Looks Like We?re In New Territory

While the Diary of a Mad Hedge Fund Trader focuses on investment over a one week to six-month time frame, Mad Day Trader, provided by Bill Davis, will exploit money-making opportunities over a brief ten minute to three day window. It is ideally suited for day traders, but can also be used by long-term investors to improve market timing for entry and exit points. Read more
While the Diary of a Mad Hedge Fund Trader focuses on investment over a one week to six-month time frame, Mad Day Trader, provided by Bill Davis, will exploit money-making opportunities over a brief ten minute to three day window. It is ideally suited for day traders, but can also be used by long-term investors to improve market timing for entry and exit points. Read more
While the Diary of a Mad Hedge Fund Trader focuses on investment over a one week to six-month time frame, Mad Day Trader, provided by Bill Davis, will exploit money-making opportunities over a brief ten minute to three day window. It is ideally suited for day traders, but can also be used by long-term investors to improve market timing for entry and exit points. Read more
Global Market Comments
January 26, 2016
Fiat Lux
Featured Trade:
(THE COMING BULL MARKET IN GOLD),
(GLD), (GDX), (ABX)
(WILL GOLD COINS SUFFER THE FATE OF THE $10,000 BILL), (GLD),
(THE PRICE OF STARDOM AT DAVOS)
SPDR Gold Shares (GLD)
Market Vectors Gold Miners ETF (GDX)
Barrick Gold Corporation (ABX)