When John identifies a strategic exit point, he will send you an alert with specific trade information as to what security to sell, when to sell it, and at what price. Most often, it will be to TAKE PROFITS, but, on rare occasions, it will be to exercise a STOP LOSS at a predetermined price to adhere to strict risk management discipline.Read more
https://www.madhedgefundtrader.com/wp-content/uploads/2016/02/Alert-e1457452190575.jpg135150Mad Hedge Fund Traderhttps://madhedgefundtrader.com/wp-content/uploads/2019/05/cropped-mad-hedge-logo-transparent-192x192_f9578834168ba24df3eb53916a12c882.pngMad Hedge Fund Trader2022-01-28 11:09:192022-01-28 11:09:19Trade Alert - (TSLA) January 28, 2022 - BUY
When John identifies a strategic exit point, he will send you an alert with specific trade information as to what security to sell, when to sell it, and at what price. Most often, it will be to TAKE PROFITS, but, on rare occasions, it will be to exercise a STOP LOSS at a predetermined price to adhere to strict risk management discipline.Read more
https://www.madhedgefundtrader.com/wp-content/uploads/2016/02/Alert-e1457452190575.jpg135150Mad Hedge Fund Traderhttps://madhedgefundtrader.com/wp-content/uploads/2019/05/cropped-mad-hedge-logo-transparent-192x192_f9578834168ba24df3eb53916a12c882.pngMad Hedge Fund Trader2022-01-28 10:08:032022-01-28 10:10:37Trade Alert - (AAPL) January 28, 2022 - SELL-TAKE PROFITS
One of the benefits of subscribing to the Diary of a Mad Hedge Fund Trader is that you get a daily accounting of the recommendation we have made, marked to market at the close of each day.
The goal is to make you feel like an actual hedge fund trader yourself, which means being held to strict accounting guidelines and principles as well as the harsh disciplines of the market.
It also shows you where your risk is and how well your hedges are working. At the end of the day, it distills your efforts down to a few single numbers: how well are you doing on the day, month, and year.
To access the most recent daily position sheet, login into your account here, click on My Account, click on the blue Current Positions box, and click on the download in excel (XLSX) blue hyperlink. You will find the positions spreadsheet in your “downloads” folder.
To access the subject of today’s detailed explanation of the January 27, 2022 position sheet, please click here and download the spreadsheet.
This spreadsheet is an update and a simplified version of the accounting software I wrote to monitor the performance of my own hedge fund during the 1990s. It has truly ancient origins, but it works.
All the key performance numbers are at the top of the “F” column.
F9 – Performance since the onset of the Trade Alert Service since 2010
F13 – Current Year to Date Performance
F11 – Month to Date Performance
Next, you want to look at the top of column “A” which shows the Mad Hedge Fund Trader Model Trading Book Asset Class Breakdown on a Risk-Adjusted Basis.
In column “A”, you will find individual positions like the (TLT) 2/$149-$152 put spread and in column “B” you will find the portfolio weighting of that position of 10%.
Lower down in column “B” you will find position totals. Long positions are shown in positive numbers and short positions in negative numbers.
The Total Net Position in cell B31, the sum of the positive and negative numbers above and indicates my net market exposure.
Total Aggregate Position is the sum of all positions long and short and lets me know how close I’m getting to a 100% invested position. When markets are doing nothing, I rarely go over 50% invested. During extreme selloffs, I go 100% long. During extreme bubble tops, I go 100% short.
The pie chart shows the size of each position relative to the total.
I divide positions into “Risk On”, or the world is getting better, and “Risk Off”, or the world is getting worse.
The goal is to run a balanced portfolio where “Risk On” and “Risk Off” positions are always balanced and provide a net market position of zero. This is the “hedge” in Mad Hedge Fund Trader and greatly increases your performance while reducing portfolio volatility.
Sometimes, it is not possible to run balanced risk portfolios. This happened during the March 2020 market pandemic meltdown when stocks fell almost every day. Then I ran one-sided “Risk Off” positions. During the enormous rally that followed, I ran 100% only “Risk On” portfolios.
In fact, while the market nearly doubled during 2020-2021, I ran 100% long-only portfolios four times.
And here’s a spanner in the works. Sometimes, asset classes change character and flip from being “Risk On” to “Risk Off” and visa versa. A classic example is when both bonds and stocks go up at the same time. This is theoretically impossible but happens nonetheless, usually when there are abundant liquidity and low-interest rates.
If you don’t adjust your risk models to reflect what is actually happening in the market, you are facing an early and impoverished retirement.
Scroll down to lines 45 and 46 and you will find the details of the matched pair of positions that make up the (TLT) 2/$149-$152 vertical bear put spread.
Column “A” shows the Date Opened
Column “B” shows the Date Closed after we sell or let the position expire
Column “C” shows the security position with ticker symbol, maturity, and strike prices.
Column “D” shows the Asset Class (equity, bonds, precious metals, etc.)
Column “E” shows whether we are “Long/Short” that security.
Column “F” shows the Underlying Stop Loss of the position. If the share price falls below that position, sell it as soon as possible to limit your loss. When stocks go against you, the math on options spreads turns against you very quickly.
Column “G” shows the “Notional Cost” of the position.
Column “H” shows the “Current Market Price” of the position.
Column “I” shows the “Profit & Loss” for the position.
Column “J” shows the “Net Profit” of the two combined positions that make up the option spread.
Column “K” shows the “Portfolio Weighting” of the position.
Column “L” shows the “Leverage” on that position. 100% means no leverage is used.
Column “M” shows “Portfolio Net Exposure” which is another way of showing position size.
Columns “N” and “O” you can skip as we are not using them in our current strategy.
Column “P” shows the “Number of Contracts” for each position.
Go down to Line 77 and you will find the profit & loss for every position we have closed since January 1, 2022. We have the data going back to 2010 on another spreadsheet. Keeping all the data on one sheet made it too slow as there were tens of thousands of formulae.
I hope you find all of this useful. Please feel free to alter the spreadsheet to meet your needs once you have downloaded it.
Good luck and good trading.
John Thomas
CEO & Publisher
The Diary of a Mad Hege Fund Trader
https://madhedgefundtrader.com/wp-content/uploads/2019/05/cropped-mad-hedge-logo-transparent-192x192_f9578834168ba24df3eb53916a12c882.png00Mad Hedge Fund Traderhttps://madhedgefundtrader.com/wp-content/uploads/2019/05/cropped-mad-hedge-logo-transparent-192x192_f9578834168ba24df3eb53916a12c882.pngMad Hedge Fund Trader2022-01-28 09:02:592022-01-28 11:56:39Guide to the Mad Hedge Daily Position Sheet
What I’m about to share with you isn’t the most pleasant news, but it’s the truth.
You need to prepare for a stock market crash or a steep correction in the near future.
Since the early 1950s, the S&P 500 benchmark has experienced a total of 38 double-digit percentage declines.
While Wall Street doesn’t necessarily follow these trends, it’s vital to understand and accept that crashes and corrections will always be staples of the investing cycle.
On the flip side, these kinds of dips in the market also offer remarkable opportunities to buy high-quality businesses at a discount.
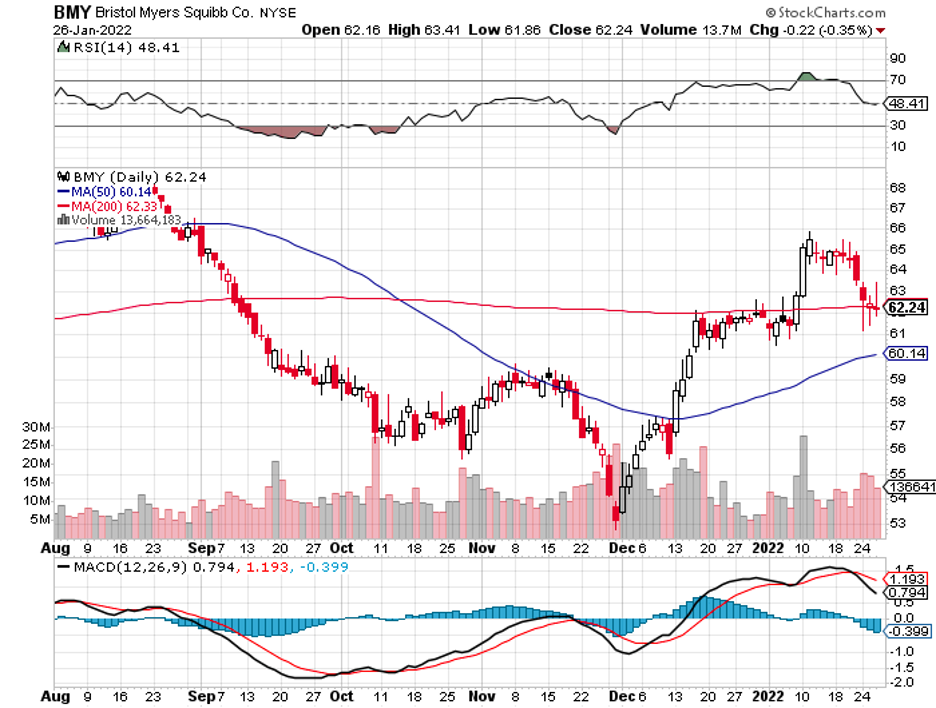
One of the wisest decisions you can make if the stock market does crash soon is to pick up shares of biopharmaceutical company Bristol Myers Squibb (BMY).
The allure of most healthcare and biotechnology stocks is that they make for good defensive investments.
We can never really fully control or even predict when we’ll get sick or what kinds of diseases we’ll develop.
That means that the volatility of the stock market or even the broader economy tends to have minimal effect on the demand for prescription treatments, medical devices, and healthcare plans.
This type of assurance offers a steady cash flow to the likes of BMY.
However, the healthcare industry continues to evolve. That also requires adjustments from companies regardless of their size and history.
Recently, there have been talks of BMY acquiring Seagen (SGEN), with investors hoping this could lead to an added revenue stream. After all, company executives have been hinting at plans to do some “shopping” this year.
While BMY has never shied away from massive acquisitions, it looks like it plans to expand its portfolio more conservatively as opposed to making splashy deals.
The latest move from BMY towards that direction is its licensing agreement with Century Therapeutics (IPSC).
According to the agreement, BMY will pay Century $100 million upfront and invest an additional $50 million to gain access to four of the smaller company’s off-the-shelf cancer therapies.
Potentially, Century could receive up to $3 billion from BMY in milestone payments on top of double-digit royalties.
Although not a splurge by any means, this deal would actually be an excellent addition to BMY’s cell therapy portfolio.
One potential treatment that would benefit from this licensing agreement is lymphoma therapy Breyanzi, which is estimated to get a list price of $410,000 and peak sales of roughly $3 billion.
Another is multiple myeloma treatment Abeam, which is expected to be listed at $419,500 and reach peak sales of approximately $1 billion.
Besides being a top-quality defensive play, BMY is excelling at taking advantage of its plan to combine organic with acquisition-based expansions.
In terms of organic growth, a good example is its blood-thinning treatment Eliquis, which BMY developed with Pfizer (PFE). In 2021, this drug raked in an impressive $10 billion in sales.
Another example is its cancer treatment Opdivo, which contributed $7 billion in 2020 and holds the potential to exceed $10 billion in annual sales given the continuous expansion of its applications.
In terms of acquisitions, BMY’s last huge acquisitions are the $13.1 billion deal with MyoKardia and, of course, the jaw-dropping $74 billion agreement with Celgene.
Looking at how the acquisitions helped BMY, saying that the company landed a whale when it acquired Celgene is an understatement.
Considering that Celgene’s Revlimid is the highest-grossing drug in BMY’s portfolio today, it’s apparent that these deals have proven to be a fast, albeit costly, strategy to guarantee that the company will continue to hold a diverse lineup of proven products with the capacity to provide consistent revenues and boost R&D.
Since that 2019 deal, the company has enjoyed the perks of Celgene’s blockbuster drugs like Revlimid, which has a proven track record of double-digit growth in annual sales and has recorded $15 billion in yearly revenue.
More importantly, Revlimid is protected from generics until 2026, offering BMY a lot of elbow room to take more advantage of the cash flow coming from this drug
Celgene has also provided an extremely valuable lineup of pipeline assets, apart from its blockbusters.
For instance, beta-thalassemia treatment Reblozyl holds the potential to bring in $2 to $4 billion in annual sales, while autoimmune medication Zeposia is projected to add $3 billion in yearly sales.
To date, it’s clear to see that BMY welcomed 2022 with promising momentum, and the healthcare stock should be anticipated to perform well in the first six months of the year.
Given its track record and projected trajectory, it won’t come as a surprise if this blue-chip stock soars above its competition this year.
https://madhedgefundtrader.com/wp-content/uploads/2019/05/cropped-mad-hedge-logo-transparent-192x192_f9578834168ba24df3eb53916a12c882.png00Mad Hedge Fund Traderhttps://madhedgefundtrader.com/wp-content/uploads/2019/05/cropped-mad-hedge-logo-transparent-192x192_f9578834168ba24df3eb53916a12c882.pngMad Hedge Fund Trader2022-01-27 17:00:152022-01-30 00:49:44A Blue-Chip Stock Poised for More Growth
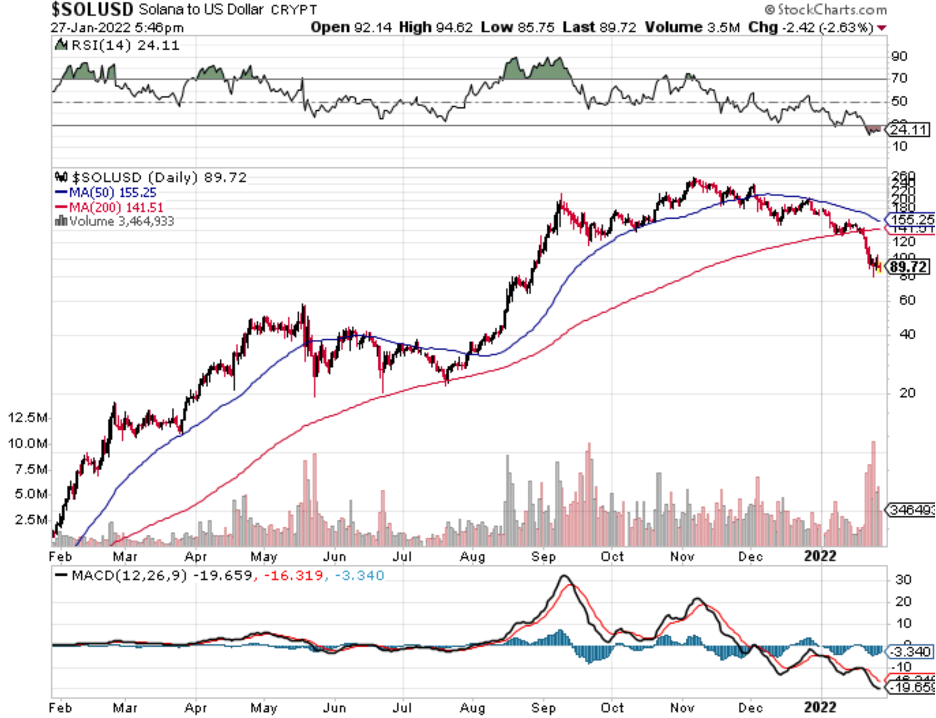
The eighth biggest crypto by market cap and once hyped to the stars, Solana’s (SOL) repeated run-ins with bots, outages, and frustrated traders during the recent market crash could turn off many potential investors.
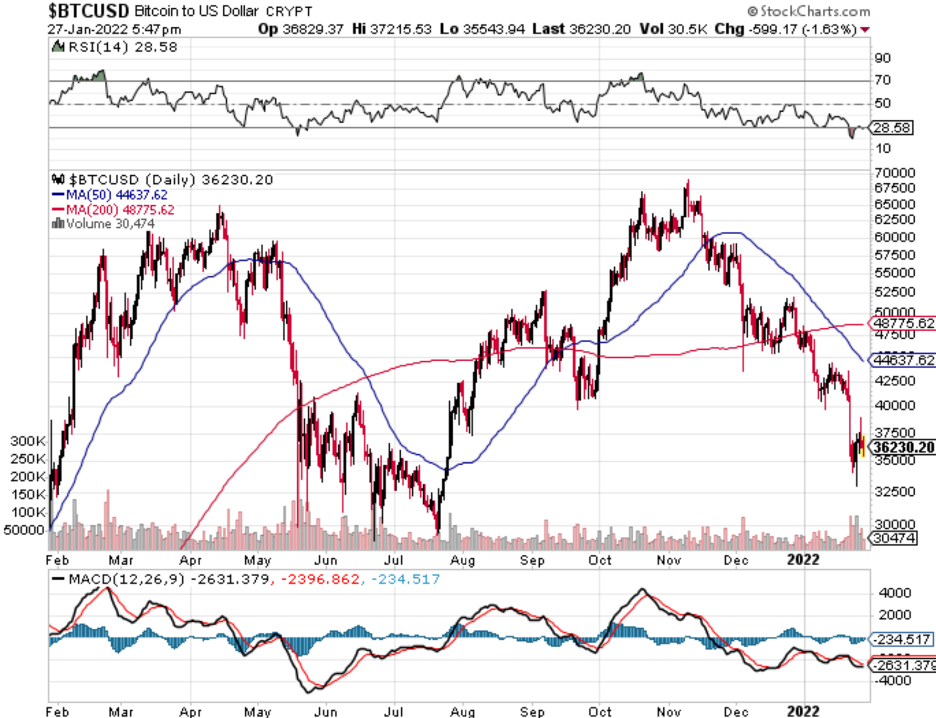
Emerging crypto are suffering more than Bitcoin (BTC) and Ethereum (ETH) in the recent selloff while Bitcoin is down 50% over this period, many of these smaller cryptos are down 50% in a week.
Then adding gas on the fire, structural bottlenecks have arisen.
Solano suffered its sixth serious outage of more than eight hours this month over the weekend, which a notice on its website attributed to excessive duplicate transactions causing a high level of network congestion.
It’s not shocking that these smaller networks can’t handle the trade flow.
Many are cobbled together on a shoestring budget.
Solana Labs co-founder Anatoly Yakovenko also pointed to an explanation on Twitter that cited market volatility as causing downtime, as bots rushed to earn bounties on leveraged positions eligible for liquidation.
Citing volatility as to why your product is down is an excuse because other networks were going through the same headwinds and managed gracefully.
A 10% decline in the Nasdaq won’t shut it down and this doesn’t help the naysayers who say that crypto is a bush-league operation.
To an extent, many of the smaller currencies are amateur and heightened volatility in an ecosystem that is already flooded with high volatility cannot be used as a reason for failure.
To not be able to absorb the volatility in stride augurs poorly for Solano and I would tell investors to avoid these crypto’s who can’t crack the top 5 or can’t stay online!
There will be growing pains and avoid them until they can figure out how to run a platform.
During these periods of network instability, crypto traders are often left unable to sell off their positions as transactions fail to complete on Solana’s network, yet another sign of how unreliable this emerging technology can be during times of stress.
When combined with a market-wide crash in crypto prices, investors rushed to offload their tokens are left to figure out other routes while their portfolios rapidly decline.
Remember that these networks don’t have a customer service number and you are sitting in your office chair pondering how to get access to your assets.
That’s exactly what you don’t want your investors to feel.
The founders of the currency attributed the structural issues to a “function of Solana’s success.”
However, I would say that the inability to anticipate higher data loads during selloffs doesn’t help these non-Bitcoin currencies.
Bitcoin certainly didn’t have problems handling the recent volatility.
Having so many transactions meaning it’s an attractive platform for developers and users isn’t the right way to look at it, because a certain level of functionality needs to happen otherwise this attractiveness reverses into a minus.
The bodes poorly for Solano to combat future problems because of the lack of vision at the management level.
An all-time peak of $259 recorded in November represented growth of almost 14,000% since the start of 2021—but following its continued issues, Solano retraced 4,800%.
Rival coins promising to reinvent the capabilities of blockchain technology are also targeting Solano. The value of Terraform Labs’ Luna token, which runs on the Terra protocol for algorithmic, fiat-pegged stable coins, has skyrocketed in the last year, rising more than 7,000% in value over the last 12 months.
I believe we will shortly see Solano developer activity and transaction activity significantly slowing with another haircut in price.
I don’t believe now is the time to call for a crypto “winter.”
Once crypto can elbow through a higher rate paradigm and that becomes priced into the asset class, the debasement of currency among other factors will take crypto higher.
https://madhedgefundtrader.com/wp-content/uploads/2019/05/cropped-mad-hedge-logo-transparent-192x192_f9578834168ba24df3eb53916a12c882.png00Mad Hedge Fund Traderhttps://madhedgefundtrader.com/wp-content/uploads/2019/05/cropped-mad-hedge-logo-transparent-192x192_f9578834168ba24df3eb53916a12c882.pngMad Hedge Fund Trader2022-01-27 16:02:162022-01-27 17:38:20Avoid Solana Like the Plague
“We have to stop optimizing for programmers and start optimizing for users.” – Said American Programmer Jeff Atwood
https://www.madhedgefundtrader.com/wp-content/uploads/2022/01/jeff-atwood.png516368Mad Hedge Fund Traderhttps://madhedgefundtrader.com/wp-content/uploads/2019/05/cropped-mad-hedge-logo-transparent-192x192_f9578834168ba24df3eb53916a12c882.pngMad Hedge Fund Trader2022-01-27 16:00:122022-01-27 17:37:11Quote of the Day - January 27, 2022
When John identifies a strategic exit point, he will send you an alert with specific trade information as to what security to sell, when to sell it, and at what price. Most often, it will be to TAKE PROFITS, but, on rare occasions, it will be to exercise a STOP LOSS at a predetermined price to adhere to strict risk management discipline.Read more
https://www.madhedgefundtrader.com/wp-content/uploads/2016/02/Alert-e1457452190575.jpg135150Mad Hedge Fund Traderhttps://madhedgefundtrader.com/wp-content/uploads/2019/05/cropped-mad-hedge-logo-transparent-192x192_f9578834168ba24df3eb53916a12c882.pngMad Hedge Fund Trader2022-01-27 12:18:232022-01-27 12:18:23Trade Alert - (SPY) January 27, 2022 - BUY
Legal Disclaimer
There is a very high degree of risk involved in trading. Past results are not indicative of future returns. MadHedgeFundTrader.com and all individuals affiliated with this site assume no responsibilities for your trading and investment results. The indicators, strategies, columns, articles and all other features are for educational purposes only and should not be construed as investment advice. Information for futures trading observations are obtained from sources believed to be reliable, but we do not warrant its completeness or accuracy, or warrant any results from the use of the information. Your use of the trading observations is entirely at your own risk and it is your sole responsibility to evaluate the accuracy, completeness and usefulness of the information. You must assess the risk of any trade with your broker and make your own independent decisions regarding any securities mentioned herein. Affiliates of MadHedgeFundTrader.com may have a position or effect transactions in the securities described herein (or options thereon) and/or otherwise employ trading strategies that may be consistent or inconsistent with the provided strategies.