When John identifies a strategic exit point, he will send you an alert with specific trade information on what security to sell, when to sell it, and at what price. Most often, it will be to TAKE PROFITS, but, on rare occasions, it will be to exercise a STOP LOSS at a predetermined price to adhere to strict risk management discipline.Read more
https://www.madhedgefundtrader.com/wp-content/uploads/2016/02/Alert-e1457452190575.jpg135150april@madhedgefundtrader.comhttps://madhedgefundtrader.com/wp-content/uploads/2019/05/cropped-mad-hedge-logo-transparent-192x192_f9578834168ba24df3eb53916a12c882.pngapril@madhedgefundtrader.com2025-05-06 10:39:162025-05-06 10:39:16Trade Alert - (SPY) May 6, 2025 - STOP LOSS - SELL
If demographics are destiny, then America’s future looks bleak. You see, they’re just not making Americans anymore.
At least that is the sobering conclusion of the latest Economist magazine survey of the global demographic picture.
I have long been a fan of demographic investing, which creates opportunities for traders to execute on what I call “intergenerational arbitrage”.When the number of middle-aged big spenders is falling, risk markets plunge.
Front run this data by two decades, and you have a great predictor of stock market tops and bottoms that outperforms most investment industry strategists.
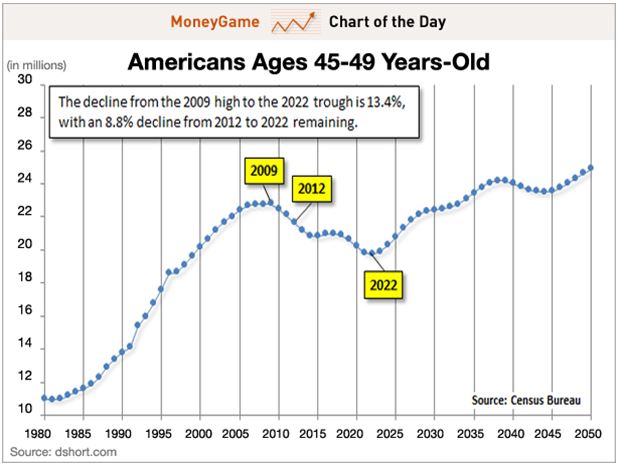
You can distill this even further by calculating the percentage of the population that is in the 45-49 age bracket.
The reasons for this are quite simple. The last five years of child rearing are the most expensive. Think of all that pricey sports equipment, tutoring, braces, SAT coaching, first cars, first car wrecks, and the higher insurance rates that go with it.
Older kids need more running room, which demands larger houses with more amenities. No wonder it seems that dad is writing a check or whipping out a credit card every five seconds. I know, because I have five kids of my own. As long as dad is in spending mode, stock and real estate prices rise handsomely, as do most other asset classes. Dad, you’re basically one generous ATM.
As soon as kids flee the nest, this spending grinds to a juddering halt. Adults entering their fifties cut back spending dramatically and become prolific savers. Empty nesters also start downsizing their housing requirements, unwilling to pay for those empty bedrooms, which in effect, become expensive storage facilities.
This is highly deflationary and causes a substantial slowdown in GDP growth.That is why the stock and real estate markets began their slide in 2007, while it was off to the races for the Treasury bond market.
The data for the US is not looking so hot right now. Americans aged 45-49 peaked in 2009 at 23% of the population. According to US census data, this group then began a 13-year decline to only 19% by 2022.
You can take this strategy and apply it globally with terrific results. Not only do these spending patterns apply globally, but they also backtest with a high degree of accuracy. Simply determine when the 45-49 age bracket is peaking for every country, and you can develop a highly reliable timetable for when and where to invest.
Instead of poring through gigabytes of government census data to cherry-pick investment opportunities, my friends at HSBC Global Research, strategists Daniel Grosvenor and Gary Evans, have already done the work for you. They have developed a table ranking investable countries based on when the 34-54 age group peaks—a far larger set of parameters that captures generational changes.
The numbers explain a lot of what is going on in the world today. I have reproduced it below. From it, I have drawn the following conclusions:
* The US (SPY) peaked in 2001 when our first “lost decade” began.
*Japan (EWJ) peaked in 1990, heralding 32 years of falling asset prices, giving you a nice back test.
*Much of developed Europe, including Switzerland (EWL), the UK (EWU), and Germany (EWG), followed in the late 2,000’s, and the current sovereign debt debacle started shortly thereafter.
*South Korea (EWY), an important G-20 “emerged” market with the world’s lowest birth rate, peaked in 2010.
*China (FXI) topped in 2011, explaining why we have seen three years of dreadful stock market performance despite torrid economic growth. It has been our consumers driving their GDP, not theirs.
*The “PIIGS” countries of Portugal, Ireland (EIRL), Greece (GREK), and Spain (EWP) don’t peak until the end of this decade. That means you could see some ballistic stock market performances if the debt debacle is dealt with in the near future.
*The outlook for other emerging markets, like Indonesia (IDX), Poland (EPOL), Turkey (TUR), Brazil (EWZ), and India (PIN) is quite good, with spending by the middle-aged not peaking for 15-33 years.
*Which country will have the biggest demographic push for the next 38 years? Israel (EIS), which will not see consumer spending max out until 2050. Better start stocking up on things Israelis buy.
Like all models, this one is not perfect, as its predictions can get derailed by a number of extraneous factors. Rapidly lengthening life spans could redefine “middle age”. Personally, I’m hoping 72 is the new 42.
Emigration could starve some countries of young workers (like Japan), while adding them to others (like Australia). Foreign capital flows in a globalized world can accelerate or slow down demographic trends. The new “RISK ON/RISK OFF” cycle can also have a clouding effect.
So why am I so bullish now? Because demographics is just one tool in the cabinet. Dozens of other economic, social, and political factors drive the financial markets.
What is the most important demographic conclusion right now? That the US demographic headwind veered to a tailwind in 2022, setting the stage for the return of the “Roaring Twenties.” With the (SPY) up 27% since October, it appears the markets heartily agree.
While the growth rate of the American population is dramatically shrinking, the rate of migration is accelerating, with huge economic consequences. The 80-year-old trend of population moving from North to South to save on energy bills is picking up speed, and the Midwest is getting hollowed out at an astounding rate as its people flee to the coasts, all three of them.
As a result, California, Texas, Florida, Washington, and Oregon are gaining population, while Missouri, Iowa, Nebraska, Kansas, and Wyoming are losing it (see map below). During my lifetime, the population of California has rocketed from 10 million to 40 million. People come in poor and leave as billionaires, as Elon Musk did.
In the meantime, I’m going to be checking out the shares of the matzo manufacturer down the street.
https://www.madhedgefundtrader.com/wp-content/uploads/2013/11/Matzos.jpg327321april@madhedgefundtrader.comhttps://madhedgefundtrader.com/wp-content/uploads/2019/05/cropped-mad-hedge-logo-transparent-192x192_f9578834168ba24df3eb53916a12c882.pngapril@madhedgefundtrader.com2025-05-06 09:02:112025-05-06 12:54:32They’re Not Making Americans Anymore
“This could be the beginning of the end of the bond market,” said my friend, the legendary hedge fund manager, David Tepper.
https://www.madhedgefundtrader.com/wp-content/uploads/2019/03/John-Thomas-David-Tepper-300x236_dda4ca660c28c36d61141ba2e1b933b0.jpg236300april@madhedgefundtrader.comhttps://madhedgefundtrader.com/wp-content/uploads/2019/05/cropped-mad-hedge-logo-transparent-192x192_f9578834168ba24df3eb53916a12c882.pngapril@madhedgefundtrader.com2025-05-06 09:00:242025-05-06 12:51:38May 6, 2025 - Quote of the Day
For generations, securing a loan, particularly a mortgage, has been synonymous with lengthy delays, mountains of paperwork, and nerve-wracking uncertainty. Borrowers traditionally faced weeks, sometimes even months, navigating a complex process involving manual data entry, extensive document checks, and subjective underwriting decisions. But this cumbersome reality is rapidly fading as Artificial Intelligence (AI) injects unprecedented speed and efficiency into the lending world, compressing approval timelines from weeks into mere minutes and fundamentally reshaping how credit is accessed and granted.
The Drudgery of Traditional Lending
The traditional loan approval process was notoriously slow and fraught with potential bottlenecks. It began with applicants submitting piles of documents – pay stubs, tax returns, bank statements, and identification. Loan officers or processors then manually sifted through this information, painstakingly entering data into disparate systems. This stage alone was ripe for errors and delays.
Next came verification, requiring cross-checking submitted details against various sources, often involving phone calls or further documentation requests. The core of the process, underwriting, relied heavily on human judgment to assess creditworthiness based primarily on credit scores, income, and debt-to-income ratios. While experienced underwriters brought valuable expertise, this stage could be subjective, prone to unconscious bias, and time-consuming, especially during peak application periods. For borrowers needing swift financial decisions, whether for a home purchase, a small business expansion, or an emergency, these protracted timelines often led to missed opportunities and significant stress. Industry estimates suggest closing a mortgage in the U.S. traditionally took anywhere from 30 to 60 days – a lifetime in today's fast-paced digital economy.
AI Steps In: The Mechanics of Accelerated Approvals
Artificial intelligence, particularly machine learning (ML) and associated technologies like Natural Language Processing (NLP) and Optical Character Recognition (OCR), tackles these traditional bottlenecks head-on.
Automated Data Handling: AI-powered systems, often referred to as Intelligent Document Processing (IDP) solutions, instantly scan and digitize application documents, regardless of format (PDFs, scans, even handwritten notes). Tools like those offered by Ocrolus, Artsyl, and others use OCR to extract key data points – income, employment details, account balances – and NLP to understand context. This eliminates manual data entry, drastically reducing errors and freeing up human staff. Research suggests IDP can cut document processing times by as much as 70%.
Advanced Risk Assessment: AI moves beyond static credit scores. Machine learning models analyze vast datasets, incorporating not just traditional credit bureau information but also alternative data like real-time spending patterns, utility payment histories, rental payment records, and even cash flow trends from linked bank accounts. This provides a more dynamic and holistic view of an applicant's financial health and repayment capacity. AI can assess risk factors, predict the likelihood of default with greater accuracy, and perform complex calculations like debt-to-income ratios instantly. Companies like Zest AI and Scienaptic specialize in creating fairer, more accurate AI-driven underwriting models. This data-driven approach allows lenders to make more informed decisions, potentially approving applicants who might have been overlooked by traditional methods relying solely on limited credit history.
Streamlined Workflows and Real-Time Decisions: AI automates the entire workflow. Once data is extracted and analyzed, AI agents can automatically route applications, perform automated compliance checks against fair lending laws (like the Equal Credit Opportunity Act - ECOA) and internal policies, and flag inconsistencies or potential fraud with remarkable speed. For straightforward, low-risk applications, AI can render an approval or denial decision in minutes or seconds without human intervention. For more complex cases or high-value loans, AI provides recommendations and flags specific areas for human underwriters to review, creating an efficient "human-in-the-loop" system that combines AI's speed with human expertise and judgment.
Tangible Results: Efficiency Gains and Market Impact
The impact of AI on lending speed is not merely theoretical. Financial institutions implementing these technologies are reporting significant improvements. FORUM Credit Union, using automated underwriting, estimated it could process up to 70% more loans compared to purely manual methods. Research published on ResearchGate indicated banks using AI-driven document automation saw loan approvals processed 70% faster. Fintech lenders, built from the ground up with AI, often provide decisions almost instantaneously, setting a new standard for customer expectations.
This speed translates into increased capacity, allowing lenders to handle higher volumes without compromising quality or needing to proportionally increase staff. It also accelerates loan funding, a critical advantage in competitive markets like auto loans offered through dealerships.
Beyond Speed: Enhanced Accuracy, Fairness, and Experience
While speed is the most dramatic benefit, AI offers other significant advantages. By minimizing manual data handling, it drastically reduces costly human errors. The ability to analyze diverse datasets, including alternative data, holds the potential to make lending more inclusive, providing access to credit for individuals with "thin" or non-traditional credit files, such as recent immigrants or young adults.
AI also enhances the customer experience. AI-powered chatbots and virtual assistants provide 24/7 support, answering borrower questions instantly and guiding them through the application process. AI can personalize loan offers based on individual profiles and financial situations, providing tailored solutions rather than one-size-fits-all products.
Navigating the Hurdles: Bias, Privacy, and Regulation
Despite its transformative potential, AI implementation in lending faces critical challenges.
Algorithmic Bias: Perhaps the most pressing concern is bias. If AI models are trained on historical data that reflects past discriminatory lending practices, the AI can inadvertently learn and perpetuate those biases, potentially disadvantaging certain demographic groups based on race, ethnicity, or gender. Mitigating this requires conscious effort: using diverse and representative training data, designing algorithms with fairness metrics in mind, conducting regular audits for bias, and employing Explainable AI (XAI) techniques to understand why an AI made a specific decision.
Data Privacy and Security: AI systems process vast amounts of sensitive personal and financial data. Ensuring robust cybersecurity measures, data encryption, strict access controls, and compliance with privacy regulations like GDPR in Europe and CCPA in California is non-negotiable to maintain borrower trust and avoid breaches.
Transparency and Accountability: The "black box" nature of some complex AI models can make it difficult to explain decisions to borrowers, potentially eroding trust and complicating compliance with regulations like the ECOA, which requires lenders to provide specific reasons for adverse actions (like loan denials). Striking a balance between automation and human oversight, especially for denials or complex approvals, remains crucial.
Regulatory Landscape: Financial regulations like the Dodd-Frank Act, Anti-Money Laundering (AML) laws, and fair lending acts impose strict requirements. AI systems must be designed and implemented to comply with these rules, ensuring transparency, auditability, and fairness – a complex task given the evolving nature of both AI and regulations.
Implementation Costs and Integration: Integrating AI into legacy banking systems can be complex and expensive, requiring significant investment in technology infrastructure, data management, and specialized expertise.
The Future is Fast: What's Next for AI in Lending?
Looking ahead to 2025 and beyond, AI's role in lending will only deepen. Trends include hyper-automation, where AI orchestrates end-to-end processes with minimal human touch. Generative AI is poised to further enhance customer interaction through more sophisticated chatbots and to automate the generation of reports and summaries. We may see greater integration with blockchain for enhanced security and transparency in transactions. The focus will continue to be on using AI not just for speed, but for creating highly personalized, seamless, and fair borrowing experiences. Financial institutions, both traditional players and fintech disruptors, recognize that leveraging AI effectively is no longer optional but essential for staying competitive.
Conclusion: A New Era of Lending
Artificial intelligence is irrevocably changing the loan approval process. By automating tasks, analyzing data at scale, and enabling near-instantaneous decisions, AI delivers the speed and efficiency demanded by modern consumers and businesses. While significant challenges around bias, privacy, and regulation must be carefully managed, the benefits are undeniable. The transition from laborious, weeks-long processes to streamlined, minutes-long approvals marks a profound shift, promising a future where accessing credit is faster, potentially fairer, and more accessible than ever before.
https://madhedgefundtrader.com/wp-content/uploads/2019/05/cropped-mad-hedge-logo-transparent-192x192_f9578834168ba24df3eb53916a12c882.png00Douglas Davenporthttps://madhedgefundtrader.com/wp-content/uploads/2019/05/cropped-mad-hedge-logo-transparent-192x192_f9578834168ba24df3eb53916a12c882.pngDouglas Davenport2025-05-05 16:30:062025-05-05 16:30:06The Need for Speed: AI Transforms Loan Approvals from Weeks to Minutes, Reshaping Lending Landscape
A torpedo has just hit the world of digital content.
The cost of digital content is about to skyrocket as Washington D.C., plans to levy a 100% tariff on movies produced outside the states.
Actually, this is one of Hollywood’s dirty little secrets and a big way they cut costs by outsourcing film production to Eastern Europe or Southeast Asia.
Budapest, Hungary, has become a major hub for studios to geoarbitrage production, and a massive studio has sprouted up in this part of Europe.
Millions of expenses have been saved by not making movies in the United States, and so much has been outsourced that the administration has created a new tariff to get the movie business back in the United States.
I would not say this is anything like a national security threat, even to the point that I would say that Hollywood is more or less socially irrelevant in 2025.
However, corporate entertainment content still moves the needle even if people don’t watch it anymore.
It also keeps people employed, and this is a specific attempt to force whoever is making these movies to return to the United States instead of hiring cheaper Hungarians to make our movies.
Imposing a 100% tariff on all films produced abroad that are then sent into the United States will negate most of the cost savings.
A bombshell like this will hurt employment in the industry, causing companies to fire staff much like tech has been doing for the past few years.
Movie and TV production has been exiting Hollywood for years, heading to locations with tax incentives that make filming cheaper.
Governments around the world have increased credits and cash rebates to attract productions and capture a greater share of the $248 billion that will be spent globally in 2025 to produce content.
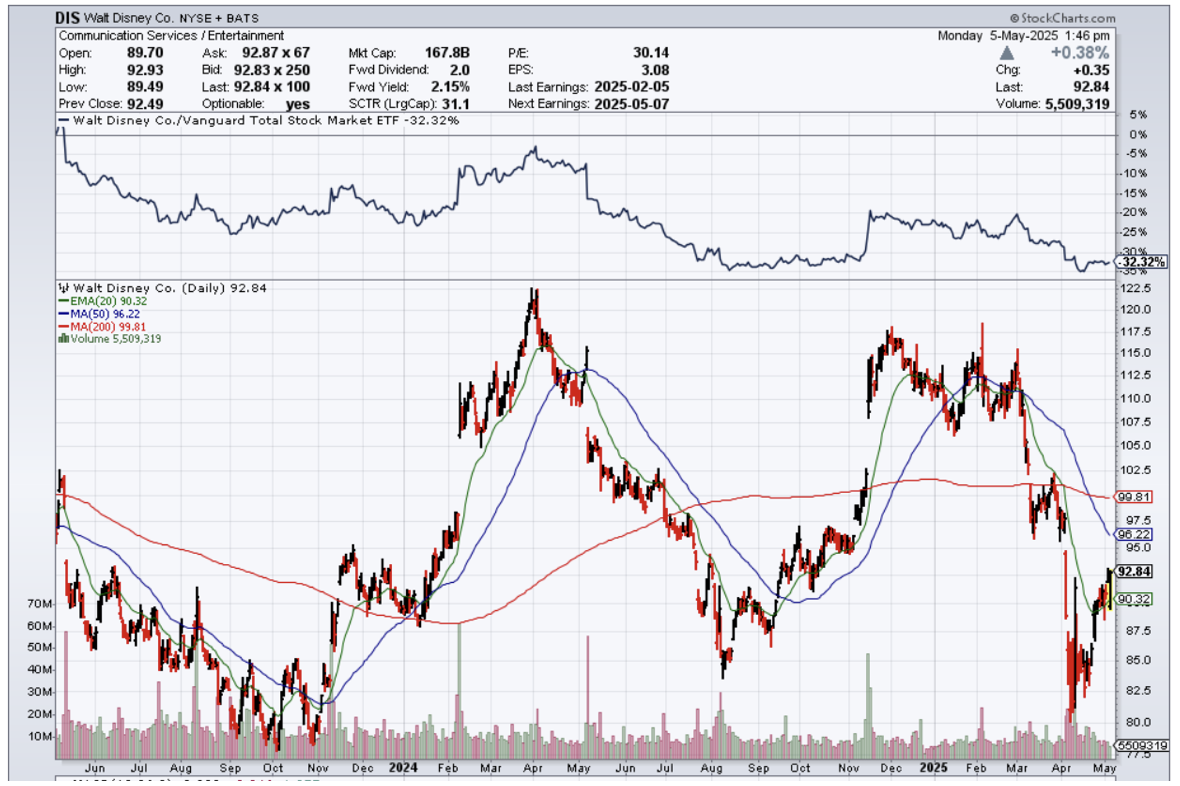
All major media companies, including Walt Disney (DIS), Netflix (NFLX), and Universal Pictures, film overseas to increase profits.
Film and television production has fallen by nearly 40% over the last decade in Hollywood’s home city of Los Angeles, because of the outrageous cost of doing business in the state of California.
The January wildfires accelerated concerns that producers may look outside Los Angeles, and that camera operators, costume designers, sound technicians, and other behind-the-scenes workers may move out of town rather than try to rebuild in their neighborhoods.
Ultimately, this tariff is devastating to digital content.
This is also on the heels of China limiting Hollywood to only 10 movie imports into China per year.
The city of Los Angeles is about to face a rash of job losses as digital content companies will turn to AI to fill out the rest of the production.
Much less content will be made if these large budget productions of over $20 million cannot be outsourced to cheaper global south employees.
In general, the cost of creating digital content will increase and be painful for the average content maker.
Who does this favor?
Those individual YouTubers who go around filming on a selfie stick while simultaneously editing their own content.
Any digital content company masquerading as a global Titanic will need to shrink accordingly and get leaner.
Americans will need to think twice whether to develop production outside of the United States with this new steep cost.
Companies that will be hurt from this are Netflix, Disney, Amazon, and Comcast.
If these executives don’t pay the tariffs, they could even find themselves locked up in Alcatraz.
Who would have thought that a few days ago?
https://madhedgefundtrader.com/wp-content/uploads/2019/05/cropped-mad-hedge-logo-transparent-192x192_f9578834168ba24df3eb53916a12c882.png00april@madhedgefundtrader.comhttps://madhedgefundtrader.com/wp-content/uploads/2019/05/cropped-mad-hedge-logo-transparent-192x192_f9578834168ba24df3eb53916a12c882.pngapril@madhedgefundtrader.com2025-05-05 14:02:112025-05-05 15:18:16Cost Of Digital Content On The Rise
When John identifies a strategic exit point, he will send you an alert with specific trade information as to what security to sell, when to sell it, and at what price. Most often, it will be to TAKE PROFITS, but, on rare occasions, it will be to exercise a STOP LOSS at a predetermined price to adhere to strict risk management discipline.Read more
Earnings:Expedia Group, Insulet, TKO Group Holdings, Paramount Global, Microchip Technology, Akamai Technologies, Warner Bros. Discovery, ConocoPhillips, Tapestry, Molson Coors Beverage, Match Group.
FRIDAY, MAY 9
8:30 a.m. Canada Unemployment Rate
Previous: 6.7%
Forecast: 6.7%
8:30 a.m. New York Federal Reserve Bank President and CEO John Williams speaks on Taylor Rules in Policy, Stanford University.
10:00 a.m. New York Federal Reserve Bank Director of Research and Head of the Statistics Group Kartik Athreya speaks on NY State Large Credit Unions CEO Roundtable.
10:15 a.m. New York Federal Reserve Bank President and CEO John Williams speaks on Reykjavik Economic Conference, Iceland.
All Eyes on The Fed This Week
The Federal Reserve Meeting will be a key focus this week – traders will be awaiting crucial updates on interest rate projections and the Fed’s assessment of the US economy.The Fed is likely to keep interest rates unchanged, but they will likely stress that the economic outlook is uncertain, thanks to tariffs, federal layoffs, & stricter immigration.It will be interesting to see if the US dollar can continue its bounce.
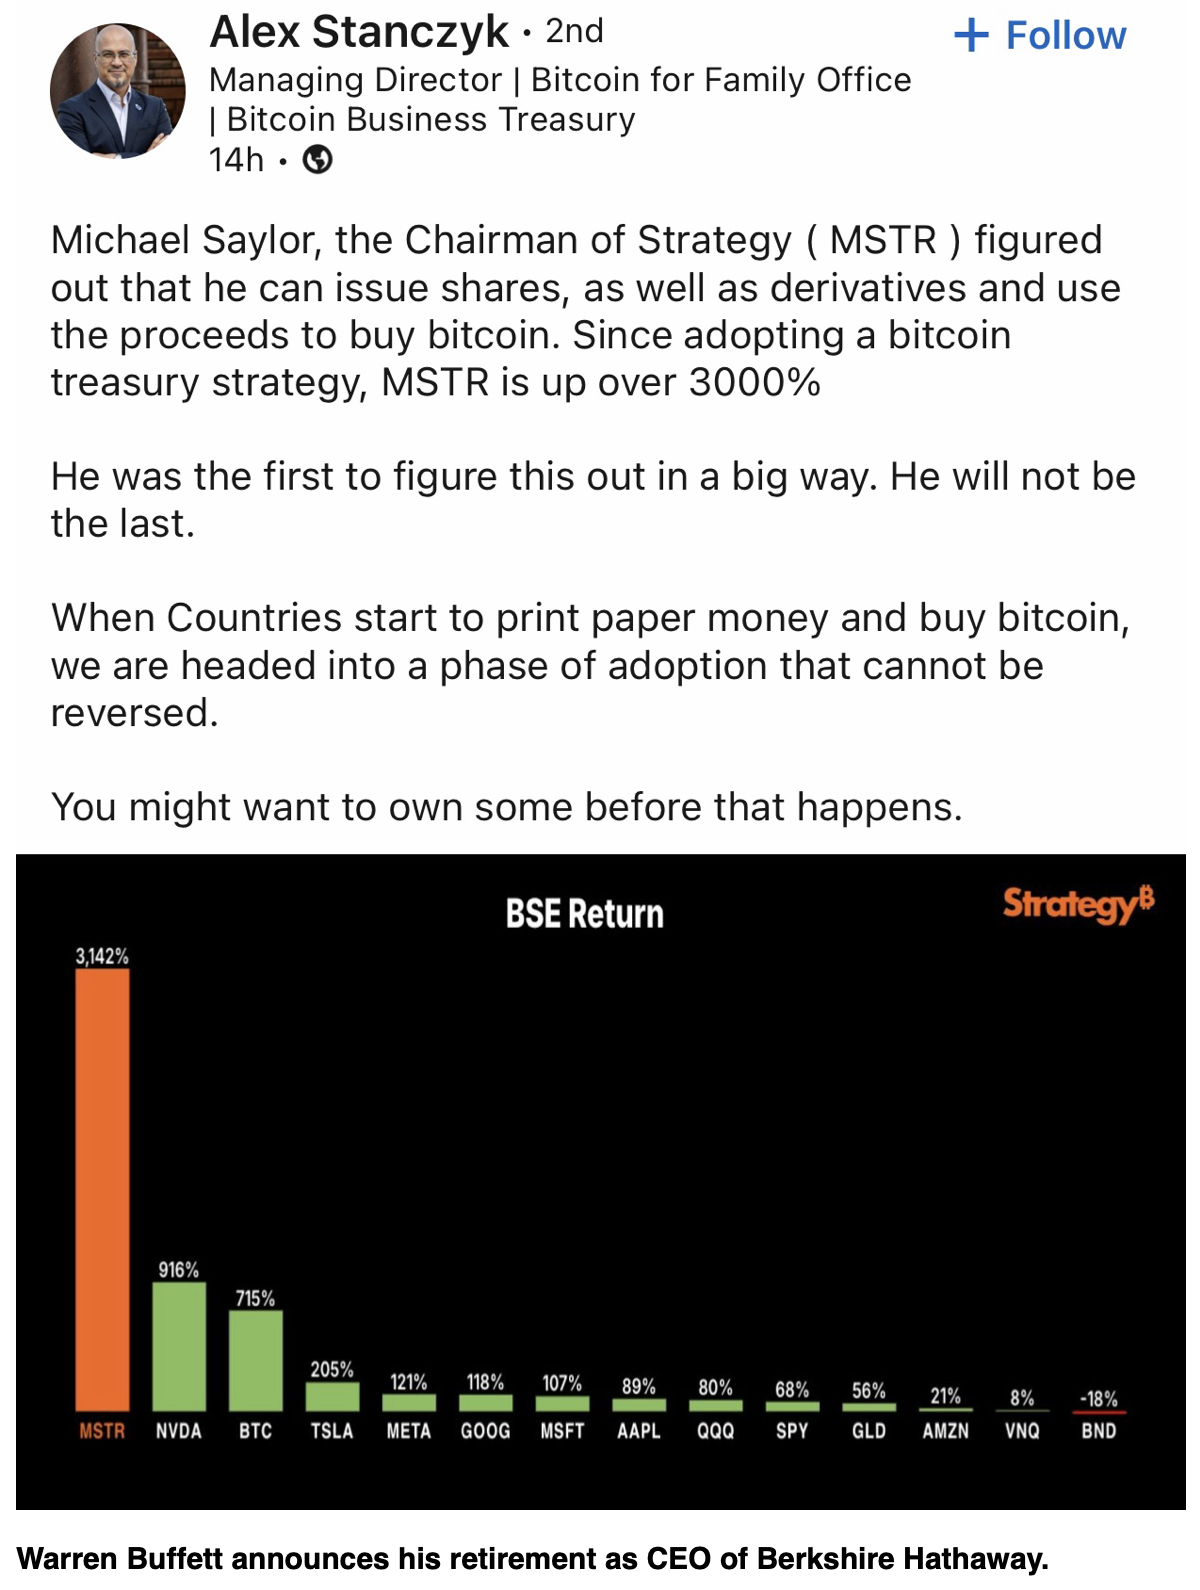
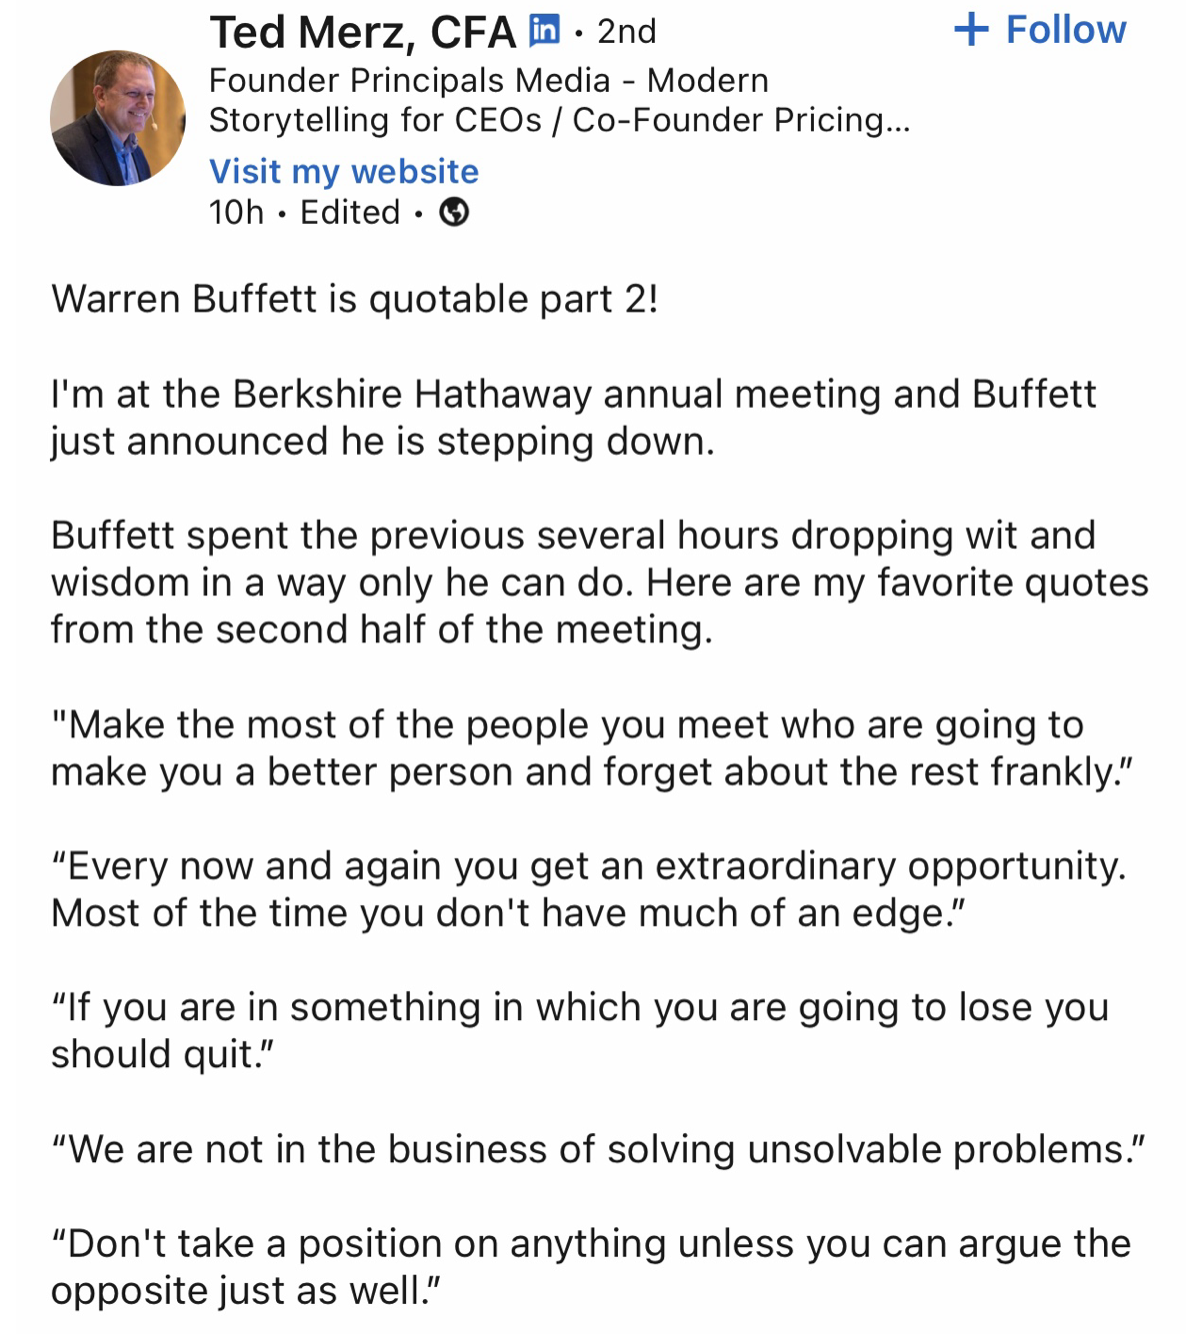
The Average Investor and Warren Buffett – like chalk and cheese
It could be argued that Warren Buffett’s results came from reputation, privilege, access and hard-fought strategic advantage, and not simply buying and holding undervalued stocks.
For most of the last 60 years, Buffett has operated from a position of scale, influence and privilege, that’s completely inaccessible to retail investors.Many of his most lucrative deals weren’t found in the bargain bin of the stock exchange – they were created in private conversations with CEOs, Treasury Secretaries, and Presidents.His returns weren’t solely fuelled by patience, discipline and astute stock selection – they were turbocharged by exclusive deals, regulatory favour and reputation-fuelled access.
So, let’s check out Buffett’s advantages –
Firstly, you and I invest our own money which we need to earn first and then pay taxes on.
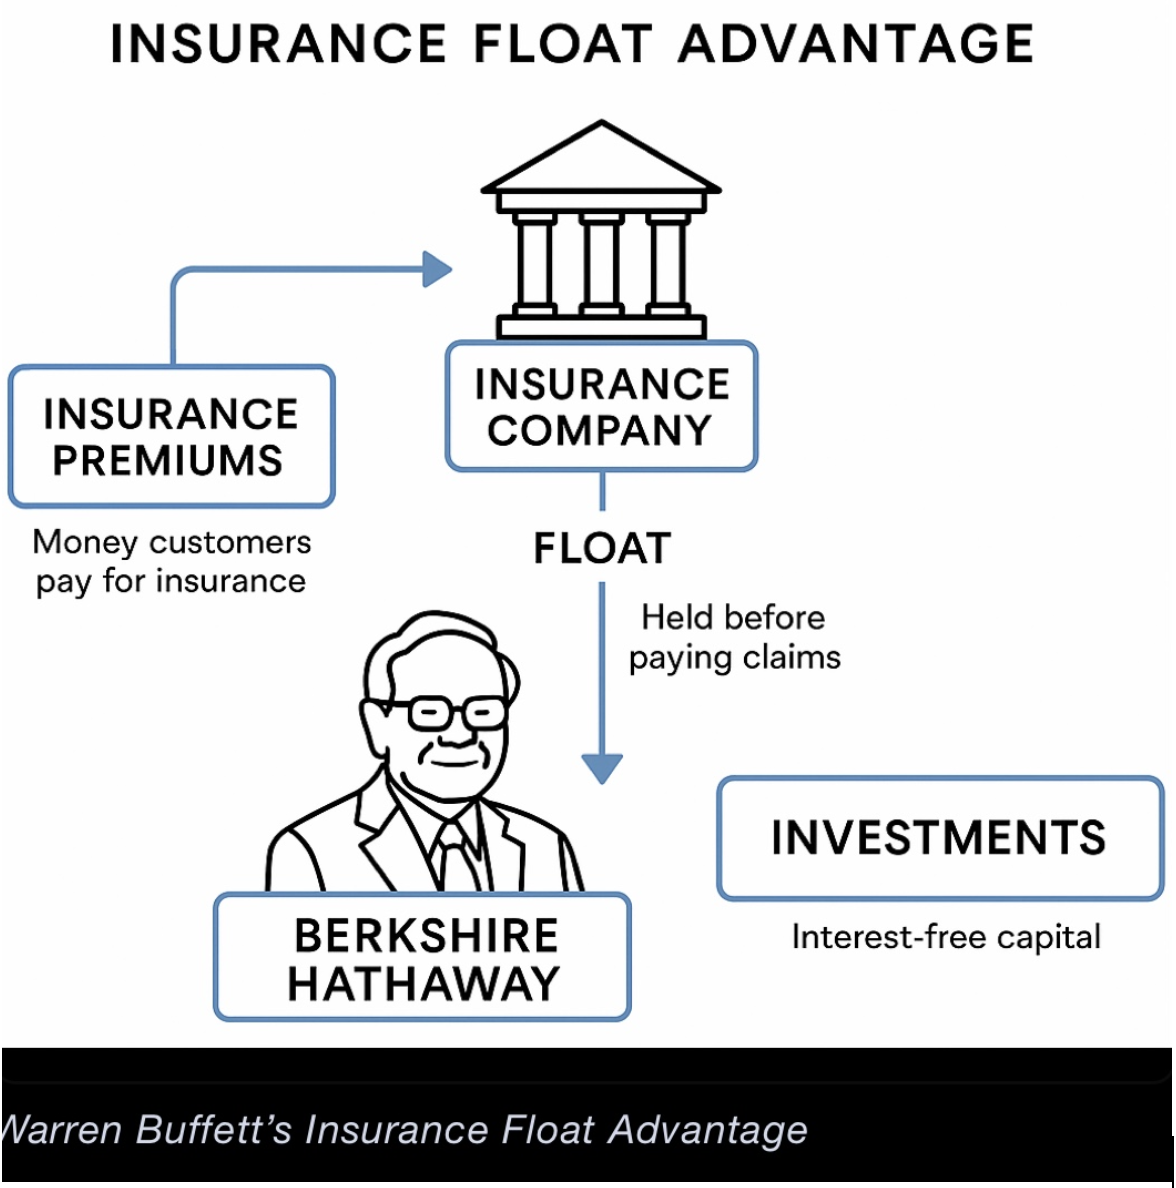
Buffett invests other people’s money, for free, pre-tax, and pockets his share of the gains.
That’s thanks to the “Insurance Float Advantage” – this has helped him grow wealth faster than any average investor ever could hope to aspire.
Secondly, Buffett prefers not to pay dividends, allowing Berkshire Hathaway to retain earnings and compound wealth tax-efficiently.
The average investor mostly cannot afford to compound their returns over a 60-year investment career without having to take any out to live on.
Thirdly, many of Buffett’s deals included warrants and preferred shares with terms that provided Berkshire Hathaway with significant upside but very limited risk – structures not available to retail investors who instead must invest in riskier common stock.Billions of Buffett’s profits were accumulated in this fashion.
Next, we can understand Buffett’s additional advantage in having direct access to policymakers and financial government agency officials that the average investor couldn’t even hope to have. Since the 1980’s, Buffett’s companies, such as BNSF and his utilities, have benefited from policies shaped in part by industry lobbying. Berkshire has influence in Washington and Wall Street circles far beyond the average investor’s reach.
Of particular significance is Buffett’s access to private placements and preferential treatment since 1967.For example, Buffett was involved in the rescue of GE Capital in 2008, when he invested $3 billion in preferred GE stock yielding 10% annually, with added warrants.Ordinary investors got none of these protective features.
It is arguable that Buffett’s greatest returns were made decades ago, and that his post-1990s returns were heavily reliant on reputation, access, and scale – not just investment skill.
The average investor has no chance to be like Warren Buffett.Yes, we can be patient, and buy cheap stocks, and hold them, but we certainly don’t have proximity to policymakers and government officials, nor do we get special deals or preferential treatment.
My advice:do not compare yourself to Warren Buffett.Instead, keep educating yourself, and keep buying stocks through turbulent times and when the market is rallying.
MARKET UPDATE
S&P 500
The index has broken above key resistance at 5475/85.The price action could be part of a period of limited ranging, with an upside bias – though don’t expect large moves to the upside.This could last for the next few months.
Resistance:5700/5780/5885
Support:5570/5475 area
GOLD
Gold has moved lower from the April 22nd high at $3500.Bearish technical argue that we may have seen the top for at least a month, and potentially much more.
But when topping occurs, we must remember that it is common to see periods of ranging, rather than a one- way decline.
Resistance:$3265/70 and $3367
Support: $3200/$3160/$3049
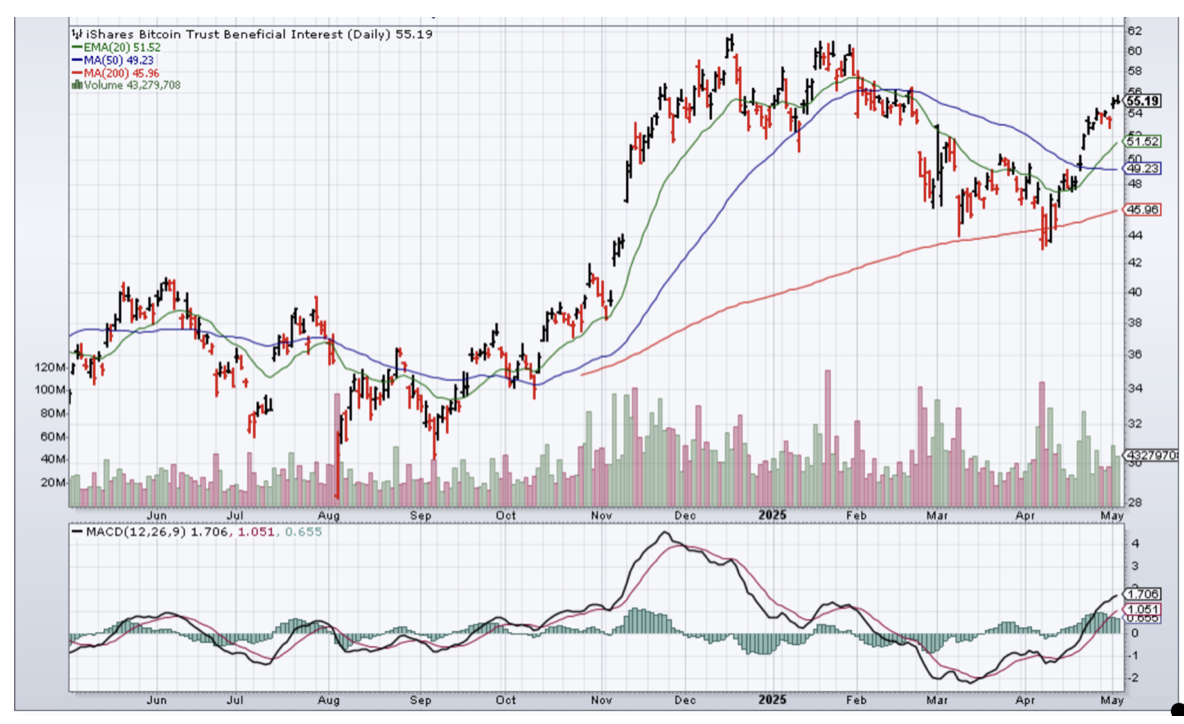
BITCOIN
Bitcoin has hit 97.9k – that 109.4k peak remains in view.However, some consolidation may be seen for the next few weeks before we see more strong moves to the upside.
Resistance: 97.9/100.5/101k
Support: 95.3/95.8k and 92.7/88.5k
CURRENT TRADES
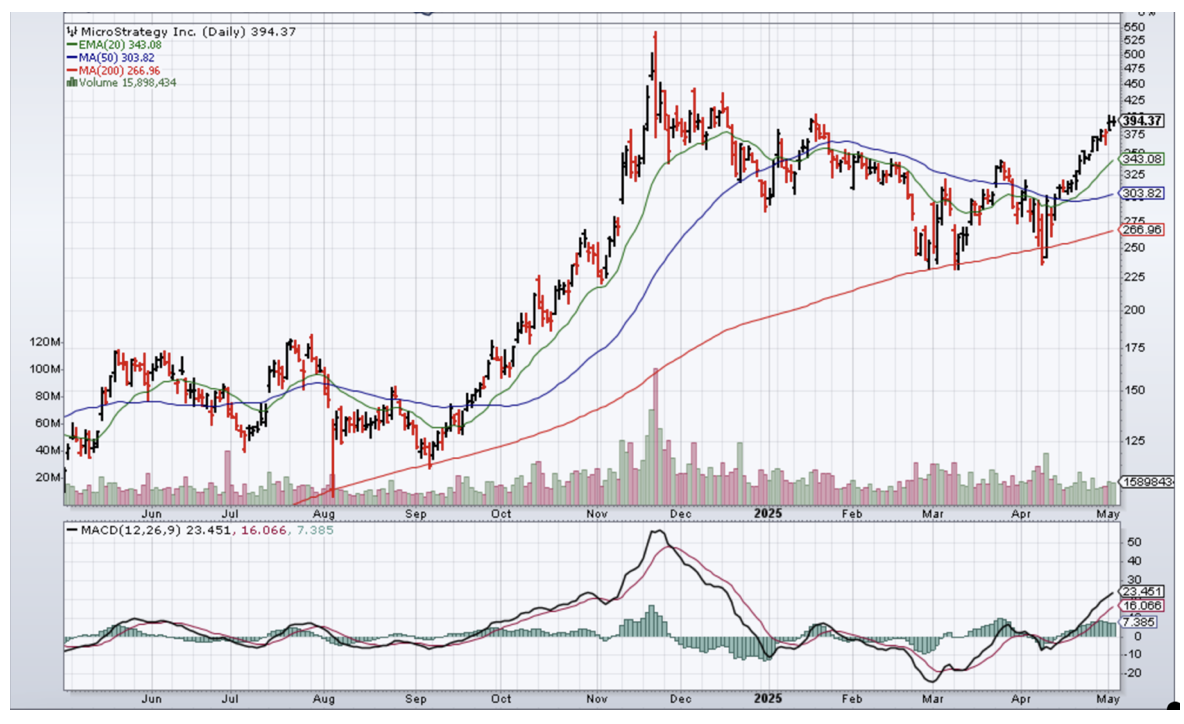
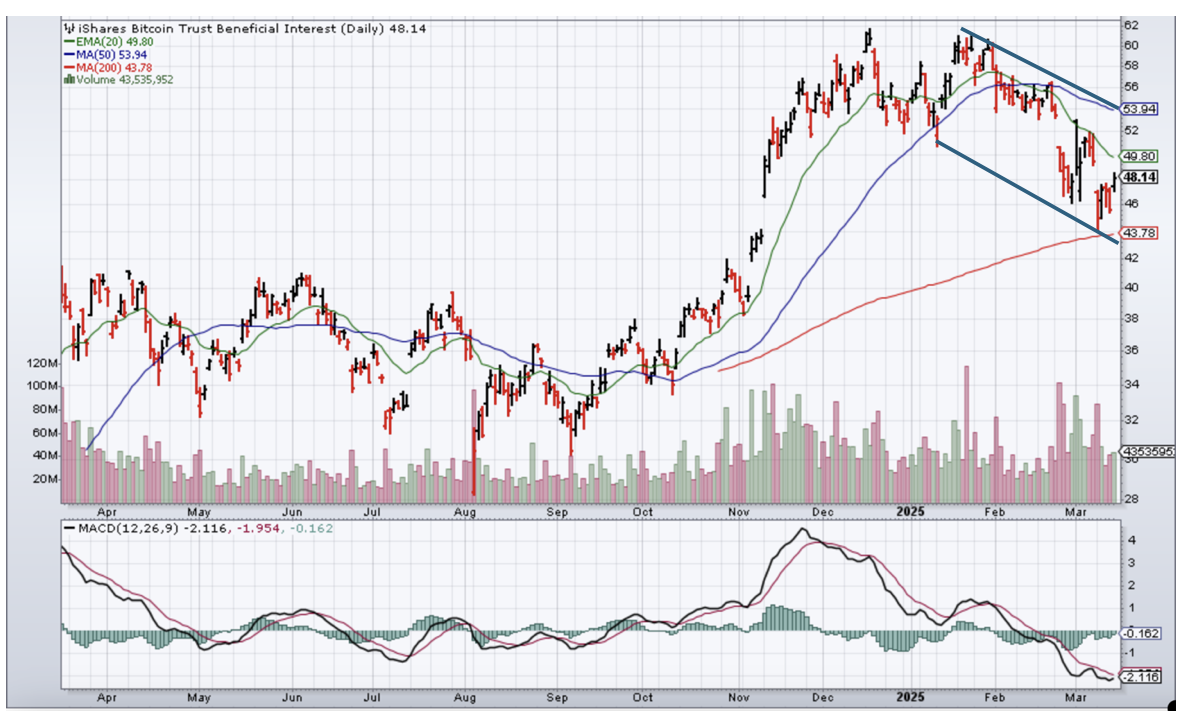
Take profits in the (IBIT) and (MSTR) options spreads expiring in May.Monitor (MSTR) option spread expiring in July and your (IBIT) expiring in June.It was up to each individual how many contracts they entered for each trade.
When John identifies a strategic exit point, he will send you an alert with specific trade information as to what security to sell, when to sell it, and at what price. Most often, it will be to TAKE PROFITS, but, on rare occasions, it will be to exercise a STOP LOSS at a predetermined price to adhere to strict risk management discipline.Read more
There is a very high degree of risk involved in trading. Past results are not indicative of future returns. MadHedgeFundTrader.com and all individuals affiliated with this site assume no responsibilities for your trading and investment results. The indicators, strategies, columns, articles and all other features are for educational purposes only and should not be construed as investment advice. Information for futures trading observations are obtained from sources believed to be reliable, but we do not warrant its completeness or accuracy, or warrant any results from the use of the information. Your use of the trading observations is entirely at your own risk and it is your sole responsibility to evaluate the accuracy, completeness and usefulness of the information. You must assess the risk of any trade with your broker and make your own independent decisions regarding any securities mentioned herein. Affiliates of MadHedgeFundTrader.com may have a position or effect transactions in the securities described herein (or options thereon) and/or otherwise employ trading strategies that may be consistent or inconsistent with the provided strategies.