At this point, it is possible that the president may lose the November election.
He is 14 points behind Democratic candidate Joe Biden in the polls. The odds at the London betting polls have him losing by a similar amount. My old employer The Economist magazine in London gives him a 10% chance of winning using a mix of economic and polling data.
And this assumes the election is held today. The fact is that the president is digging himself into a deeper hole every day, taking the wrong side of every issue confronting the country today. He seems to be refighting the Civil War….and taking the Confederate side when even the State of Mississippi is taking its symbol off its flag.
So, what will the post-Trump world look like? Will taxes go through the roof? Will the market crash? Is it time to go 100% cash, change our names, and move to a country with no US extradition treaty?
I don’t think so. In fact, with stocks soaring to meteoric new highs every day, the market expects that a Biden administration will be great news for stocks, perhaps the best ever.
Taxes will certainly go up. Favorable tax treatment of the energy, real estate, and private equity funds will get axed. Carried interest will finally become history. Marginal tax rate on net income over $1 billion could get hiked to the Roosevelt levels of 80-90%.
Biden has already announced an increase in the corporate tax rate from 21% to 28%. That will cut earnings for the S&P 500 by $9 a share. But the stock market is not the economy, with S&P earnings only accounting for 10% of US GDP.
And the $9 companies lose in taxes they will make back and more from new government spending, which isn’t slowing down any time soon. Some 14,000 American bridges need to be rebuilt. The Interstate Highway System is a shambles. High-speed broadband needs to go rural. The electrification of the US needs to accelerate to accommodate the millions of electric cars headed our way.
I believe that eventually, 51 million Americans will lose their jobs as a result of the pandemic. Perhaps a third of those are never coming back because the future has been so accelerated. That will leave the broader U-6 Unemployment rate stuck in double digits for years, maybe for decades.
So, we’re going to need some kind of Roosevelt style programs like the Works Progress Administration (WPA) and the Civilian Conservation Corps (CCC) who built much of the monolithic infrastructure that we all enjoy today.
At least 300,000 educated workers could immediately be put to work in contact tracing. Millions more could be employed in national infrastructure programs. One thing is certain. A new administration won’t stop massive government spending, it will simply redirect it.
And let's face it. A Biden win would bring a big expansion of Obamacare. With the best healthcare technology in the world, private industry has done the world’s worst job controlling the pandemic.
Countries with well-run national healthcare systems like Australia, New Zealand, Japan, and Singapore have almost wiped out the disease. This is why I am avoiding the healthcare sector for the foreseeable future.
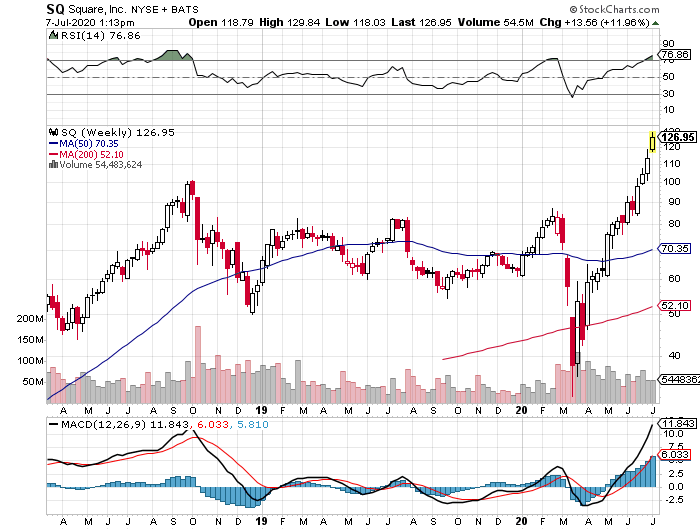
Who are the big winners of all this? Big tech (FB), (AAPL), (MSFT), (AMZN), medium tech (ADBE), fintech (SQ), (PYPL), the cloud (CRM), and biotech (SGEN), (REGN), and (ILMN).
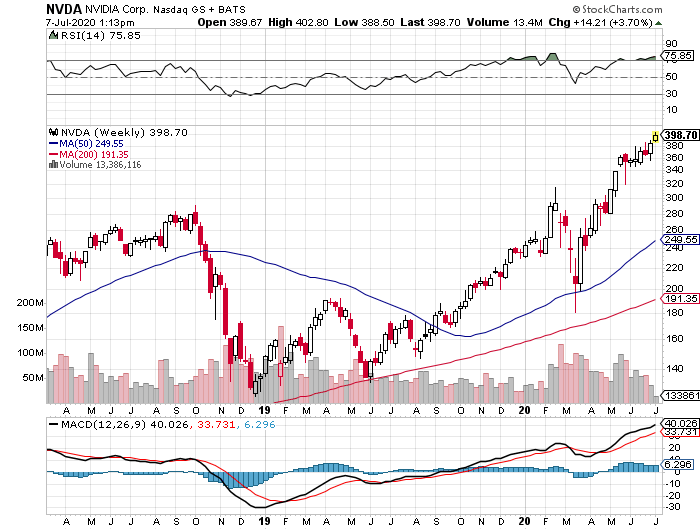
Cybersecurity will always be in demand (FEYE), (PANW). The global chip shortage will continue to worsen (AMD), (MU), (NVDA).
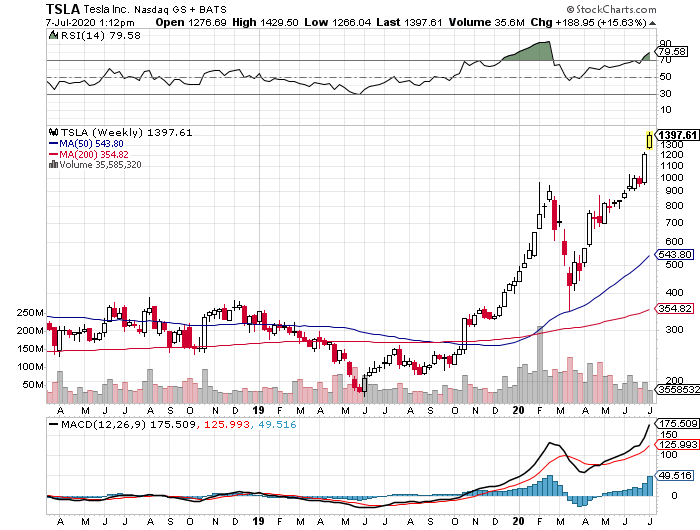
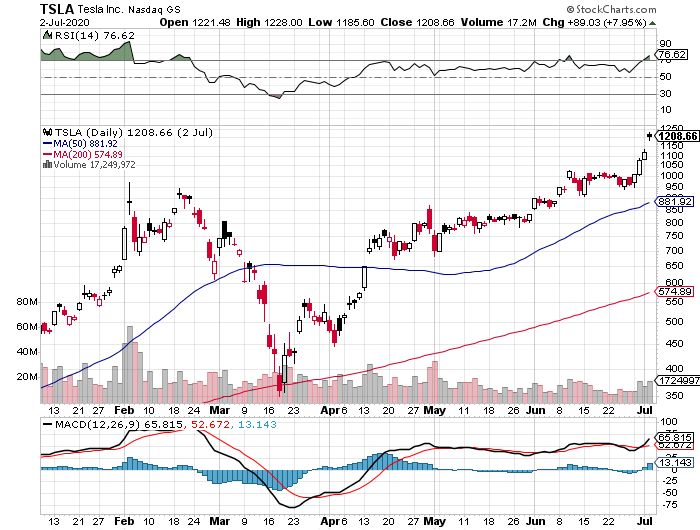
And Tesla (TSLA)? What can I say? It is already up nearly 100-fold from my initial $16.50 recommendation in 2010, and I’ve bought three Tesla’s (two S’s and an X).
Followers of the Mad Hedge Trade Alert service know that I am already long these names up the wazoo, and is why I am up 26% in 2020. It’s simply a matter of all pre-pandemic trends hyper-accelerating, which we were already tapped into.
If you have to add a purely domestic sector, a gigantic Millennial tailwind will keep homebuilders bubbling for years like (LEN), (PHM), and (KBH).
And while you won’t find me as a player here, retail will recover. The sector has not prospered during the current administration, thanks to a trade war with China and the pandemic.
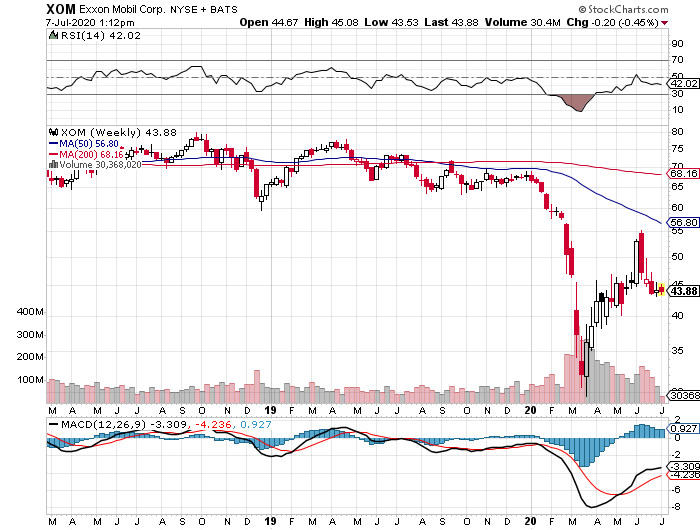
And the losers? There is a classification of “Trump” stocks you don’t want to be anywhere near. Energy will do terribly (XOM), (CVX), (XOM), with Texas tea possibly revisiting negative numbers. If you take away the tax breaks, energy hasn’t really made money in decades.
Defense stocks (RTN), (NOC), (LMT) will take a big hit from budget cutbacks and fewer wars. Coal (KOL) will finally get shut down for good, probably sold to China in bankruptcy proceedings. Industrials will continue to lag (X), (GE), with no more free handouts from the government and no technology advantage.
So if Biden wins, you don’t need to slit your wrists, hang yourself from the showerhead, or cease investing completely. Just take your stock market winnings and go out and get drunk instead.
https://madhedgefundtrader.com/wp-content/uploads/2019/05/cropped-mad-hedge-logo-transparent-192x192_f9578834168ba24df3eb53916a12c882.png00Mad Hedge Fund Traderhttps://madhedgefundtrader.com/wp-content/uploads/2019/05/cropped-mad-hedge-logo-transparent-192x192_f9578834168ba24df3eb53916a12c882.pngMad Hedge Fund Trader2020-07-08 09:02:282020-07-08 08:56:44Trading the Blue Wave Stock Market
Below please find subscribers’ Q&A for the July 1 Mad Hedge Fund TraderGlobal Strategy Webinar broadcast from Silicon Valley, CA with my guest and co-host Bill Davis of the Mad Day Trader. Keep those questions coming!
Q: You obviously do well with deep-in-the-money call and put spreads, but I struggle to get your prices.
A: Raise the strike prices or raise the price that you’re bidding for them closer to my limit. It’s really hard to keep current prices in this market with such extreme volatility (VIX), especially when you’re having melt-ups going on in Tesla (TSLA) and so on. Our trade alerts are just a starting point to get you going in the right direction in the right stock. The people who make the most money with the trade alert service are those who use my market timing to buy futures, either at the money risk reversals on stocks (long the call and short the put), or outright futures in gold (GLD), currencies (FXE), and bonds (TLT).
Q: How high can Tesla go?
A: My immediate target is $1200 (which has already been hit), and the rumors I'm hearing is that they will be good if you factor in the two months that the Fremont factory was closed. And after that, it’s $2,500 and then there's Ron Baron’s target of $5,000, who’s been in the stock himself since it was at $100 a share. Ron was a little late in finding my research on the company. I first got in at $16.50 after I toured the Fremont factory.
Q: Is it possible there will be a national mandate to wear masks, which could boost stocks?
A: Not under this president. Do not expect help from this administration on this pandemic. They've figured out they can’t beat it so they are just walking away and leaving the states to figure out what they can. You’ll have to wait for another president to get a national mask mandate if we’re still alive by that time. I am getting a lot of emails from Europe complaining that the United States is extending the pandemic by having so many people refusing to wear masks here or admit that the disease even exists. They are horrified.
Q: What do you think about the biotech ETF (IBB)?
A: I’d be buying it with both hands. Even without the pandemic, a new bull market started last September in biotech because the fundamentals long term were fantastic. But you had to be a scientist to see it back then. They really had the highest earnings growth with the lowest price earnings multiples in the entire stock market. The pandemic just gave it a supercharger. That’s why I started the Mad Hedge Biotech & Healthcare Letter (click here).
Q: Which ETF should I use for biotech?
A: The iShares NASDAQ Biotechnology ETF (IBB). It's a basket of the top 20 global biotech firms but will underperform single biotech stock picks by half, as any basket does.
Q: What about the long-term portfolio?
A: I will get to it. It seems like our long-term portfolio is changing every week, so it’s difficult to really look at anything in the long term. These days, long term is a week with all the volatility we’re getting. I imagine I’d be getting rid of any energy stocks on this rally though. I see oil going back to zero.
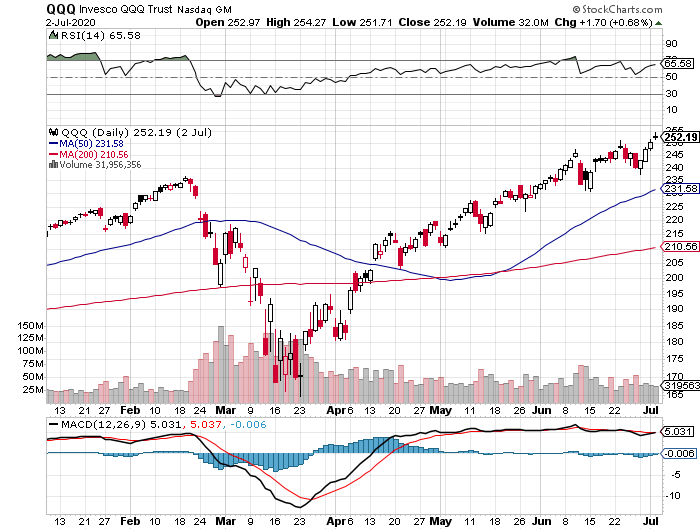
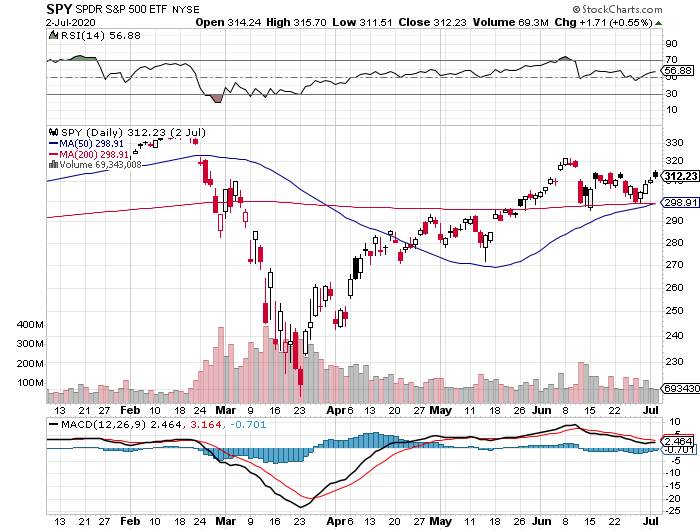
Q: You say stay long NASDAQ (QQQ) and short S&P 500 (SPY) for the rest of the year, but you project new highs for the S&P 500?
A: Yes, both can go up, but NASDAQ will go up faster, and that’s what hedge funds are doing. That gives you a market neutral position, sucks a lot of the risk out of that position, and it’s even crash-proof as we saw in the winter when the markets were melting down. And like hedge funds, you can leverage that up 5 or 10 times. So yes, that trade will work all day long, even if both indexes go to new highs. I imagine NASDAQ will outperform on the upside relative to SPY by a factor of two or three to one.
Q: Is there a good substitute to use versus your deep-in-the-money alerts if you have a smaller account?
A: You can just buy the stocks. Or, you can just buy the stocks on margin, which is 2 to 1—50% margin requirement there. There are many ways to skin a cat. The call spreads actually give you the most bang per buck because you get a lot of leverage with a small dollar amount upfront and limited risk.
Q: I heard that hedge funds have huge shorts. Is this setting up another short squeeze? Will they eventually be right?
A: Yes, that may have been what happened on Monday and Tuesday, a squeeze on the shorts driving prices much higher. They will eventually be right a little bit, but you’re certainly not going to get the major declines we saw in February/March because of all the QE and government support. The pandemic is no longer a surprise.
Q: Will COVID-19 fears keep volatility elevated until there is a vaccine?
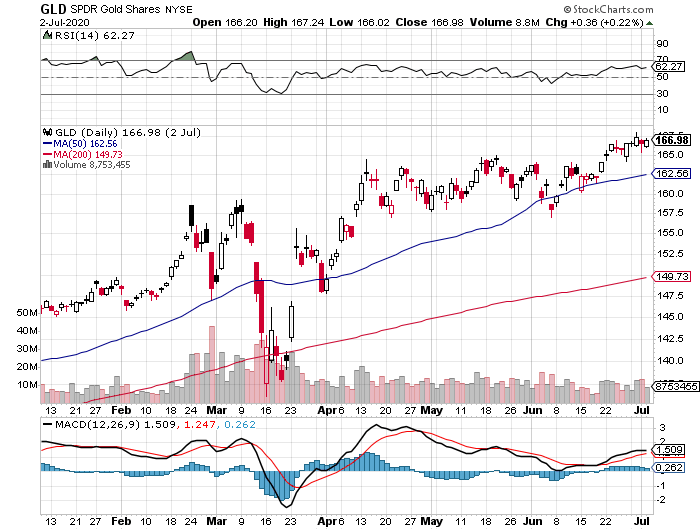
A: Absolutely, yes. That’s great news for our options strategy, which is why we’re 100% invested almost all the time these days because higher volatility doubles the premiums you get for options. My current strategy is that once a position hits 90% of its maximum profit, I dump it and put on another position to take in an extra $1,500-$2,000. I did that with Tesla and gold (GLD) last week. This is the golden age of the in-the-money put and call spread strategy and we are better at executing it than anyone else.
Q: What do you have to say about the jobs report?
A: The entire US economic data system is breaking down because we’re seeing such immense swings month to month. Reporting lags are getting amplified one hundredfold. The June Nonfarm Payroll Report showed an increase of 4.8 million jobs and an unemployment rate of only 11.1% (I never thought I’d ever say “only 11.1%”). However, the state jobless claims are indicating an unemployment rate of at least 22%. Go walk down the Main Street of any town and you’ll see that the state figures are right. All the forecasting is relatively pointless. How can we get a fall in unemployment when nothing is open?
Q: Are you recording this webinar?
A: Yes, we usually post the recorded webinar on the site 2 hours after we finish so our many international subscribers don’t have to stay up until the middle of the night to watch it. That’s how long it takes to convert the webinar into a video format we can post online.
Q: When setting up LEAPS (Long Term Equity Participation Securities), do you buy straight calls at-the-money or in-the-money?
A: You buy deep, out-of-the-money spreads. Let's say you bought a (TSLA) $1,500/$1,550 deep-in-the-money call spread, and it expires at the maximum profit point with the stock over $1,550. You’ll make about a 500% return on that because it’s so far out of the money; the leverage is enormous. Will Tesla close over $1,550 in two years? Probably.
Q: How do I get into Tesla?
A: Close your eyes and buy at market, and hope we get $1,200 tomorrow on great Q2 sales numbers. Or, wait for another one of these huge selloffs—Tesla does have a history of selling off 50% at any given time, and then you go into a LEAPS there and get a 500% return. Most investors prefer the latter if they know about LEAPS. Remember, our last “BUY” into Tesla was a year ago when the stock was at $180. By the way, a lot of the shorts in Tesla stock were financed by big oil money and when oil crashed, they lost the ability to post more margin. So, they were forced to cover their shorts at gigantic losses, creating this super spike in the share price. Elon Musk, who owns 20% of the company, is laughing all the way to the bank.
Q: How do we pick the best strike prices for long-term LEAPS?
A: Go 30% out-of-the-money. There you get your 500% return. If you really want to be aggressive and you think the stock has 50% of upside, then go 50% out-of-the-money. There your return will be about a 1,000% profit over 2 years.
Q: How long are these trades for? I haven’t received any trade alerts.
A: Please contact customer support and we’ll find out if they are being filtered out by your spam folder. Global Trading Dispatch is sending out trade alerts virtually every day for all asset classes, so you should have received several of them by now. The Mad Hedge Technology Letter sends out fewer because they are confined to a narrow part of the market.
Q: What is your favorite stock in the gold space?
A: Newmont Mining (NEM). They have the strongest balance sheet of the major gold companies because they engage in fewer takeovers than the other big gold companies.
Good Luck and Stay Healthy
John Thomas
CEO & Publisher
The Diary of a Mad Hedge Fund Trader
https://www.madhedgefundtrader.com/wp-content/uploads/2018/11/John-Thomas-1.png529502Mad Hedge Fund Traderhttps://madhedgefundtrader.com/wp-content/uploads/2019/05/cropped-mad-hedge-logo-transparent-192x192_f9578834168ba24df3eb53916a12c882.pngMad Hedge Fund Trader2020-07-07 09:04:362020-07-07 09:19:23July 1 Biweekly Strategy Webinar Q&A
All of your subscribers should have hit it out of the park today with Tesla (TSLA). Your trade alert has paid for many years of subscriptions. May the booze continue to show up at your estate.
Frank
Dallas, Texas
https://www.madhedgefundtrader.com/wp-content/uploads/2018/10/John-Thomas-Sydney.png345377Mad Hedge Fund Traderhttps://madhedgefundtrader.com/wp-content/uploads/2019/05/cropped-mad-hedge-logo-transparent-192x192_f9578834168ba24df3eb53916a12c882.pngMad Hedge Fund Trader2020-07-07 09:02:352020-07-07 09:27:53Testimonial
That’s long gone, tossed in the dustbin of history.
We now have a stock market that runs on “COVID ON, COVID OFF”.
When the rate of increase in the number of new US Covid-19 cases soars, stocks dive. When they fade, stocks rocket. It doesn’t get any more complicated than that.
In fact, the market is becoming immune to induced Covid shocks. In February and March, it was a huge black swan. Now, it is put in front of our face every day, from the moment we put on our masks in the morning to the when we vigorously wash our hands on our return.
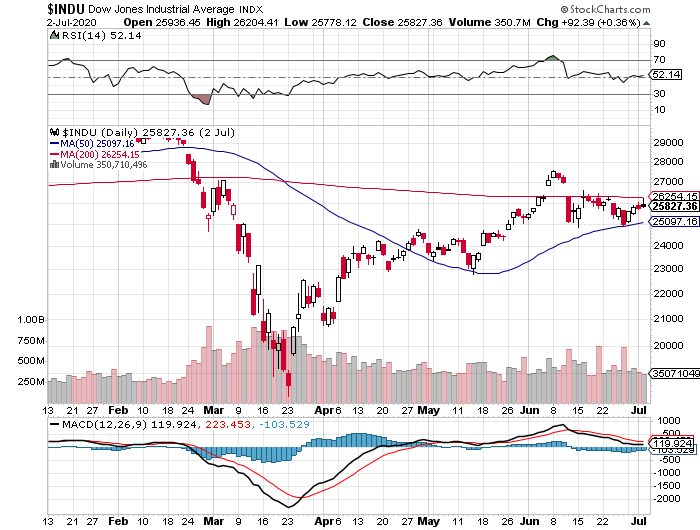
Which leads us to the question, “What are we buying here with the Dow Average at 26,000 and the S&P 500 price earnings multiple at a nosebleed 26X?” The lead sector of technology is seeing a four times price to sales multiple, the highest since the Dotcom Bubble top.
You certainly aren’t paying for 2020 earnings, which have been completely written off by investors long ago. (SPY) earnings could drop from $162 a share in 2019 to $125 this year…. or $85, depending on how long the Great Depression extends.
You are not paying for 2021 or 2022 earnings either because stocks are still expensive according to traditional benchmarks. Now, you have to go out to 2023 before we recover that historic $162 a share level. And that is the bull case. The bears don’t see earnings returning to peak levels until 2025, or even 2030 before we recover the 2019 earnings power.
Good thing I am not a habitual bear. I believe the America that comes out the other side of the pandemic will be immensely more powerful and profitable than the one going in. Fat is being trimmed at an incredible pace. New product lines and services are being invented out of whole cloth. What is going on in biotech is out of science fiction. And you want to buy a piece of this right now.
All of this sets up my coming American “Golden Age” scenario and another Roaring Twenties. Investors are not paying for the last America, but the next one, and that one is much more valuable. Stocks in the old America are expensive. Stocks in the new America are cheap.
I can see how this plays out with all the clarity of a sage. The Dow Average will grind up to just short of the all-time high. Then, a true vaccine will be announced and stocks will rise by 5% a day until the Index doubles to $50,000.
If the Oxford vaccine succeeds with its stage three trials in August, this could be only weeks away. Hence, the superheated market action right now.
It isn’t going to be all Champaign and roses. We are on the verge of losing the bottom quarter of the US population, the part that doesn’t own stocks, rents their homes, and once had low-waged jobs in restaurants, retailers, hotels, local government, and airlines. As many as ten million could get evicted from homes. The U-6 unemployment rate will stay permanently in double digits.
Then the next government will have to roll out 1930s style Roosevelt programs that put millions to work, like the Civilian Conservation Corps, which built much of the public infrastructure that we enjoy today.
June Nonfarm Payrolls blew it away, up 4.8 million, taking the unemployment rate to a still half-century high of 11.1%. A gain of only 2 million was expected. The problem is that the states that powered the greatest gains are now showing the biggest increases in new infections. Leisure & Hospitality gained 2.1 million, Retail 739,000, Manufacturing 356,000, Construction 158,000. It’s probably the most meaningless number ever reported.
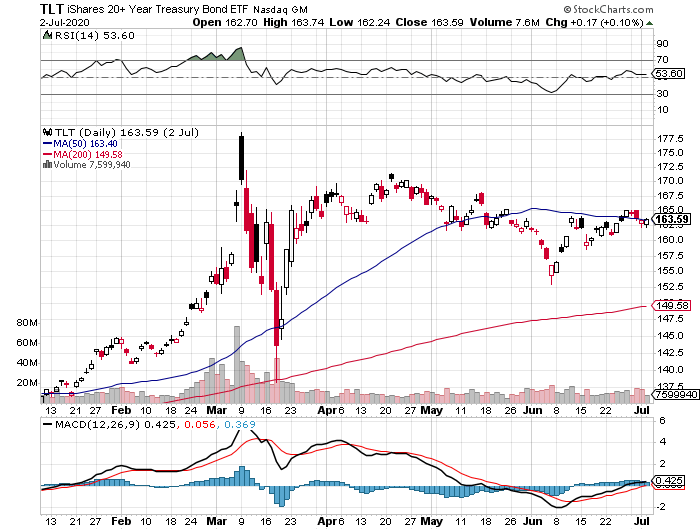
Bonds were the best performing asset class in June, up 9%, with a huge flight to safety bid chasing every category of fixed income. It’s setting up one of the best short-selling opportunities of the century….again. The bond market is about to get crushed by historic over-issuance of paper by the US government.
The IMF predicts a 4.9% global GDP loss in 2020, a 1.9% drop in only two months. They are expecting a 5.4% bounce back in 2021. It lines up with my own forecast that things will get much worse before they get better.
Pending Home Sales up a staggering 44.3% in May, far and away the largest pop in history on a signed contract basis. They’re still down 5% YOY. Most builders will take that as a win. The west saw the biggest gains, up 56%. It bolsters my argument that housing will be immune to the current Great Depression, thanks to a surging Millennial demographic tailwind.
Fed Governor Powell warns of unprecedented uncertainty in his comments to be delivered to the House today. Translation: interest rates will stay lower for longer. Oh, and we need more fiscal stimulus too.
Tesla announced blockbuster Q2 sales. Of course, the news that Tesla delivered an amazing 90,650 vehicles in Q2, 20,000 greater than the most optimistic expectations, was the trigger. This is at the height of the pandemic with the factory closed for two months. I sent out a trade alert on the stock two days ago with a $1,200 target and it is already up 20%. The bottles of single malt Scottish whiskey have already started to arrive (hint, hint). Tesla now has a market capitalization of an eye-popping $225 billion. Tesla has had everything thrown at it that should have wiped it out, like a pandemic, Great Depression, and negative oil prices. Yet, it has gone from strength to strength, the shares tripling off the March lows. Next stop $2,500.
The PPP is running out, and companies are not allowed to double-dip, unless congress changes the law and replenishes the funds. Some 47% of Americans work for companies with less than 500 employees, so the unemployment rate could surge to over 52 million. Me thinks the market won’t like this. Grounds for another 10% correction? My downside target is $270 in the (SPY). The ISM Manufacturing Index shocked to the upside in June, coming in at 52.6 from 31.8, the best report in a year. It shows there was some kind of reopening going on last month. Can we repeat in July?
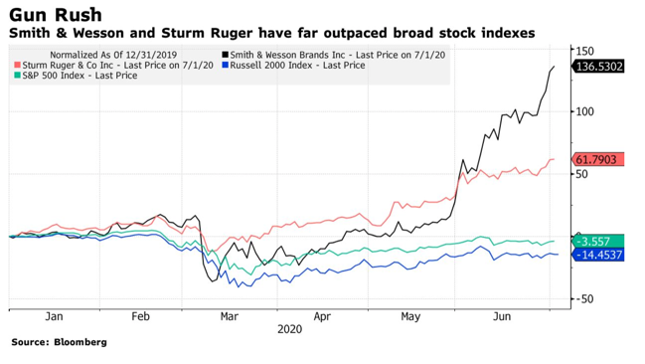
Gun Sales are soaring, according to FBI background check statistics for June. New owners are seeking protection in our current dystopian world on riots and pandemic. Many will end up shooting themselves or loved ones in accidents. The greatest of all ironies here is that Remington is now owned by the Navajo Indian tribe, who are almost wiped out by Remington’s in the 19th century, which they just obtained ownership of in a bankruptcy settlement.
When we come out the other side of this, we will be perfectly poised to launch into my new American Golden Age, or the next Roaring Twenties. With interest rates still at zero, oil cheap, there will be no reason not to. The Dow Average will rise by 400% or more in the coming decade.
My Global Trading Dispatch enjoyed the best week in its 13-year history, up an astounding +10.67%, even though it was only a holiday-shortened four-day week. We have taken in an eye popping +2.85% just in the first two days of July.
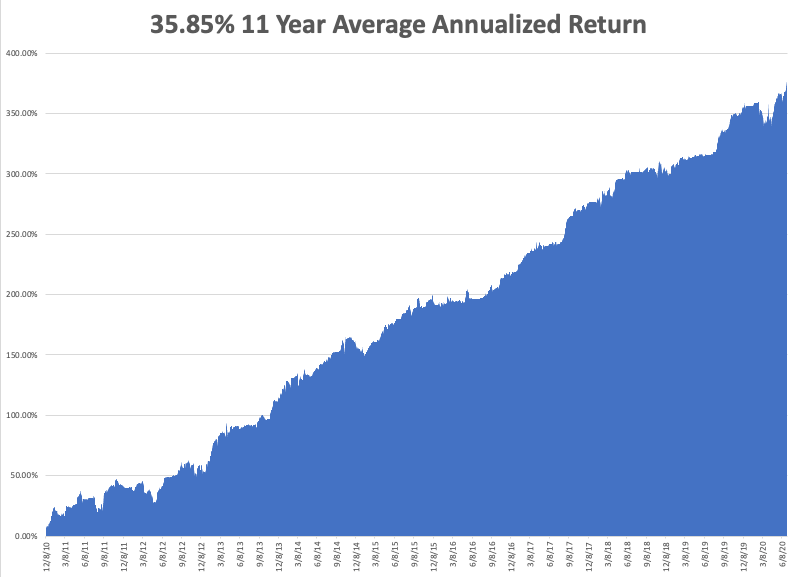
June closed at an awesome 10.38%. It was a week when everything worked in the extreme. My eleven-year performance rocketed to a new all-time high of 379.46%. Double weightings in Tesla, gold, and biotech were a big help.
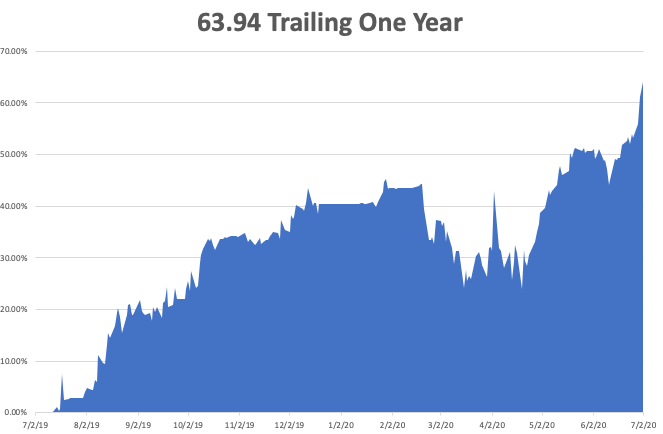
That takes my 2020 YTD return up to an industry-beating +23.25%. This compares to a loss for the Dow Average of -9.4%, up from -37% on March 23. My trailing one-year return popped back up to 63.85%, THE HIGHEST IN THE 13 YEAR HISTORY of the Mad Hedge Fund Trader. My eleven-year average annualized profit recovered to a record +35.85%.
The only numbers that count for the market are the number of US Coronavirus cases and deaths, which you can find here. It’s jobs week and we should see an onslaught of truly awful numbers.
On Monday, July 6 at 10:00 AM EST, the June ISM Non-Manufacturing Index is released.
On Tuesday, July 7 at 8:00 AM EST, the US Vehicle Sales for June are announced.
On Wednesday, July 8 at 10:30 AM EST, the EIA Cushing Crude Oil Stocks are out.
On Thursday, June 9 at 8:30 AM EST, Weekly Jobless Claims are announced.
On Friday, June 10 at 8:30 AM EST, the US Producer Price Index is released. The Baker Hughes Rig Count is out at 2:00 PM EST.
As for me, I’ll be hitting the beach at Incline Village, Nevada, managing the appropriate social distance. The Coronavirus has a much short life span in the supper dry High Sierra air so I should be OK. And as far as I know, the virus can’t swim….yet.
Stay healthy.
John Thomas
CEO & Publisher
The Diary of a Mad Hedge Fund Trader
https://www.madhedgefundtrader.com/wp-content/uploads/2020/07/corps.png312375Mad Hedge Fund Traderhttps://madhedgefundtrader.com/wp-content/uploads/2019/05/cropped-mad-hedge-logo-transparent-192x192_f9578834168ba24df3eb53916a12c882.pngMad Hedge Fund Trader2020-07-06 09:02:152020-07-07 08:28:15The Market Outlook for the Week Ahead, or Meet the New Market
I am absolutely sure that John does not need, expect, or want to hear about compliments, but his eBook on Stocks to Buy for the Coming Roaring Twenties is a Da Vinci piece of art. It’s just fantastic, exactly what I was expecting to get my hands upon but could not afford to do so.
I have to read and re-read it to understand the 5th wave of evolution.
Indirectly, John does touch upon AI (artificial intelligence) and AR (augmented reality), i.e. XR (extended reality) and Analytics but it would be great if he sheds his brilliance here too so we are aware of the incoming tsunami and prepare ourselves for the shock and the aftershocks as these will be like tectonic shifts in our future lives.
All in all, it is just a monumentally fantastic compilation of what is happening and going to happen. Somehow this piece of work reminded me of the painting of Mona Lisa, where her smile is like telling us, “Just wait and see what is about to happen.”
Now, I am aware that I have gotten carried away – but do convey to John my "thank you" from the bottom of my heart –a colossal piece of work, the culmination of past, present, and future in 154 pages.
I don’t know how one could trade without reading this. Quite the “Fiat Lux” I had waited for. Thanks again for allowing me to take a look at the “unfinished” piece of art.
Now, I have months to see that I can make enough money to continue being a member of John's group to access the enlightened rest of my life.
I had stopped working to look after a terminally relative who had no one except me and my wife and we did everything we could to make his life a good as possible and in the end, got rewarded by stumbling on to Johns seminar and getting the possibility to get into it – as they say, what goes around comes around!
In gratitude - Shabaz
https://www.madhedgefundtrader.com/wp-content/uploads/2019/07/john-thomas-10.png643483Mad Hedge Fund Traderhttps://madhedgefundtrader.com/wp-content/uploads/2019/05/cropped-mad-hedge-logo-transparent-192x192_f9578834168ba24df3eb53916a12c882.pngMad Hedge Fund Trader2020-07-01 09:02:292020-07-01 09:36:18Testimonial
Legal Disclaimer
There is a very high degree of risk involved in trading. Past results are not indicative of future returns. MadHedgeFundTrader.com and all individuals affiliated with this site assume no responsibilities for your trading and investment results. The indicators, strategies, columns, articles and all other features are for educational purposes only and should not be construed as investment advice. Information for futures trading observations are obtained from sources believed to be reliable, but we do not warrant its completeness or accuracy, or warrant any results from the use of the information. Your use of the trading observations is entirely at your own risk and it is your sole responsibility to evaluate the accuracy, completeness and usefulness of the information. You must assess the risk of any trade with your broker and make your own independent decisions regarding any securities mentioned herein. Affiliates of MadHedgeFundTrader.com may have a position or effect transactions in the securities described herein (or options thereon) and/or otherwise employ trading strategies that may be consistent or inconsistent with the provided strategies.