Featured Trade:
(BRING BACK QE!),
(DXJ),(HEDJ), (UUP), (SPY), (TLT),
(FXY), (FXE), (GLD), (USO), (CU), (UNG)
(DECODING THE GREEBACK),
(WHAT ABOUT ASSET ALLOCATION?)
WisdomTree Japan Hedged Equity ETF (DXJ)
WisdomTree Europe Hedged Equity ETF (HEDJ)
PowerShares DB US Dollar Bullish ETF (UUP)
SPDR S&P 500 ETF (SPY)
iShares 20+ Year Treasury Bond (TLT)
CurrencyShares Japanese Yen ETF (FXY)
CurrencyShares Euro ETF (FXE)
SPDR Gold Shares (GLD)
United States Oil (USO)
First Trust ISE Global Copper ETF (CU)
United States Natural Gas (UNG)
https://madhedgefundtrader.com/wp-content/uploads/2019/05/cropped-mad-hedge-logo-transparent-192x192_f9578834168ba24df3eb53916a12c882.png00Mad Hedge Fund Traderhttps://madhedgefundtrader.com/wp-content/uploads/2019/05/cropped-mad-hedge-logo-transparent-192x192_f9578834168ba24df3eb53916a12c882.pngMad Hedge Fund Trader2015-11-24 01:09:452015-11-24 01:09:45November 24, 2015
You wanted clarity in understanding the current state of play in the global financial markets? Here?s your #$%&*#!! clarity.
You should expect nothing less for this ridiculously expensive service of mine.
But maybe that is the cabin fever talking, now that I have been cooped up in my Tahoe lakefront estate for a week, engaging in deep research and grinding out the Trade Alerts, devoid of any human contact whatsoever.
Or, maybe it?s the high altitude.
I did have one visitor.
A black bear broke into my trash cans last light and spread garbage all over the back yard. He then left his calling card, a giant poop, in my parking space.
Judging by the size of the turds, I would say he was at least 600 pounds. This is why you never take out the trash at night in the High Sierras.
Ah, the delights of Mother Nature!
We certainly live in a confusing, topsy-turvy, tear your hair out world this year. Good news is bad news, bad news worse, and no news the worst of all.
The biggest under performing week of the year for stocks is then followed by the best. Net net, we are absolutely at a zero movement, and lots of clients complaining about poor returns on their investment.
I tallied the year-on-year performance of every major assets class and this is what I found.
+16% - Hedged Japanese Stocks (DXJ)
+15% - Hedged European stocks (HEDJ)
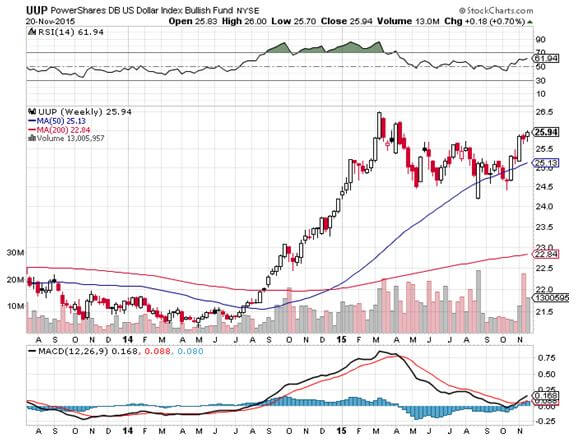
+13% - US dollar basket (UUP)
+10% - My house
0% - Stocks (SPY)
0% -? bonds (TLT)
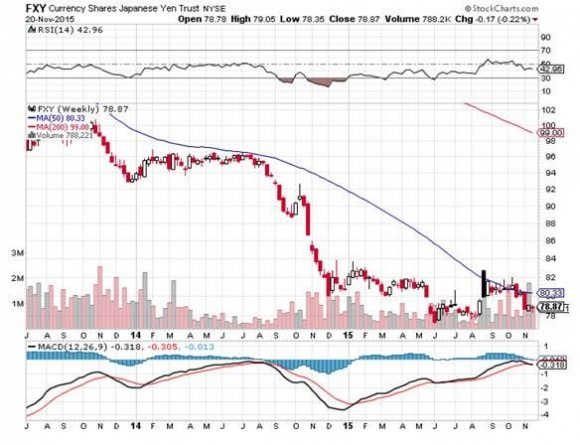
-5% - Japanese Yen (FXY)
-11% - Euro (FXE)
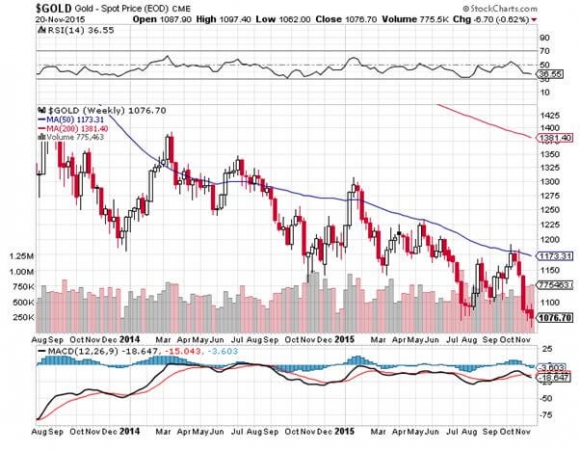
-12% - Gold (GLD)
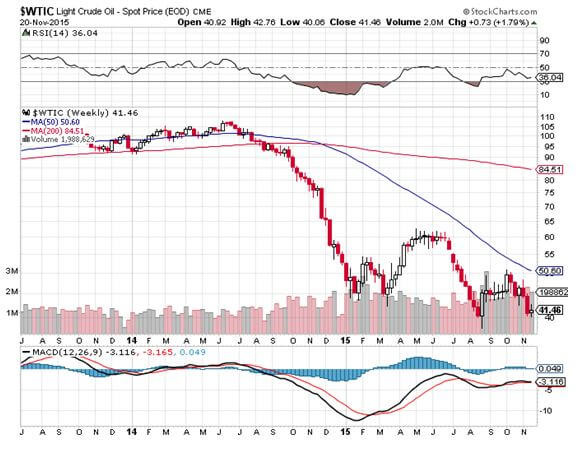
-18% -? Oil (USO)
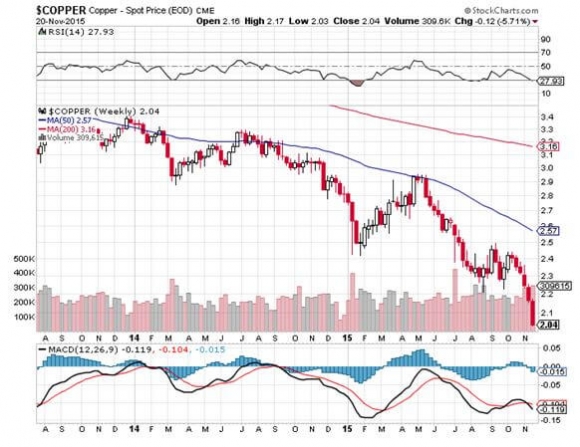
-27% -? Commodities (CU)
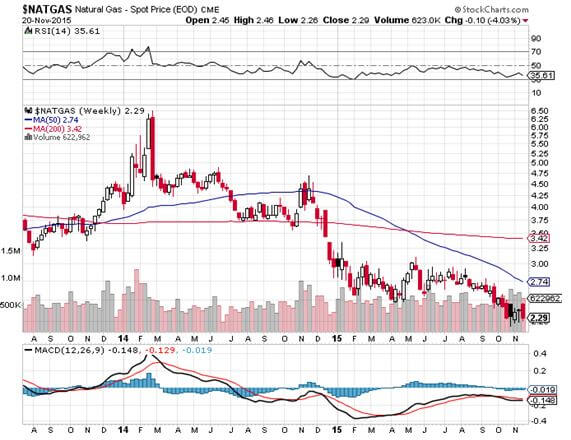
-27% - Natural Gas (UNG)
There are some sobering conclusions to be drawn from these numbers.
There were very few opportunities to make money this year. If you were short energy, commodities, and foreign currencies, you did very well.
Followers of the Mad hedge Fund Trader can?t help but know and love these ticker symbols. They?ll notice that our long plays were found among the asset classes with the best performance, while our short bets populated the losers.
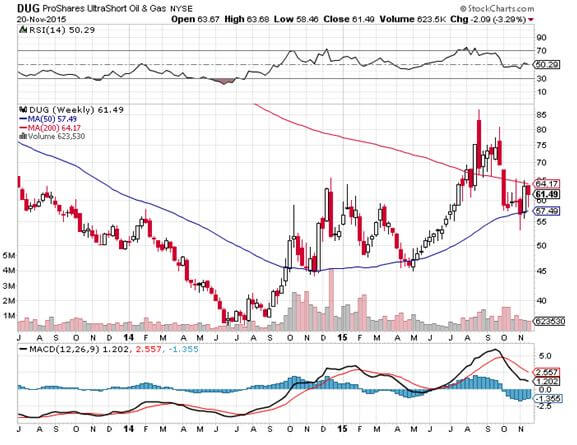
The problem with that is most financial advisors are not permitted to place client funds in the sort of inverse or leveraged ETF?s that most benefit from these kinds of moves (like the (YCS), (EUO), and (DUG)).
That left them reading about the success of others in the newspapers, even when they knew these trends were unfolding (through reading this letter).
How frustrating is that?
What was one of my best investments of 2015?
My San Francisco home, which has the additional benefit in that I get to live in it, have a place to stash all my junk, and claim big tax deductions (depreciated home office space, business use of phone, blah, blah, blah).
Of course, I do have the advantage of living in the middle of one of the greatest technology and IPO booms of all time. Every time one of these ?sharing? companies goes public, the value of my home rises by a few hundred grand.
The real problem here is that investing since the end of the Federal Reserve?s quantitative easing program ended a year ago has become a real uphill battle.
While the government was adding $3.9 trillion in funds to the economy we traders enjoyed one of the greatest free lunches of all time. It made us all look like freakin? geniuses!
Just maintaining their present $3.9 trillion balance sheet, not adding to it, has left almost every asset class dead in the water.
Heaven help us if they ever try to unwind some of that debt!
Janet has promised me that she isn?t going to engage in such monetary suicide.
The Fed is continuing with Ben Bernanke?s plan to run all of their Treasury bond holdings into expiration, even if it takes a decade to achieve this. And with deflation accelerating (see charts below), the need for such a desperate action is remote.
Still, one has to ponder the potential implications.
It all kind of makes my own 43% Trade Alert gain in 2015 look pretty good. But I don?t want to boast too much. That tends to invite bad luck and losses, which I would much rather avoid.
What! No QE?
https://www.madhedgefundtrader.com/wp-content/uploads/2015/11/Ship-Torpedoed-e1448310356189.jpg265400Mad Hedge Fund Traderhttps://madhedgefundtrader.com/wp-content/uploads/2019/05/cropped-mad-hedge-logo-transparent-192x192_f9578834168ba24df3eb53916a12c882.pngMad Hedge Fund Trader2015-11-24 01:08:272015-11-24 01:08:27Bring Back QE!
Asset allocation is the one question that I get every day, which I absolutely cannot answer.
The reason is simple: no two investors are alike. The answer varies whether you are young or old, have $1,000 in the bank or $1 billion, are a sophisticated investor or an average Joe, in the top or the bottom tax bracket, and so on.
This is something you should ask your financial advisor, if you haven?t fired him already, which you probably should.
Having said all that, there is one old hard and fast rule, which you should probably dump. It used to be prudent to own your age in bonds. So if you were 70, you should have had 70% of your assets in fixed income instruments and 30% in equities.
Given the extreme over valuation of all bonds today, and that we are probably on the eave of a 30-year bear market, I would completely ignore this rule and own no bonds.
Instead you should substitute high dividend paying stocks for bonds. You can get 4% a year or more in yields these days, and get a great inflation hedge, to boot. You will also own what everyone else in the world is trying to buy right now, high yield US stocks.
Allocation: Are You Him?
Or Him?
https://www.madhedgefundtrader.com/wp-content/uploads/2013/04/Regis-Philbin.jpg231187Mad Hedge Fund Traderhttps://madhedgefundtrader.com/wp-content/uploads/2019/05/cropped-mad-hedge-logo-transparent-192x192_f9578834168ba24df3eb53916a12c882.pngMad Hedge Fund Trader2015-11-24 01:06:242015-11-24 01:06:24What About Asset Allocation?
Expect to hear a lot about ignition in the next year. No, I don?t mean the rebuilt ignition for the beat up ?68 Cadillac El Dorado up on blocks in your front yard.
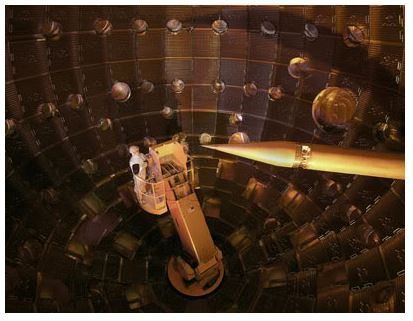
I?m referring to the inauguration of the National Ignition Facility next door to me at Lawrence Livermore National Labs in Livermore, California.
Mention California to most people, and images of love beads, tie died T-shirts, and Birkenstocks come to mind. But it is also the home of the hydrogen bomb, which was originally designed amid the vineyards and cow pastures of this bucolic suburb.
The thinking at the time was that if someone accidentally flipped the wrong switch, it wouldn?t blow up San Francisco, or more importantly, Berkeley.
The $5 billion project aims 192 lasers at a BB sized piece of frozen hydrogen, using fusion to convert it to helium and unlimited amounts of clean energy.
The heat released by this process reaches 100 million degrees, hotter than the core of the sun, and will be used to fuel conventional steam electric power plants.
There is no need for a four foot thick reinforced concrete containment structure that accounts for half the construction cost of conventional nuclear plants. The entire facility is housed in a large warehouse.
The raw material is seawater, and a byproduct is liquid hydrogen, which can be used to fuel cars, trucks, and aircraft. If this all sounds like it is out of Star Trek, you?d be right.
I worked with these guys in the early seventies, back when math was used to make things, and before it was used to game financial markets, and I can tell you, there is not a smarter and more dedicated bunch of people on the planet.
If it works, we will get unlimited amounts of clean energy for low cost in about 20 years. Oil will only be used to make plastics and fertilizer, taking the price down to $10 for domestic production only.
The crude left in the Middle East will become worthless. Lumps of coal will only be found in museums, or in jewelry, its original use. If it doesn?t work, it will melt the adjacent Mt. Diablo and take me with it.
If you don?t get your newsletter tomorrow, you?ll know what happened. Now what is this switch for?
https://www.madhedgefundtrader.com/wp-content/uploads/2013/04/Planetarium.jpg321413Mad Hedge Fund Traderhttps://madhedgefundtrader.com/wp-content/uploads/2019/05/cropped-mad-hedge-logo-transparent-192x192_f9578834168ba24df3eb53916a12c882.pngMad Hedge Fund Trader2015-11-23 01:07:262015-11-23 01:07:26The Fusion in Your Future
?We underestimated the negative impact of the slowdown in the housing market, and we may be underestimating the tail wind in its recovery,? said Uwe Mark Ruttke of Merrill Lynch, the top financial advisor in Colorado.
https://www.madhedgefundtrader.com/wp-content/uploads/2013/03/Recovery-Sign.jpg249364Mad Hedge Fund Traderhttps://madhedgefundtrader.com/wp-content/uploads/2019/05/cropped-mad-hedge-logo-transparent-192x192_f9578834168ba24df3eb53916a12c882.pngMad Hedge Fund Trader2015-11-23 01:05:172015-11-23 01:05:17November 23, 2015 - Quote of the Day
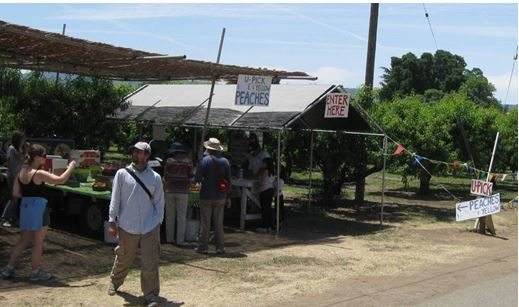
It?s another sign of the times when the weekend fruit picker population has doubled by people hard hit by the economy,?looking to save money on food costs.
After driving through miles of undulating brown hills studded with oak trees, passing mile upon mile of horse ranches, rusted out cars, and abandoned mobile homes, you come to Brentwood, the fruit capital of Northern California.
There, thousands of families, half from Asia, harvesting ripe Bing cherries and peaches at the wholesale price of $1 a pound, fruit that normally costs $6 a pound at the supermarket.
It all is a great opportunity to teach young kids the value of hard work, and where their food comes from. Anything you eat in the orchard is free, an old California tradition. No doubt none of these people are counted in the government?s employment statistics. It?s all a sign of the snowballing ?local? food movement, where California has been a leader.
It is all a great deal if you don?t mind having purple fingertips at the end of the day. Just watch out for the cars pulled over on the side of the road on the way home, their occupants puking out all their excess cherries.
In a nod to the 21st century, growers in this Grapes of Wrath industry compile lists of email addresses, and notify their itinerant fruit pickers which crops are ready for harvest via the internet. Also on the calendar this season are grapes, apples, apricots, plums, loquats, nectarines, mandarin oranges, and wheel chair accessible walnuts (?).
At the end of each harvest, professional crews sweep through and pick up what?s left, if the prices will bear it. If you wonder why we put up with the earthquakes, high taxes, gridlocked politics, and a non-functioning state government, this is the reason.
By the way, does anyone know what to do with 50 pounds of cherries? Send me your recipes.
https://www.madhedgefundtrader.com/wp-content/uploads/2014/02/Farmers-Market.jpg307519Mad Hedge Fund Traderhttps://madhedgefundtrader.com/wp-content/uploads/2019/05/cropped-mad-hedge-logo-transparent-192x192_f9578834168ba24df3eb53916a12c882.pngMad Hedge Fund Trader2015-11-19 01:07:052015-11-19 01:07:05Grapes of Wrath Redux
?The market always gets it right,? said Jim O?Neill, the chairman of Goldman Sachs International, who coined the term ?BRIC?.
https://www.madhedgefundtrader.com/wp-content/uploads/2013/04/Einstein.jpg273258Mad Hedge Fund Traderhttps://madhedgefundtrader.com/wp-content/uploads/2019/05/cropped-mad-hedge-logo-transparent-192x192_f9578834168ba24df3eb53916a12c882.pngMad Hedge Fund Trader2015-11-19 01:05:252015-11-19 01:05:25November 19, 2015 - Quote of the Day
Legal Disclaimer
There is a very high degree of risk involved in trading. Past results are not indicative of future returns. MadHedgeFundTrader.com and all individuals affiliated with this site assume no responsibilities for your trading and investment results. The indicators, strategies, columns, articles and all other features are for educational purposes only and should not be construed as investment advice. Information for futures trading observations are obtained from sources believed to be reliable, but we do not warrant its completeness or accuracy, or warrant any results from the use of the information. Your use of the trading observations is entirely at your own risk and it is your sole responsibility to evaluate the accuracy, completeness and usefulness of the information. You must assess the risk of any trade with your broker and make your own independent decisions regarding any securities mentioned herein. Affiliates of MadHedgeFundTrader.com may have a position or effect transactions in the securities described herein (or options thereon) and/or otherwise employ trading strategies that may be consistent or inconsistent with the provided strategies.