
?Bull markets don?t die, they are killed by central bankers,? said JJ Burns of JJ Burns & Co., an investment advisor.

?Bull markets don?t die, they are killed by central bankers,? said JJ Burns of JJ Burns & Co., an investment advisor.

Last week marked the one year anniversary of my Trade Alert Service, and subscribers could not be happier with the results. The first year return came in at 42.2%, putting us in the top one tenth of one percent of all hedge fund managers. By comparison, the S&P 500 Index came in wheezing with a moribund 1.3% gain during the same time period, which is hardly worth getting out of bed for.
It was off to the races on day one of my innovative online trade mentoring program. The strategies employed generated positive returns for my model portfolio all year, producing a continuous, stair stepping performance illustrated on the chart below that so many managers would kill for. I was able to generate this track record during one of the most volatile and difficult markets in history, when the indexes ratcheted up, down, and sideways in the most unpredictable and hair tearing manner possible. At the high for the year in early November, I was up over 47%.
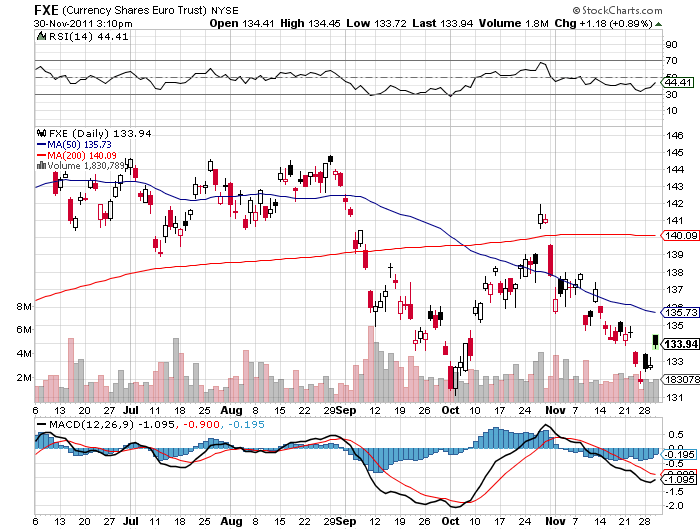
My home run trade for the year was a short position in the Swiss franc (FXF) in September, initiated just before the central bank devalued their currency and pegged it to a collapsing Euro, which brought in a welcome 9.07%. A call spread in Bank of America (BAC) that I strapped on right after the launch of QE2 and last year?s tax compromise made me 8.93%. A short position in the Euro (FXE) during the spring, right when the sovereign debt crisis exploded, seized a profit of 5.14%. I caught the Euro once again on the short side in the autumn melt down for another 5.35% profit.
It hasn?t all been fun and games. The bane of my existence in 2011 has been the (TBT), an ill-considered bet that long dated Treasury bonds will fall. While I made good money betting on rising bonds in the first half of the year, my failure to observe my own stop loss rules cost me 6.93% in the (TBT) in the second half. The Federal Reserve?s ?twist? policy certainly didn?t help, which my contacts there failed to warn me of in advance, probably because they opposed it. I also lost 4.96% with a long position in the S&P 500 right when the market was topping in July. Wasn?t it Shakespeare that said ?To err is human.?
For those who wish to participate in my Trade Alert Service, my highly innovative and successful online mentoring program, email John Thomas directly at madhedgefundtrader@yahoo.com . Please put ?Trade Alert Service? in the subject line, as we are getting buried in emails. Hurry up, because our software limits the number of subscribers, and we are running out of places.
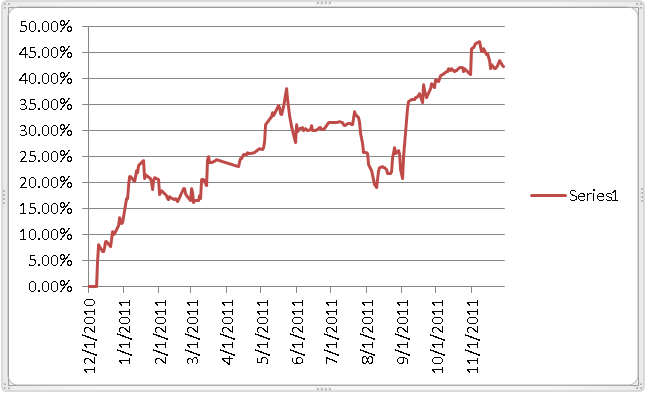
What a Year It?s Been!

The November nonfarm payroll came in at 120,000, better than the consensus. The unemployment rate plunged an eye popping 0.5% to 8.6%, the lowest level in 32 months and one of the sharpest contractions on record.
Some 140,000 private jobs were added, bringing the 32 month total to an even 3 million, an impressive feat given the arthritic pace of the growth in the US economy. Governments lost 20,000 jobs, a continuation of what I will believe will be a decade long trend of a shrinking public sector at the federal, state, and municipal levels.
Hiring by retailers was up 50,000, clearly gearing up for the Christmas season. Professional and business services gained 33,000 jobs, leisure and hospitality 23,000, and health care 17,000. As usual, construction led the losers, dropping 12,000 jobs.
There are now 13.3 million unemployed, down an amazing 594,000 from the previous month, with 5.7 million jobless for 6 months or longer. The numbers were boosted by a 300,000 drop in the job force as many simply gave up looking for work, thus artificially skewing the headline unemployment rate to the downside. The broader U-6 number shrank from 16.2 million to 15.6 million, putting the true unemployment rate at 10.1%.
The real news was hidden behind the headlines. The shocker here is that September and October were revised up for a total of 72,000, providing further proof that the September stock market swoon was discounting a double dip recession that was never there. Such is the value of tracking the raw economic data and ignoring the blabbering talking heads on TV who appear to sift all news through a political filter. It seems that when the job figures are bad, they believe them, and when they are good, they are rigged.
For some real insight on the long term trends driving the global economy, take a look at the chart below showing ?Percent Job Losses in Post WWII Recessions?.? It demonstrates that the current employment recovery is lagging past ones by about 5%. That works out to 7.5 million jobs. These were the jobs that were exported to China over the past decade and are never coming back, no matter how many promises are made by our political and business leaders.
The bottom line here is that you should expect our unemployment to remain structurally high for at least another decade, as it did in Germany during the eighties and nineties. After that, we will flip from a surplus to a shortage of workers as more favorable demographic trends finally start to kick in. So work those assumptions into your long term forecasting models.


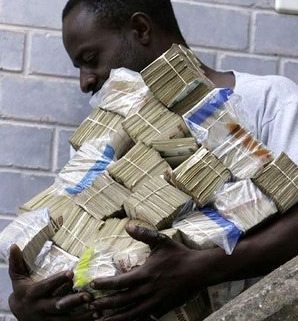
?If you measure the stock market not in dollars, but in gold, it is down 80% since 1999. I no longer regard the US dollar as a valid unit of account. People shouldn't value their wealth in dollars because one day, everyone will be billionaires,? said ultra-bear, Marc Faber, of the Gloom, Boom, and Doom Report.

Much of the fury in yesterday?s nearly 500 point ?melt up? in the Dow was generated by hedge funds panicking to cover shorts. Convinced of the imminent collapse of Europe, the impotence of governments, and the death spiral in sovereign bonds, many managers were running a maximum short position at the Monday opening, and for the umpteenth time, were forced to cover at a loss. Meet the new dumb money: hedge funds.
When I first started on Wall Street in the seventies, you heard a lot about the ?dumb money.? This was a referral to the low end retail investors who bought the research, hook-line-and-sinker, loyally subscribed to every IPO, religiously bought every top, and sold every bottom.
Needless to say, such clients didn?t survive very long, and retail stock brokerage evolved into a volume business, endlessly seeking to replace outgoing suckers with new ones. When one asked ?Where are the customers? yachts?, everyone in the industry new the grim answer.
Since the popping of the dot-com boom in 2000, the individual investor has finally started to smarten up. They bailed en masse from equities, seeking to plow their fortunes into real estate, which everyone knew never went down. Since 2008, the exit from equities has accelerated. There have been over $400 billion in redemptions of equity mutual funds, compared to $800 billion in purchases of bond funds.
Although I don?t have the hard data to back it, I bet the average individual investor is outperforming the average hedge fund in 2011. With such heavy weightings of bonds and cash, how could it be otherwise. While the current yields are miniscule, the capital gains have to be humongous this year, with yields plunging from 4% to 2%.
This takes me back to the Golden Age of hedge funds during the 1980?s. For a start, you could count the number of active funds on your fingers and toes, and we all knew each other. The usual suspects included the owl like Soros, the bombastic Robertson, steely cool Tudor-Jones, the nefarious Bacon, the complicated Steinhart, of course, myself, and a handful of others.
The traditional Wall Street establishment viewed us as outlaws, and believed that if the trades we were doing weren?t illegal, they should be, like short selling. Investigations and audits were a daily fact of life. It wasn?t easy being green.
It was worth it, because in those days, if you did copious research and engaged in enough out of the box thinking, you could bring in enormous profits with almost no risk. I used to call these ?free money? trades. To be taken seriously as a manager by the small community of hedge fund investors you had to earn 40% a year, or you weren?t worth the perceived risk. Annual gains of 100% were not unheard of.
Let me give you an example. In 1989, you could buy a warrant on a Japanese stock near parity, for $100 that gave you the right to own $500 worth of stock. You bought the warrant and sold short the underlying stock. Overnight yen yields then were at 6%, so 500% X 6% = 30% a year, your risk free return. If the stock then fell, you also made money on your short stock position. This was not a bad portfolio to have in 1990, when the Nikkei stock index plunged from ?39,000 to ?20,000 in three months, and some individual shares dropped by 80%.
Trades like this were possible because only a smaller number of mathematicians and computer geeks, like me, were on the hunt, and collectively, we amounted to no more than a flea on an elephant?s back. Today, there are over 10,000 hedge funds managing $2.2 trillion, accounting for anywhere from 50% to 70% of the daily volume.
Many of the strategies now can only be executed by multimillion dollar mainframe computers collocated next to the stock exchange floor. Winning or losing trades are often determined by the speed of light. And as the numbers have expanded exponentially from dozens to hundreds of thousands, the quality of the players has gone down dramatically, with copycats and ?wanabees? crowding the field.
The problem is that hedge funds are no longer peripheral to the market. They are the market, and therein lies the headache. How are you supposed to outperform the market when it means beating yourself? As a result, hedge fund managers have replaced the individual as the new ?dumb money, buying tops and selling bottoms, only to cover at a loss, as we witnessed on Monday.
The big, momentum breakout never happens anymore. This is seen in hedge fund returns that have been declining for a decade. The average hedge fund return this year is a scant 1%. Make 10% now and you are a hero, especially if you are a big fund. That hardly justifies the 2%/20% fee structure that is still common in the industry.
When markets disintegrate into a few big hedge funds slugging it out against each other, no one makes any money. I saw this happen in Tokyo in the 1990?s, when hedge funds took over the bulk of trading. Volumes shrank to a shadow of their former selves, and today, Japan has fallen so far off the radar that no one cares what goes on there. Japanese equity warrants ceased trading by 1995.
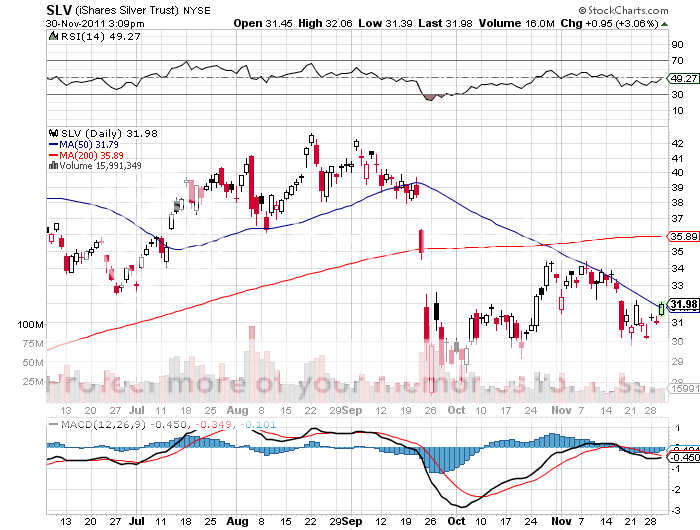
How does this end? We have already seen the outcome; that investors flee markets run by hedge funds and migrate to those where they have less of an impact. That explains the meteoric rise of trading volumes of other assets classes, like bonds, foreign exchange, gold, silver, and other hard assets.
Hedge funds are left on their own to play in the mud of the equity markets as they may. This will continue until hedge fund investors start departing in large numbers and taking their capital with them. The December redemption notices show this is already underway. Just ask John Paulson.

Oops! That Wasn?t in the Game Plan
-

How About 2% and 20%?

?Don?t get greedy. Don?t expect much. This is a single and double type of market. You?ve got to play it this way,? said Jeffrey Kleintop, a market strategist at LPL Financial.

The world?s major central banks launched a coordinated attempt to restore liquidity to the financial markets today, sending risk assets everywhere flying. The group moved to substantially lower interbank dollar swap rates, from 100 to 50 basis points. These swaps involve Federal Reserve dollar deposits with the European Central Bank and offsetting ECB Euro deposits with the Fed.
This eases liquidity concerns inside the European money markets. The action included the Federal Reserve, the ECB, the Swiss National Bank, the Bank of Japan, and the Bank of Canada. Clearly, the Europeans do not have a 2008 style systemic collapse on the menu.
The initiative made sure the bear trap that sprung on Monday bit even deeper into short sellers, as it was intended to do. The Dow (INDU) opened up 300, the (FXE) 1.54%, oil $1.50, silver 1.53%,? Australian dollar (FXA) a stunning 2.5 cents, and copper (CU) 12 cents. Bellwether Caterpillar (CAT) popped 5.3%, while my favorite, Freeport McMoRan leapt by 6.3%. The action assures that my call for a Christmas rally in global risk assets plays out, although earlier than I expected.
You really have to wonder what disaster was imminent to force the central bankers? hands. Many suspect that a major European bank was on the verge of going under, possibly a French one. So far, the major casualties have been American institutions, notably MF Global (MF) and Jeffries (JEF). It will take a few months for the truth to leak out.
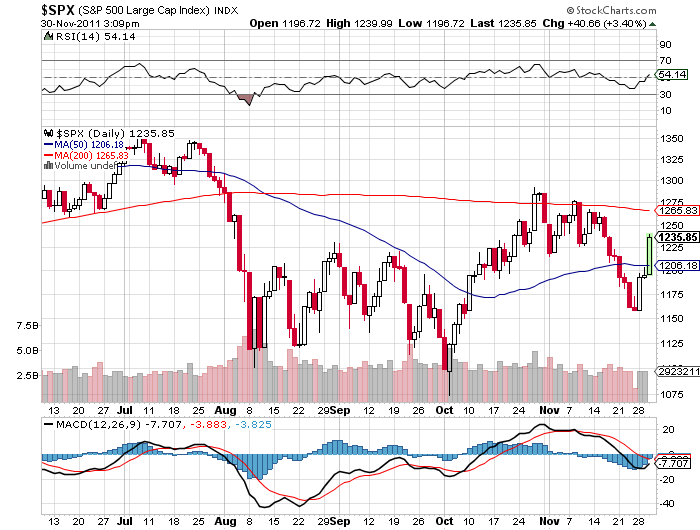
The coordinated action puts my short term 1,266 target for the S&P 500 within easy reach. The big moves we were seeing in oil and the Australian dollar gave us plenty of warning that Santa Claus might show up early this year, but it is nice to get confirmation.
As for the Euro, the positive benefits are likely to be ephemeral, as the European bazooka is just a short term patch and does nothing to address the continent?s horrific systemic problems. I am therefore happy to keep running my outstanding euro short position.

Looks Live He Arrived Early This Year
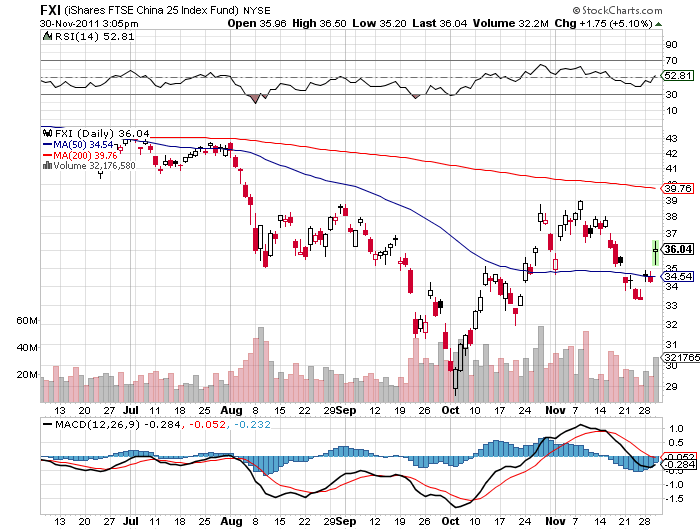
For the first time in three years, China (FXI) has cut its prime lending rate by 50 basis points. The timing caught many analysts by surprise, as such move was not expected until the lunar new year in early February. Perhaps recent data showing collapsing exports prompted the Mandarins in Beijing to hurriedly move up the timetable.
The Middle Kingdom?s action is one of the most important developments in financial markets this year, since it represents a major sea change, and is hugely positive for the global economy. It could signal a coming year of additional incremental interest rate cuts and bank reserve reductions designed to keep the country above the ?red line? GDP growth rate of 8%. Observers were also stunned by the magnitude of the cut, 50 basis points, compared to the usual 25 basis point move seen by the People?s Bank of China.
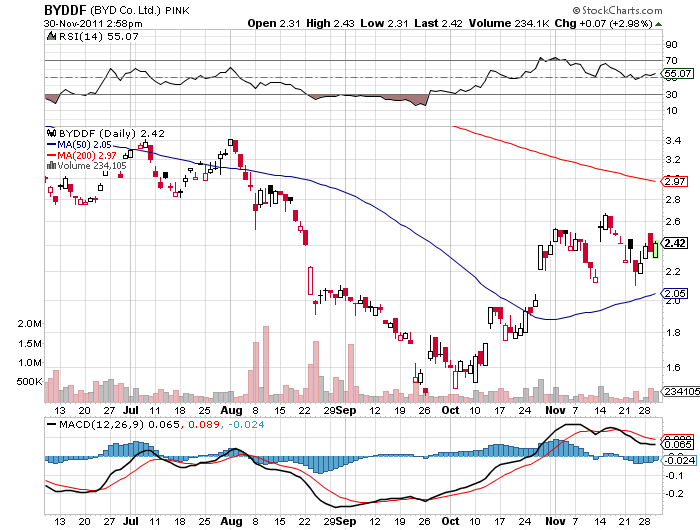
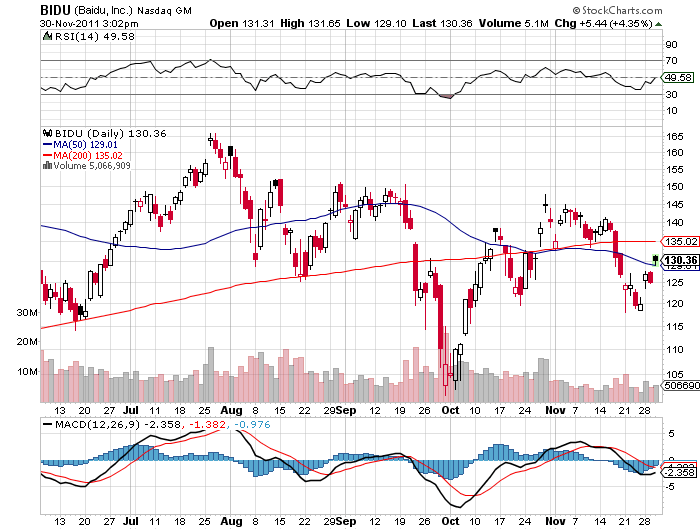
I have been comfortably out of Chinese equities for more than a year, vowing not to return to the mainland until interest rates fell. Now the worm has turned. It may be time to take another look at companies like Build Your Dreams (BYDDF), which has risen by 50% since my undercover visit there last month. Other names like China Telecom, China Mobile, and Baidu (BIDU), are also starting to look interesting.

We Want Lower Interest Rates!
Mark Fisher of MBF Asset Management and Dennis Gartman of the eponymous Gartman Letter joined forces today to launch a new exchange traded note, or ETN, that promises to capture the ?RISK ON? trade. The instrument is designed as an improvement over the old Volatility Index ETF where traders attempted to capture short term market swings.
The note has the following makeup:
longs
48% energy
46% equities
30% foreign currencies
18% agricultural commodities
10% metals
shorts
36% sovereign bonds
14% foreign currencies
While the first day trading volume was large and the timing propitious, with the Dow up 300 points at the opening, the note presents several risks. The exact definition of ?RISK OFF? evolves by the day, and the quarterly resets and rebalancing?s may not be frequent enough to catch the changes. This is why the fund sponsors kept gold out of the mix, which morphed from a ?RISK OFF? asset in the first half into a solidly ?RISK ON? one in the second half, and could well change gender once more.
There is also the problem of rolls, backwardations, and contangos, which have long bedeviled ETF?s in the commodities area, such as with the one for oil (USO) and natural gas (UNG). Tracking error can be problematic for these kinds of funds, which offer carry hefty management and administration fees. This could attract opportunistic hedge funds which are already coining it shooting against existing commodity and leveraged ETF?s.
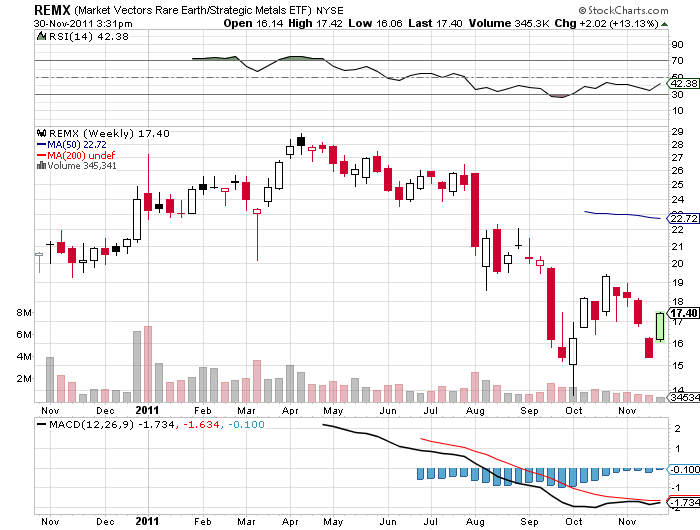
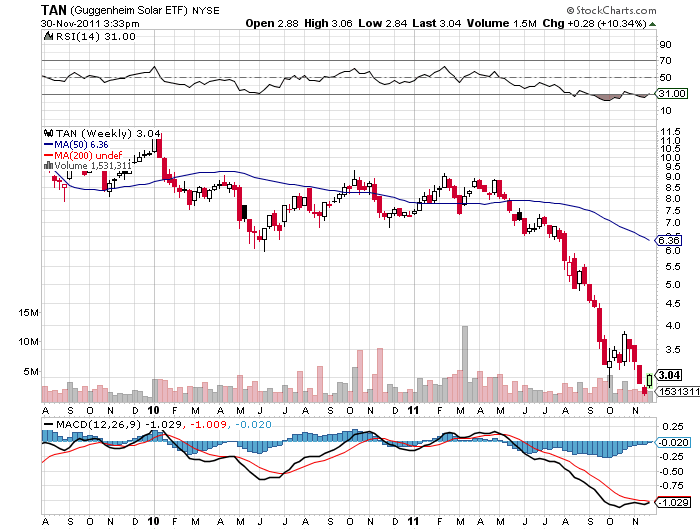
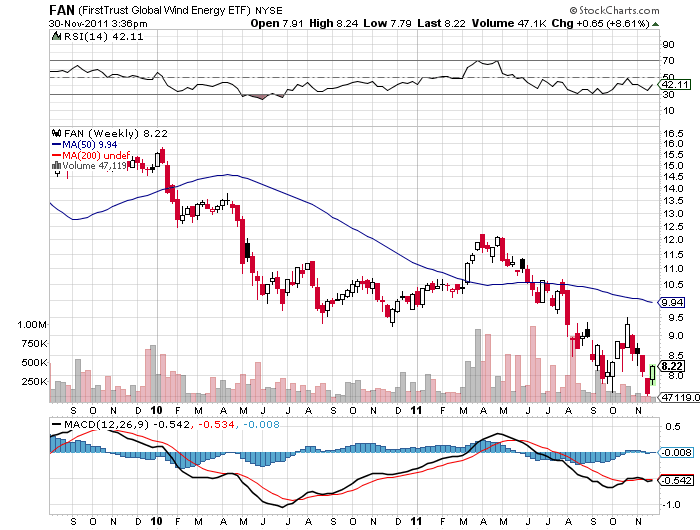
I wish Dennis and Mark the best of luck with their new endeavor. But another thing that scares me is that new ETF?s often come out at market tops to cash in on market fads. Look no further than the disastrous rare earth (REMX), wind (FAN), and solar (TAN) ETF?s, which plunged not long after launch. Could this mark the end of the ?RISK ON?/?RISK OFF? parameter that has served me so well in recent years? Better to execute your own ?RISK ON?/?RISK OFF? trades simply by reading this letter and taking the trade alerts.

Don?t Follow the Lemmings
My worst fears about the deteriorating state of the US residential housing market were confirmed today with the release of the closely watched Case-Shiller Home Price Index. Nationwide, Q3 delivered a 3.9% decline in home prices, hot on the heels of a whopping 5.8% plunge in Q2. Most markets are at 8-10 year lows with the exception of Detroit, which is plumbing a new 20 year low.
Negative equity cities, and indeed, entire states, are proliferating like wildfire. The data give even more strength to the bleaks forecasts I delivered in my recent November 16 piece on the subject, ?Why Residential Real Estate Will Not Recover.?
The market took no prisoners. Year on year falls were greatest in Atlanta (-9.8%), Minneapolis (-7.4%), Las Vegas (-7.3%), and Tampa (-6.7%). The closest Q3 haircuts were seen in Atlanta (-5.9%), San Francisco (-1.5%), Tampa (-1.5%), and Las Vegas (-1.4%). What is going on in Atlanta? Haven?t they heard that the Civil War is over and they can stop burning the city? The only green figure was seen in Washington DC, which saw a 1% YOY gain, buoyed by an every rising tide of spending by the government and the lobbyists there to grease the works.
There seems to be a generational migration towards rental housing underway. New families are not being formed at past rates, as unemployed adult children living rent free in parents? basements do not exactly make hot marriage candidates. Almost all new construction has been shifted to multifamily dwellings. In San Francisco I have seen condo projects converted midstream into rentals before buildings are even finished to satisfy the new demand.
If you followed my advice years ago and unloaded your dwelling, why should you care about any of this? There is not a chance that the banks have taken a further 25% decline in home prices into their plans. Collapsing house prices brings collapsing banks, but this time congressional gridlock assures there will be no TARP and no bail outs. Goodbye financial system. This is what bank share prices are screaming at us, which look like grim death warmed over.
I would spend more time looking for great deals in the real estate market. But quite honestly, it is kind of a downer spending your Sunday afternoon visiting an open house, only to find the listing agent hanging from the shower head. Rent, don?t buy.

Not Exactly a ?BUY? Signal for Housing