Come join me for lunch for the Mad Hedge Fund Trader?s Global Strategy Update, which I will be conducting in London on Monday, June 23, 2014. A three course lunch will be followed by a PowerPoint presentation and an extended question and answer period.
I?ll be giving you my up to date view on stocks, bonds, currencies commodities, precious metals, and real estate. And to keep you in suspense, I?ll be throwing a few surprises out there too. Enough charts, tables, graphs, and statistics will be thrown at you to keep your ears ringing for a week. Tickets are available for $258.
I?ll be arriving an hour early and leaving late in case anyone wants to have a one on one discussion, or just sit around and chew the fat about the financial markets.
The lunch will be held at a private club on St. James Street, the details of which will be emailed to you with your purchase confirmation.
I look forward to meeting you, and thank you for supporting my research. To purchase tickets for the luncheons, please go to my online store.

Global Market Comments
June 16, 2014
Fiat Lux
Featured Trade:
(LAST CHANCE TO ATTEND THE JUNE 17 NEW YORK STRATEGY LUNCHEON),
(DIAMONDS ARE STILL AN INVESTOR?S BEST FRIEND),
(SO YOU THINK THEY?RE NOT WATCHING YOUR PC?)

Come join Mad Day Trader Jim Parker and I for lunch at the Mad Hedge Fund Trader?s Global Strategy Luncheon, which we will be conducting in New York, NY on Tuesday, June 17, 2014. An excellent three course lunch will be provided. A PowerPoint presentation will be followed by an extended question and answer period.
I?ll be giving you my up to date view on stocks, bonds, foreign currencies, commodities, precious metals, and real estate. And to keep you in suspense, I?ll be throwing a few surprises out there too. Enough charts, tables, graphs, and statistics will be thrown at you to keep your ears ringing for a week. Tickets are available for $248.
The formal luncheon will run from 12:00 to 2:00 PM. I?ll be arriving an hour early and leaving late in case anyone wants to have a one on one discussion, or just sit around and chew the fat about the financial markets.
The event will be held at a prestigious private club on Central Park South, the details of which will be emailed to you with your purchase confirmation.
I look forward to meeting you, and thank you for supporting my research. To purchase tickets for the luncheons, please go to my online store.

Global Market Comments
June 13, 2014
Fiat Lux
Featured Trade:
(JUNE 18 GLOBAL STRATEGY WEBINAR),
(JULY 11 SARDINIA, ITALY STRATEGY LUNCHEON)
(BE CAREFUL WHO YOU SNITCH ON),
(COULD YOU QUALIFY TO BECOME A US CITIZEN?)
Global Market Comments
June 12, 2014
Fiat Lux
(TAKING OFF FOR EUROPE)
Global Market Comments
June 11, 2014
Fiat Lux
Featured Trade:
(MAD HEDGE FUND TRADER TOPS 2014 GAIN OF 17.8%),
(AAPL), (GOOG), (TLT), (FXY),
(THE BEST STOP LOSS OF THE YEAR), (VXX), (SPY),
(JUNE 17 NEW YORK STRATEGY LUNCHEON)
Apple Inc. (AAPL)
Google Inc. (GOOG)
iShares 20+ Year Treasury Bond (TLT)
CurrencyShares Japanese Yen Trust (FXY)
iPath S&P 500 VIX ST Futures ETN (VXX)
SPDR S&P 500 (SPY)
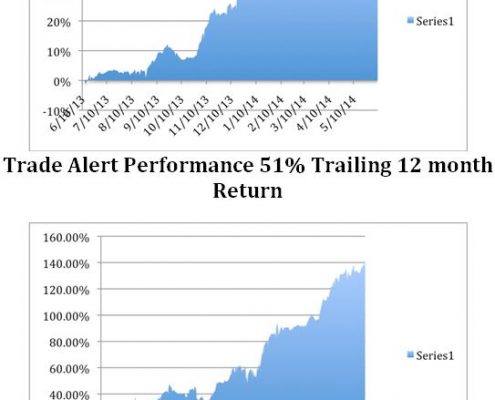
The industry beating performance of the Mad Hedge Fund Trader?s Trade Alert Service has punched through to a new all time high almost every day for the past ten days.
The total return for my followers so far in 2014 has reached 17.82%, compared to a far more modest 4.6% for the Dow Average during the same period. June so far is up a healthy 2.32%.
I managed to pull this off during some of the most difficult trading conditions in market history. Turnover across all asset classes is hitting decade lows (see chart below), and volatility has crashed through the floor.
The three and a half year return is now at an amazing 140.32%, compared to a far more modest increase for the Dow Average during the same period of only 38%.
That brings my averaged annualized return up to 40.1%. Not bad in this zero interest rate world. It appears better to reach for capital gains than the paltry yields out there.
This has been the profit since my groundbreaking trade mentoring service was first launched in 2010. Thousands of followers now earn a full time living solely from my Trade Alerts, a development of which I am immensely proud of.
Like most of the industry, I expected May and June to be poor months for risk assets. The market has had a tremendous run over the last two years, and the spring historically heralds a period of seasonal weakness.
Wrong!
One of the toughest things to do in this business is to admit you?re wrong, and then execute an immediate risk reversal in your portfolio.
In the end, the failure of the market to fall meant that it could only go up. We got additional help from month end window dressing, calming events in the Ukraine, and a 7:1 share split at Apple.
What really sent stocks off to the races was the European Central Bank?s surprise move to implement negative interest rates for overnight deposits and expansion of quantitative easing. The moves should add 0.5% to global GDP growth this year.
That?s all I needed to pile into long positions in Caterpillar (CAT), IBM (IBM), Microsoft (MSFT), and JP Morgan (JPM). The move also enabled me to take profits in Apple (AAPL) and cover my short in the Japanese yen and the Treasury bond market (TLT). I continue to run an existing long on Google (GOOG).
Quite a few followers were able to move fast enough to cash in on the move. To read the plaudits yourself, please go to my Testimonials Page. They are all real, and new ones come in almost every day.
My esteemed colleague, Mad Day Trader Jim Parker, was no slouch either. He slapped on a short in the euro (FXE) and a long in the grains (JJG), both of which immediately turned profitable.
What would you expect with a combined 85 years of market experience between the two of us? Followers are laughing all the way to the bank.
Don?t forget that Jim clocked an amazing 2013 with a staggering 374% trading profit. That was just for an eight-month year!
The Opening Bell with Jim Parker, a quickie but insightful webinar giving followers an instant snapshot of the market opening every day, has been an overwhelming success. Many customers have already reported dramatic improvements in their trading results.
Watch this space, because the crack team at Mad Hedge Fund Trader has more new products and services cooking in the oven. You?ll hear about them as soon as they are out of beta testing.
Our business is booming, so I am plowing profits back in to enhance our added value for you. Next out will be the Mad Hedge Fund Trader Channel on YouTube that will enable me to post videos from my frequent travels around the world.
The coming year promises to deliver a harvest of new trading opportunities. The big driver will be a global synchronized recovery that promises to drive markets into the stratosphere by the end of 2014.
Global Trading Dispatch, my highly innovative and successful trade-mentoring program, earned a net return for readers of 40.17% in 2011, 14.87% in 2012, and 67.45% in 2013.
Our flagship product,?Mad Hedge Fund Trader PRO, costs $4,500 a year. It includes my Global Trading Dispatch?(my trade alert service and daily newsletter). You get a real-time trading portfolio, an enormous research database, and live biweekly strategy webinars. You also get Jim Parker?s?Mad Day Trader?service and?The Opening Bell with Jim Parker.
To subscribe, please go to my website at www.madhedgefundtrader.com, find the ?Global Trading Dispatch? or ?Mad Hedge Fund Trader PRO? box on the right, and click on the blue ?SUBSCRIBE NOW? button.


Traders throughout the industry have been left with their jaws hanging open in the wake of the complete collapse of volatility for the S&P 500 (SPY). When the volatility hit the $10 handle a few days ago, it was the lowest level in nearly a decade.
Especially hard hit has been the iPath S&P 500 VIX Short Term Futures ETN (VXX), which has cratered from $56 to $30, some 46%, just since February. I had a bet on last month that this note would hold its multiyear lows around $40.
Think again.
When it broke my 5% rule for non-leveraged instruments, I pulled the ripcord and stopped out at $37.80, paring 1.68% off of my 2014 performance. The (VXX) then went into free fall, breaking $30.
If I was stubborn, insisted that I was right and the market wrong, and shouted at the sea not to rise, like King Canute, this position would have cost me a heart breaking 8.66%. To quote the legendary economist and early hedge fund trader, John Maynard Keynes, ?Markets can remain irrational longer than you can stay solvent.?
What has been killing the (VXX) has been the contango in the futures market. The managers buy three-month (VIX) futures at higher implied volatilities, and ride them into expiration, when much lower implied volatilities prevail. For example, today, you can buy September volatility for $16, while June is only $11.
The (VXX) managers then roll their cash into the next batch of three-month futures and repeat the process. It is, in effect, a perfect money destruction machine. This is why the (VXX) has plummeted from an all time high of $8,000 to $30 in just five years. S&P 500 volatility has declined from $90 to $11 during the same time.
Why did I recommend purchase of such a suicidal instrument? Because during periods of market weakness, like you normally get in May, you can see dramatic pops in the price of the (VXX) as long only institutions rush to buy downside protection, sometimes on the order of 25%-50%.
Except, this time it was different. It really has been one of those abnormal, mean diverging kind of years, from day one.
It is all a lesson on the value of stop losses. I tell people I practice this discipline because I am too old to go back to Morgan Stanley broke, and start all over again. They probably wouldn?t have me anyway, I am so prone to farting in church.
You may have other reasons.


![Skateboard Fall]() So it Wasn?t Such a Great Time to Trade Volatility
So it Wasn?t Such a Great Time to Trade Volatility

Global Market Comments
June 10, 2014
Fiat Lux
Featured Trade:
(JULY 25 ZERMATT, SWITZERLAND GLOBAL STRATEGY SEMINAR),
(IT?S ?RISK ON? AGAIN),
(SPY), (CAT), (IBM), (JPM), (MSFT), (AAPL),
(TLT), (TBT), (MUB), (LQD), (LINE), (ELD), (FXE),
(ABOUT THAT TESLA RECOMMENDATION), (TSLA)
SPDR S&P 500 (SPY)
Caterpillar Inc. (CAT)
International Business Machines Corporation (IBM)
JPMorgan Chase & Co. (JPM)
Microsoft Corporation (MSFT)
Apple Inc. (AAPL)
iShares 20+ Year Treasury Bond (TLT)
ProShares UltraShort 20+ Year Treasury (TBT)
iShares National AMT-Free Muni Bond (MUB)
iShares iBoxx $ Invst Grade Crp Bond (LQD)
Linn Energy, LLC (LINE)
WisdomTree Emerging Markets Local Debt (ELD)
CurrencyShares Euro Trust (FXE)
Tesla Motors, Inc. (TSLA)
Come join Mad Day Trader Jim Parker and I for lunch at the Mad Hedge Fund Trader?s Global Strategy Luncheon, which we will be conducting in New York, NY on Tuesday, June 17, 2014. An excellent three course lunch will be provided. A PowerPoint presentation will be followed by an extended question and answer period.
I?ll be giving you my up to date view on stocks, bonds, foreign currencies, commodities, precious metals, and real estate. And to keep you in suspense, I?ll be throwing a few surprises out there too. Enough charts, tables, graphs, and statistics will be thrown at you to keep your ears ringing for a week. Tickets are available for $248.
The formal luncheon will run from 12:00 to 2:00 PM. I?ll be arriving an hour early and leaving late in case anyone wants to have a one on one discussion, or just sit around and chew the fat about the financial markets.
The event will be held at a prestigious private club on Central Park South, the details of which will be emailed to you with your purchase confirmation.
I look forward to meeting you, and thank you for supporting my research. To purchase tickets for the luncheons, please go to my online store.