'The seller has an upper hand, as a girl might if she were the only female at a party attended by many boys. That lopsided situation would be great for the girl, but terrible fort the boys,' ' said 'Oracle of Omaha', Warren Buffet, CEO and the largest shareholder in Berkshire Hathaway.

Featured Trades: (QE2 JUST ENDED EARLY), (DIG), (JJG), (AAPL)
1) QE2 Just Ended Early. Many observers believe that the massive sell off that we have seen in global equity markets are purely the result of the Great Sendai Earthquake. Fat chance. I think the earthquake is masking the true causes of the liquidation, the end of Ben Bernanke's quantitative easing.
When the market would start discounting the demise of this free lunch for all asset classes and the hedge funds that trade them has been one of the great guessing games this year in the financial markets. Up until last week it was thought that the weakness since February was just another dip to buy into the great liquidity bubble. But no more.
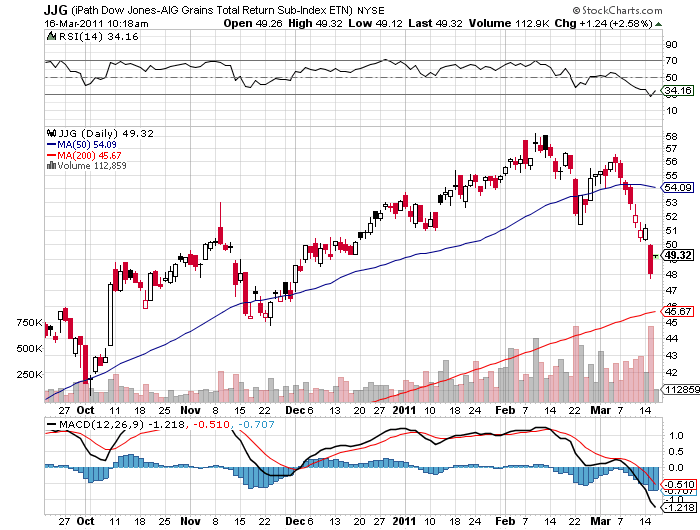
You can see this in the violence and the severity of the sectors that have sold off the most. The ones that flaunted the biggest gains since QE2 started in August are now suffering the worst of the damage. Look no further that my favorite sectors, which were all heavily owned by hedge funds, and now being mercilessly dumped.
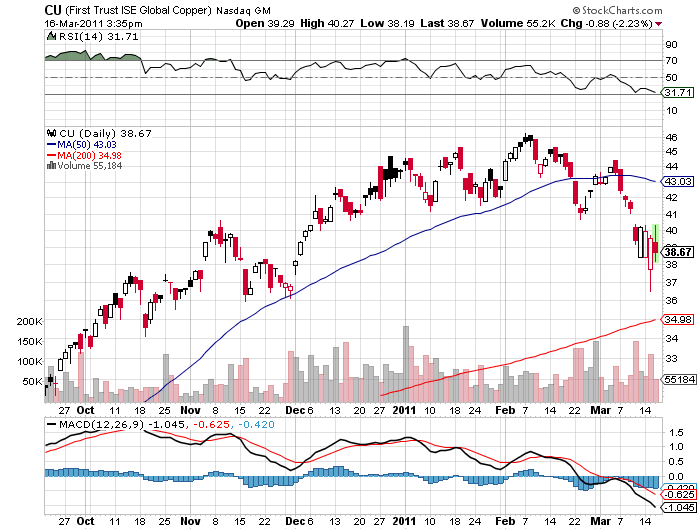
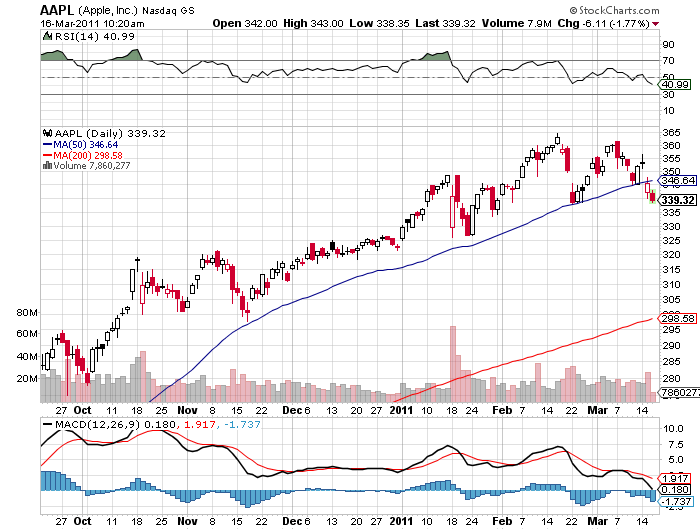
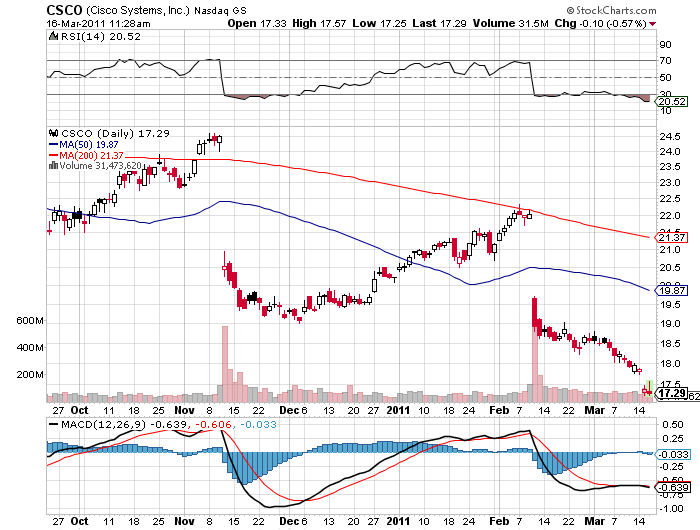
In a mere two weeks, my energy play (DIG) plunged 16%, the grain ETF (JJG) is off 17%, while technology bellwether Apple (AAPL) has taken a 7% hickey. The double top in the Apple chart is particularly ominous. And look at Cisco Systems (CSCO) where we snagged a double on a call spread and exited post haste. My friend, Dr. Copper, seems to have taken and extended vacation, with its ETF (CU) off 20%. Ouch!
Regular readers of this letter know that I have been expecting this and have been judiciously scaling out of long since the end of January.
The implication is that this sell off may continue longer and go farther than many traders realize. What will be the next driver to take stock prices skyward? QE3? You must be smoking something. The political balance in Washington will permit no more support for the economy. Tax cuts? We have already gorged ourselves on these for the next two years.
Rising earnings? Coming off a great quarter, forecasts going forward are being ratcheted downward, thanks to the earthquake. I think people will be amazed when they discover how much US manufacturing is dependent on high value added, irreplaceable Japanese parts, from autos to electronics.
I don't think the abundant 'crash' gurus are going to get any satisfaction this year either. The news is bad, but it is not that bad. We are far more likely to die of ice than fire. Sounds like it may be a good time to sell out of the money calls on equities everywhere.
-

More Likely to Die from Ice That Fire
-
-
-
-
Watch Closely. He's About to do a Disappearing Act
Featured Trades: (NUCLEAR POWER STOCKS), (CCJ), (NLR), (GE)
2) The True Story on Nuclear Power. Having once worked for the Atomic Energy Commission at the Nuclear Test Site in Nevada, I do have some insights into the melt down at Fukushima. The media is wallowing in an orgy of misinformation that is approaching epic proportions. This is what happens when you rely on journalism and English majors for your analysis of nuclear physics, and throw in a dollop of fear and emotion for good measure.
For a start, the General Electric (GE) design of the six Fukushima plants succeeded. With the earthquake now upgraded to a 9.0 on the Richter scale, these facilities withstood an earthquake ten times greater than their maximum design specification. Thank goodness for Japanese engineering. The design of these plants, lacking a graphite core, makes a Chernobyl type disaster impossible. Nothing is going to explode; the fuel used is too diluted.
The four foot thick reinforced concrete containment structures for three of the six reactors have blown up after a buildup of hydrogen of gas. After pumping sea water in to cool the reactors, these facilities are toast and will never be used again. It is likely that fuel rods have melted together, as they did at Three Mile Island. All that means is a very expensive, multi billion dollar cleanup for operator Tokyo Electric Power, the largest utility in Japan. Remote robots will have to be used. But that is tough luck for the shareholders in this unlucky company, whose stock has cratered some 60% since the disaster started, not you are or, or China or India.
The initial cooling system failed when the earthquake knocked out the power grid in Northern Japan. Then the backup diesel generators that kicked in where flooded by the tidal wave. The amount of radiation released so far has been insignificant, just some low emitting particles of cesium, iodine, and strontium. Almost all of this will get rained into the ocean and dissipated.
While it is true that some of this will be measurable on roof tops in the US in a few days, keep in mind that these instruments are so sensitive the can capture a single atom. I laugh when I hear of panic buying of iodine tablets by the public, as is going on in the San Francisco Bay area today. You are more likely to suffer from the radon radiation in your basement.
The obvious question to ask is whether this will lead to a huge buying opportunity in the nuclear industry. There is understandably concern about the risks of nuclear power in the US in the wake of the Fukushima melt downs. But the US is not the market for responsible for the growth of nuclear power and its fuel. China and India are. China alone plans to build 100 new reactors over the next ten years to become the world's largest producer. If anything, they are accelerating their nuclear program, thanks to higher oil prices. Its energy demands are so immense, they have little choice.
Could it be that nuclear phobia has driven these stocks far below their economic value? I think so. Take a look at Cameco (CCJ), the world's largest listed uranium producer, and the ETF (NLR). The next headline coming out of Japan could be that the fires are out and the threat neutralized, which could send these stocks soaring.

-

-
![]()
Is This a Buy Signal?
-
![]()
-

Looks Like Utilities Were Not as Safe as You Thought
Featured Trades: (THE VOLATILITY SPIKE), (VIX)
3) The Volatility Spike. For those of you who have not seen a volatility spike happen before, this is what it looks like up close and ugly. This is why many hedge funds keep a long volatility position on their back book as a kind of diaster insurance. Well, the rainy day have arrived.
Those who took my advice to buy the volatility index (VIX) in January at $17, your day has arrived. It is time to take profits and sell you calls, call spreads, and outright long positions, if you have not already done so. Once the (VIX) spikes, it doesn't live up here forever.
And whatever you do, don't go short. Once this thing gets the bit in its teeth there is no telling high high it will go. Last year's high was 49% on the 'flash crash' day, and we saw 89% at during the March, 2009 stock market collapse.

-

-

'ECB president Jean-Claude Trichet is dangerous. It is ridiculous to talk about raising rates when these countries are so weak. You really only have a recovery in one country, and that is in Germany,' said my old mentor, Barton Biggs, founder and managing partner of the giant hedge fund Traxis Partners.

Featured Trades: (PARIS STRATEGY LUNCHEON)
Note To Subscribers: For anyone who upgrades from the Diary of a Mad Hedge Fund Trader daily newsletter to the Macro Millionaire trading service this month, the first $100 will be donated to the Japanese Red Cross for earthquake relief. I have been in touch with its officials and the money is sorely needed. Thanks for your support. '?John Thomas.
1) April 8 Paris Strategy Luncheon. Come join me for lunch for at the Mad Hedge Fund Trader's Global Strategy Update, which I will be conducting in Paris, France on Friday, April 8, 2011. A three course lunch will be followed by a 45 minute PowerPoint presentation and a 45 minute question and answer period.
I'll be giving you my up-to-date view on stocks, bonds, currencies commodities, precious metals, and real estate. And to keep you in suspense, I'll be throwing a few surprises out there too. Enough charts, tables, graphs, and statistics will be tossed at you to keep your ears ringing for a week. Tickets are available for $289.
I'll be arriving an hour early and leaving late in case anyone wants to have a one on one discussion, or just sit around and chew the fat about the financial markets.
The lunch will be held at a prestigious private club in the City of Light's central Opera district, the details of which will be emailed to you with your purchase confirmation.
I look forward to meeting you, and thank you for supporting my research.

Featured Trades: (WHAT THE EARTHQUAKE MEANS FOR THE US MARKET)
2) What the Japanese Earthquake Means for the US Market. I went into the Japanese earthquake positioning for a big 'RISK OFF' trade, and it now looks like we are getting it in spades. The black swans are alighting.
So how much damage is the US in for?
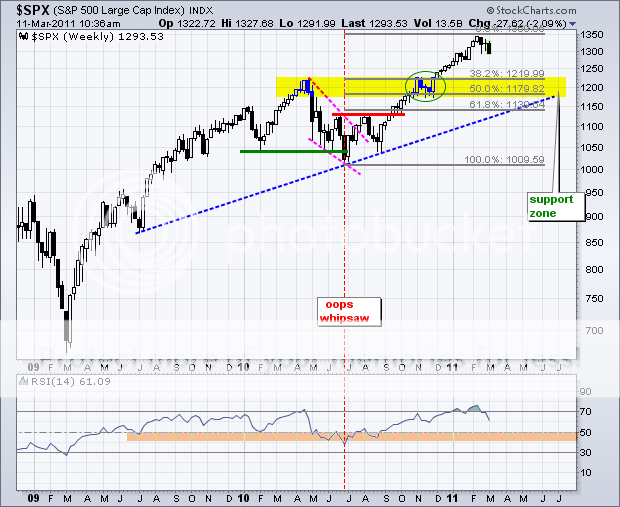
My bet is that the S&P 500 is going to get slapped around a few times, and may even get a severe spanking, but it is not taking a trip to the mortuary any time soon. Take a look at the chart below, which outlines a number of different support levels for the closely watched big cap stock index.
The nearest and most conservative of these appears at 1,220. This is a combination of a 38.2% Fibonacci retracement of the recent move up, banging into the April-November, 2010 double top. Below that, stronger support kicks in at 1180, 1130, and the August, 2010 low at 1010. In view of the 0.50% that has just been knocked off of the global economic growth as a result of the disaster in Sendai, the first target will be met within the next six weeks. That equates to about $124 in the ETF (SPY). That should sit well with my Macro Millionaire friends, who are currently long a (SPY) $128-$124 bear put spread that expires on April 17.
A 1220 bottom would give us a 9% correction from the February 20 top. That is a normal winter correction for the type of bull market we have been enjoying for the past two years. Keep in mind, we might see the last 30 points of this in a one day spike down, which may then immediately recover. Those looking for a major crash will have to wait until next year, or 2013 at the latest.
To get lower than that, we are going to need more bad news. Given the preponderance of black swans we have seen this year, I don't think that will be a problem. Don't forget, the Bernanke put and QE2 expire in 10 weeks, and the chances of a reprieve are about nil. That's when the sushi may really hit the fan.
-

EMERGENCY JAPAN EARTHQUAKE UPDATE
Featured Trades: (EWJ), (FXY), (YCS), (TLT), (SPY), (VIX), (USO)
1) I just got off the phone with several frightened, somewhat dazed survivors of the Japanese earthquake who work in the financial markets, and I thought it important to immediately pass on what they said. Some were clearly terrified.
Japan's economic outlook now appears far more dire than I anticipated only a day ago. It looks like GDP growth rate is going to instantly flip from +2% to -3%, a swing of -5%, similar to what we saw after the Kobe earthquake in 1995.? We have just had a 'V' shaped economy dumped in our laps, and we have just embarked on a precipitous down leg. Two very weak quarters will be followed by two strong ones. The initial damage estimate is $60-$120 billion, and that will certainly rise.
Kobe had a larger immediate impact because of its key location as a choke point for the country's rail and road transportation networks and ports. But the Sendai quake has affected a far larger area. Magnifying the impact is the partial melt down at the Fukushima Dai Ichi nuclear power plant, forcing the evacuation of everyone within a 12 mile radius.
Most major companies, including Toyota, Nissan, Honda, and Sony have shut down all domestic production. Management want to tally death tolls, damage to plant and equipment, and conduct emergency safety reviews. In any case, most employees are unable to get to work because of the complete shutdown of the rail system. Tokyo's subway system is closed, stranding 25 million residents there.
Electric power shortages are a huge problem. The country's eight Northern prefectures are now subject to three hour daily black outs and power rationing, including Tokyo. That has closed all manufacturing activity in the most economically vital part of the country.
Panic buying has emptied out every store in the major cities of all food and bottled water. Gas stations were cleaned out of all supplies and reserves, since much of Japan's refining capacity has been closed. There are 20,000 expatriates waiting at Tokyo's Narita airport as foreign companies evacuate staff to nearby financial centers in Hong Kong and Singapore. Airlines are diverting aircraft and laying on extra flights to accommodate the traffic.
The Tokyo Stock Exchange absolutely took it on the nose on Monday morning. Trading lasted exactly four minutes until, with the TOPIX Index down 7%, the circuit breakers kicked in. Most lead blue chips were down 10%, and 175 stocks never opened. Only construction stocks were up. Most of the selling was being done by foreign institutions and hedge funds, locals having vacated this market ages ago. This could be the beginning of a new bear market that will last for many months.
Prime Minister Naoko Kan has asked the Bank of Japan 'to save the country.' The central bank responded promptly with ?15 trillion, or $187 billion worth of credit market purchases. The yen spiked at the opening, as I expected, to ?81.4, as carry trades were unwound en masse. Then the BOJ showed its heavy hand, slapping it back down to ?82.2 where it has sat since. They appear to be taking on all comers at this price, and have the printing presses to fall back on. The situation remains fluid.
My global macro call proved spot on. Oil is down $2, plunging to a two week low below $100/barrel, blindsided by shrinking Japanese demand. Equities were sold worldwide. Uranium miners in Australia took a particular pounding, as the nuclear crisis casts a long shadow over this reviving energy source. Insurers were unloaded in London and Zurich. The S&P 500 opened down 10 points to 1,295 in the futures markets, close to Friday's low.

It looks like we are seeing the first multiple partial nuclear meltdowns in history. But a professor at nearby UC Berkeley tells me this is more of repeat of Three Mile Island, where half the fuel rods melted, than Chernobyl, where they all did. Small amounts of low radiation cesium and iodine have already been released, which should be measurable on American roof tops in about ten days. Neighboring countries are enforcing radiation testing of all food imports from Japan.

The death toll is certain to ratchet up considerably. Seaside villages that have been wiped off the face of the earth don't return phone calls. Japan's maritime self-defense forces are scouring the seas off of Sendai, rescuing a lucky few clinging to floating debris.
Finally, I wish to thank the many who sent me emails of concern, aware of my long family ties to Japan. Everyone is safe as they were fortunately out of the country when the disaster struck, or did not live in the worst affected areas.
Further updates to follow.
'In order to make money in the market, you have to be an independent thinker,' said hedge fund titan Ray Dalio of Bridgewater Associates.

Featured Trades: (THE BEAR MARKET IN BONDS TAKES A BREATHER), (TLT), (TBT)
2) The Bear Market in Treasury Bonds Takes a Breather. I have been a huge bear on the Treasury bond market, much to the delight of my readers for the past six months, who have made fortunes from this advice. I know that I have said that you must sell every rally for the next ten years. But markets have to breathe, and nothing ever moves in a straight line.
I therefore believe that the bear market in bonds is about to take a brief rest. Ben Bernanke's QE2 has resulted in massive buying of long dated Treasury bonds, and I think he will be sitting on the bid all the way up to the last day of the program on June 30. This will provide some support for bonds for at least three more months.
I also think that all asset classes generally, and equities specifically, will be subject to some profit taking and a 'RISK OFF' trade in coming months.
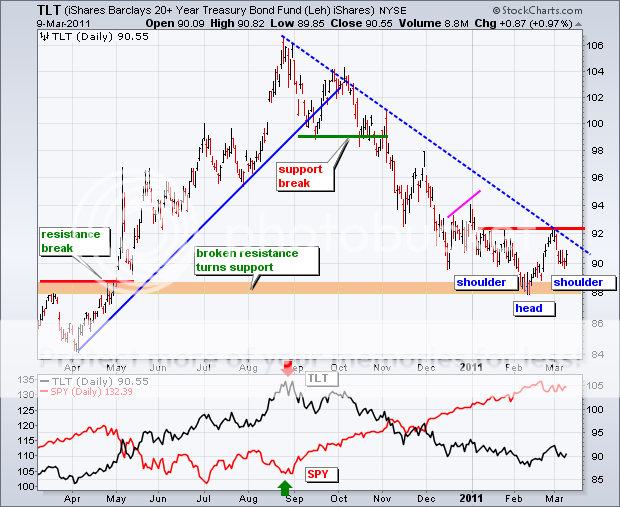
This could generate a flight to safety bid for government paper. It won't be off to the races for Treasuries. I'm looking for a rally of only a handful of points. That is why I'm not bothering actually going long bonds. Perish the thought. Take a look at the chart below, which shows that a short term 'head and shoulders' bottom may be developing for long term Treasury bonds. This is what the markets are struggling to tell us.
I happen to know that several big hedge funds are taking advantage of these market conditions by selling short near dated puts on 10 and 30 year Treasury bond futures. One of the purposes of this newsletter is to keep you informed about what the big boys are doing. This is what they are doing. We are running a fairly light book these days, so you should have plenty of room to accommodate a trade like this. If you are lacking clearance for level four options trading and are unable to execute a trade like this then just watch and learn.
If you are unable to short the puts outright, you might consider buying the (TLT) on a dip outright, with an eye towards picking up a few points. But keep in mind that this is a higher risk lower return trade, the kind I try to avoid. It also requires a pretty fine ability to trade the market short term, which may be beyond the means of many of you. A long position makes nothing at all if the (TLT) doesn't move, while the short puts trade reaches its maximum point of profitability.
The best case scenario for the short put trade is for the Treasury bond market to hold it together for three more months, and then go to hell in a hand basket after your short puts expire. Then you can merrily skip back over to the short side and reinvest your new profits.

Even Bears Need to Take a Rest
-
-

Always Nice to Know What the Big Boys Are Doing