Market Outlook for the Week Ahead, or So That's a Correction!
I like Thanksgiving.
I like the turkey, the gravy, the cranberry sauce, and especially the pumpkin and mince pies loaded with whipped cream.
I like Thanksgiving so much that I got to repeat it last week. For that is how far back I have to go, some four months, to find the stock prices that cheap that printed on Friday.
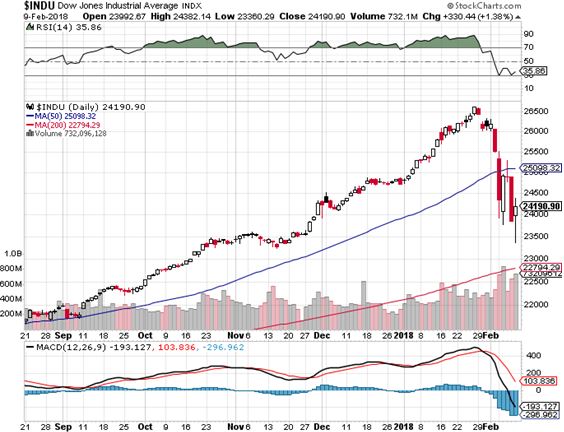
It was the most violent week in the history of stock markets, with the Dow average suffering two 1,000-point swan dives, and two intraday 1,000-point rallies.
Never in history has the Dow made an all-time high, then plunged 13.33% in only ten trading days, some 3,300 points. Entire classes of securities were entirely wiped out.
It was like watching a Netflix movie at 16X fast forward. You saw a week???s worth of price action in an hour.
After enjoying the best January in 21 years, we got hit in between the eyes with the fifth worst February since the (SPY) was created in 1923.
Add up all the up and down moves of the week, and they add up to a staggering 22,000 points.
We went from a long overdue correction to a correction that is seriously overdone, in the blink of an eye.
So this is my retirement?
The last time markets suffered the current level of volatility, they were facing the 2008 Financial Crisis crisis:
The stock market fell 52%.
The top 20 US banks were effectively bankrupt.
All credit markets were frozen.
ATM???s across the country came within a week of shutting down.
The housing market was in free fall.
Bernie Madoff was discovered to have stolen $50 billion from his clients.
Unemployment hit 12%.
Today, conditions are a little different:
The stock market is within 13.33% of an all-time high, and is 400% higher than the 2009 low.
The top 20 US banks are the best capitalized in the world.
Bond prices are close to all-time highs, and interest rates at lows.
There is a national structural shortage of homes.
Companies in almost every industry are reporting record profits.
A small, specialized, niche ETN blew up, causing $1.5 billion in losses.
The unemployment rate is at 4.1% and falling.
Is there something wrong with this picture?
The market action is in no way reflective of America???s current economic backdrop.
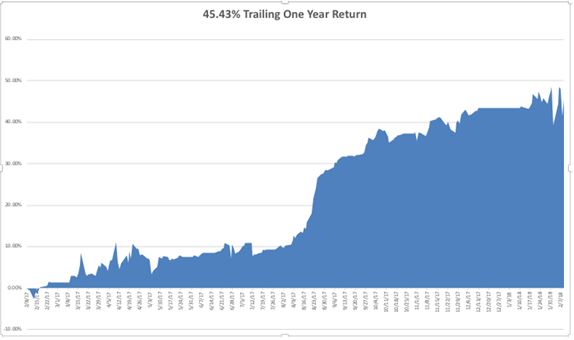
I probably delivered the best trading week of my career. On the huge down days there was always a brief 200-point rally that allowed me to stop out of my highest risk short dated option positions.
I then used the giant 1,000-point dives to add long dated positions much deeper in-the-money in the highest quality technology. They are throwing the babies out with the bathwater, and I am catching the babies with a net. It worked like a charm, with my year to date performance still in positive territory.
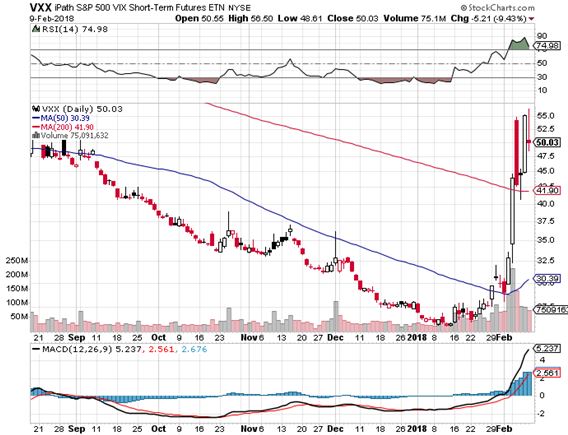
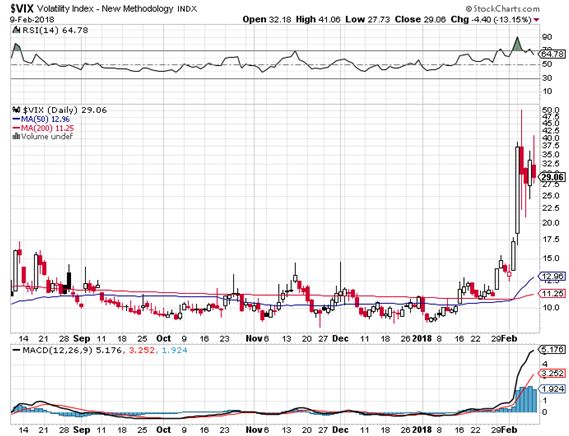
The ballsiest trade of the week was my bet that the IPath S&P 500 VIX Short Term Futures ETN (VXX) would fall from $55, a six-month high, while the Volatility Index (VIX) flirted with the $37 level.
After all, the best time to sell flood insurance is right after a category five hurricane has destroyed everything and bankrupted all the other insurers.
You would think this was Mad, as the entire short (VIX) industry went bust only two days before. But then, that???s what you pay me to do, come up with these impossible trades, which then magically work.
I ran the numbers, and with the (VIX) futures for April trading at a lowly $18, I thought it was worth a shot. So far, so good. The (VIX) closed on Friday at $29.06, while the (VXX) dropped to $50.
I then made a major bet that the 200-day moving average for the (SPY) would hold, triggering a massive institutional rally. It did, and the mark roared 600 Dow points.
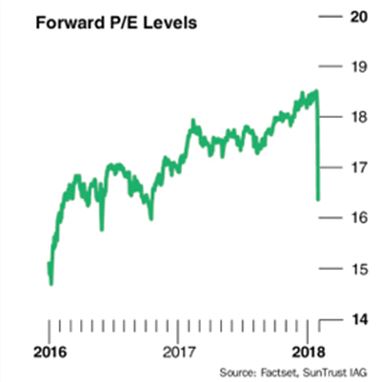
I figured that without a recession the 200-day is where the major institutions would come in on the buy side. After all the (SPY) Price earnings multiple has just cratered from 19X to 16X, or back to 2016 levels. By the way, Apple???s PE level is down to a subterranean 14X.
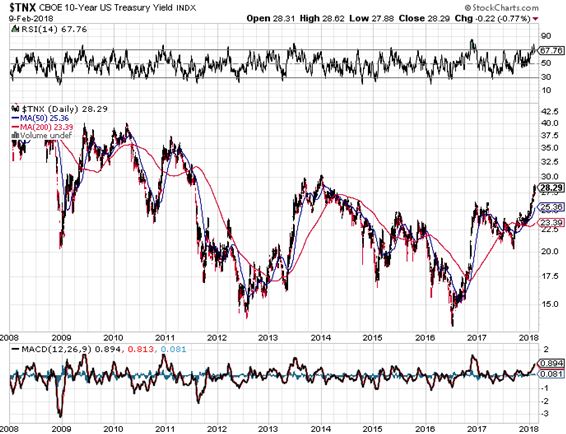
Certainly, this is enough to compensate them for a ten year Treasury yield that has just soared from 2.03% to 2.90% and on its way to 3.25%.
A note on the (XIV) trade. I have taken this off the position sheet pending a legal settlement with Credit Suisse. Interestingly, they have been buying up the (XIV) in the open market at the $5-$6 level to reduce their legal liability.
Hedge funds have also been buying, looking for a 10:1 return on any potential settlement. When I learn more, I will adjust our year-to-date performance numbers accordingly.
I have to tell you that this has been a heck of a week for the staff of the Mad Hedge Fund Trader. We launched the Mad Hedge Technology Letter a week ago, doubling our work load. Then, the market crashed, doubling our workload again. All this happened while we all had the flu.
Kudos to the staff of the Mad Hedge Fund Trader!
Economic data and corporate earnings are now completely meaningless as long as the market is facing a??historic liquidity crisis. However, I shall go through the motions.
We are now well into Q4 earnings season so those should be the dominant data points of the coming weeks.
On Monday, February 12, nothing of note takes place, except for a stock market opening that should be a real hair raiser.
On Tuesday, February 13 at 6:00 AM the NFIB Small Business Optimism Index comes out. ??
On Wednesday, February 14, at 8:30 AM EST, we get the all-important Consumer Price Index, crucial now that inflation is a concern.
Thursday, February 15 leads with the 8:30 AM EST release of the Weekly Jobless Claims. January Industrial Production follows at 9:30.
On Friday, February 16 at 8:30 AM EST, we learn the January Housing Starts.
At 1:00 PM we receive the Baker-Hughes Rig Count, which saw a monster rise of 22 last week.
As for me, I am going to spend the entire weekend going over charts, running numbers on options spreads, looking for the best way to commit my remaining capital in the coming weeks.
With my Mad Hedge Market Timing Index at an eye-popping number of ten, this is the lowest risk, highest return time to buy stocks within the last three or nine years, depending on how you do the math.
Friday night, I took a break from the financial carnage to watch the Winter Olympics opening ceremony at PyeongChang, South Korea. I only got as far as Belarus before I passed out from exhaustion.