Global Market Comments
May 8, 2019
Fiat Lux
SPECIAL GOLD ISSUE
Featured Trade:
(THE ULTRA BULL ARGUMENT FOR GOLD),
(GLD), (GDX), (ABX), (SLV), (PALL), (PPLT)
(TESTIMONIAL)
Global Market Comments
May 8, 2019
Fiat Lux
SPECIAL GOLD ISSUE
Featured Trade:
(THE ULTRA BULL ARGUMENT FOR GOLD),
(GLD), (GDX), (ABX), (SLV), (PALL), (PPLT)
(TESTIMONIAL)
Global Market Comments
May 7, 2019
Fiat Lux
Featured Trade:
(HOW TO EXECUTE A VERTICAL BULL CALL SPREAD)
(AAPL)
(THE CODER BOOM)
Global Market Comments
May 6, 2019
Fiat Lux
Featured Trade:
(MARKET OUTLOOK FOR THE WEEK AHEAD, OR HERE’S ANOTHER BOMBSHELL),
(DIS), (QQQ), (AAPL), (INTU), (GOOGL), (LYFT), (UBER), (FCX))


I was all ready to write this week that massive monetary stimulus created by the Federal Reserve will cause the stock market to continue its slow-motion melt up.
The president had other ideas.
As of this writing, the US will impose without warning a surprise 25% increase in tariffs on $200 billion worth of Chinese imports, effective Friday, or in four days.
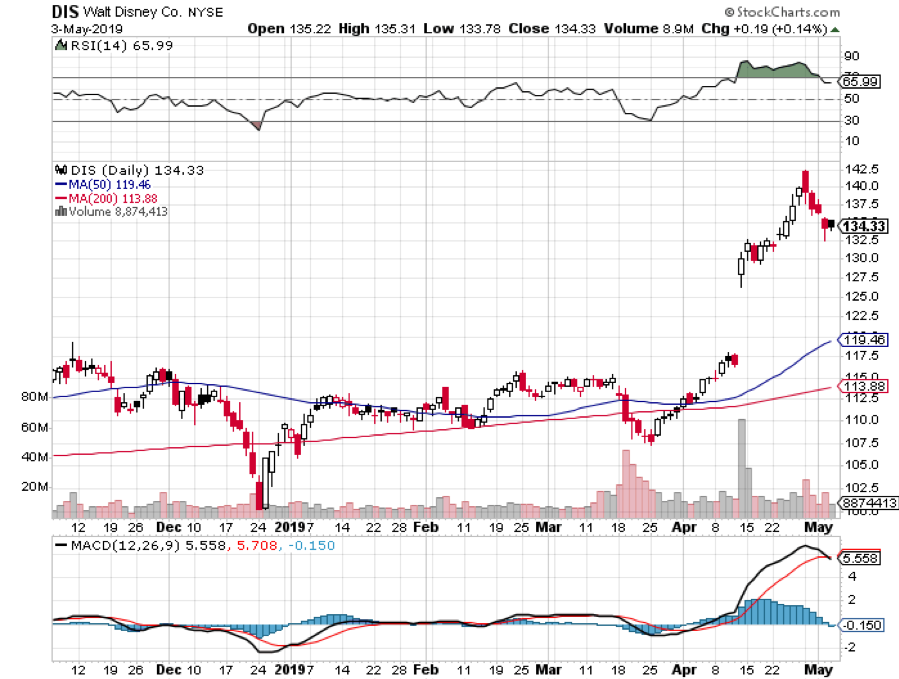
Clearly, the trade negotiations are not going as well as advertised by the administration. My bet is that the stock market won’t like this. All I can say is that I’m glad I’m 90% in cash and 10% in a Walt Disney vertical bull call spread that expires in nine trading days.
The bigger and unanswerable question is whether this is just a negotiating strategy already well known by the Bronx Housing Authority that sets up a nice dip to buy? Or is it this the beginning of a long overdue summer correction?
Nobody knows.
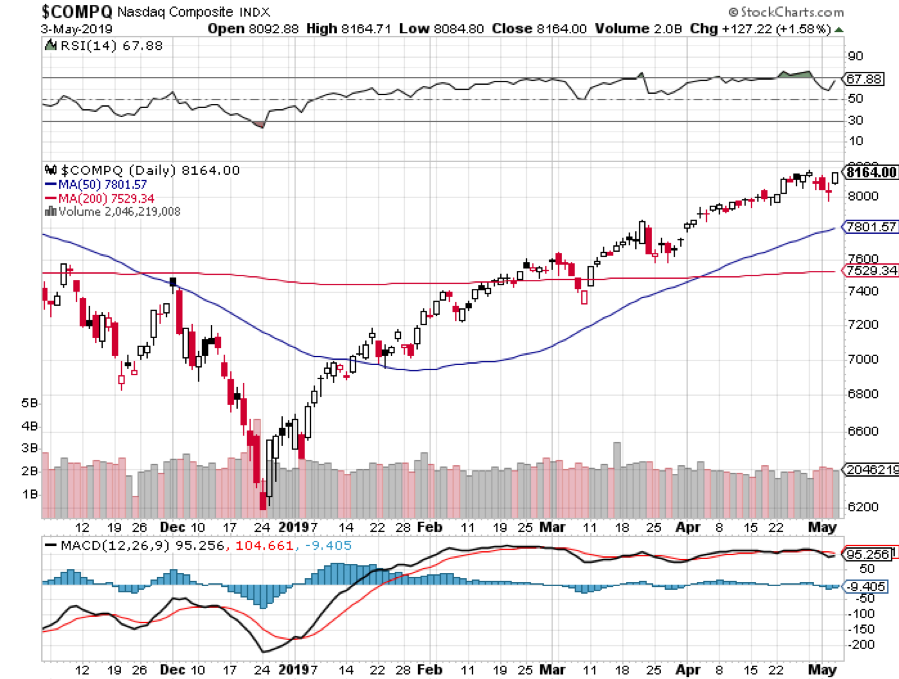
Certainly, the rally was getting long in the tooth, rising almost every day in 2019, with NASDAQ reaching new all-time highs. Those who kept their big-cap technology stock through the sturm und drang of the December meltdown have been rewarded handsomely. Index players reigned supreme.
However, we live in unprecedented times. Never before has a stock market received this much artificial stimulus at an all-time high unless you hark back to the Tokyo 1989 top. Japanese shares are now trading at 43% lower than that high….30 years later. We all know that our own decade-old bull market will eventually end in tears, but will it be in days, weeks, months, or years?
I had plenty of great wisdom, wonderful sector selections, colorful witticisms, and killer stock picks to serve up to you this week, but they have all be outrun by events. There’s nothing to do now but wait and see how the market responds to this tariff bombshell at the Monday morning opening.
After three months of decidedly mixed data, the information flow on the economy suddenly swung decidedly to the positive. The jobs data could have been more positive.
Of course, the April Nonfarm Payroll Report was a sight to behold. It came in at 263,000, about 80,000 more than expected, and more than makes up for last month’s dismal showing. It was a bull’s dream come true. This is what overheating looks like fueled by massive borrowing. Play now, pay later.
The headline Unemployment Rate fell a hefty 0.2% to 3.6%, the most since 1969 when the Vietnam War was raging, and the economy was booming. I remember then that Levi Strauss (LEVI) was suffering from a denim shortage then because so much was being sent to Southeast Asia to use as waterproof tarps. Wages rose 3.2% YOY.
Professional and Business Services led at a massive 76,000 jobs, Construction by 33,000 jobs, and Health Care by 27,000 jobs. Retail lost 12,000 jobs.
The ADP came in at a hot 275,000 as the private hiring binge continues. Then the April Nonfarm Payroll Report blew it away at 263,000. The headline unemployment rate plunged to a new 49-year low at 3.6%.
Consumer Spending hit a decade high, up 0.9% in March while inflation barely moved. Is Goldilocks about to become a senior citizen?
Apple (AAPL) blew it away with a major earnings upside surprise. The services play is finally feeding into profits. Stock buybacks were bumped up from $100 billion to $150 billion. Don’t touch (AAPL) up here with the stock just short of an all-time high. How high will the shares be when Apple’s revenue split between hardware and software revenues is 50/50?
Pending Home Sales jumped 3.8% on a signed contract basis. No doubt the market is responding to the biggest drop on mortgage rates in a decade. At one point, the 30-year fixed rate loan fell as low as 4.03%. Avoid housing for now, it’s still in a recession.
Topping it all off, the Fed made no move on interest rates. Like this was going to be a surprise? This may be the mantra for the rest of 2019. The big revelation that the Fed will start ending quantitative tightening now and not wait until September, as indicated earlier. More rocket fuel for the stock market. Let the bubble continue.
Uber (UBER) hit the Road for its IPO with valuations being cut daily, from a high of $120 billion to a recent low of $90 billion. The issue goes public on Friday morning. Rival Lyft (LYFT) definitely peed on their parade with their ill-fated IPO plunging 33%.
It wasn’t all Champaign and roses. San Francisco home prices fell for the first time in seven years. The median price is now only $830,000, down 0.1% YOY. Back up the truck! Clearly a victim of the Trump tax bill, this market won’t recover until deductions for taxes are restored. That may take place in two years….or never!
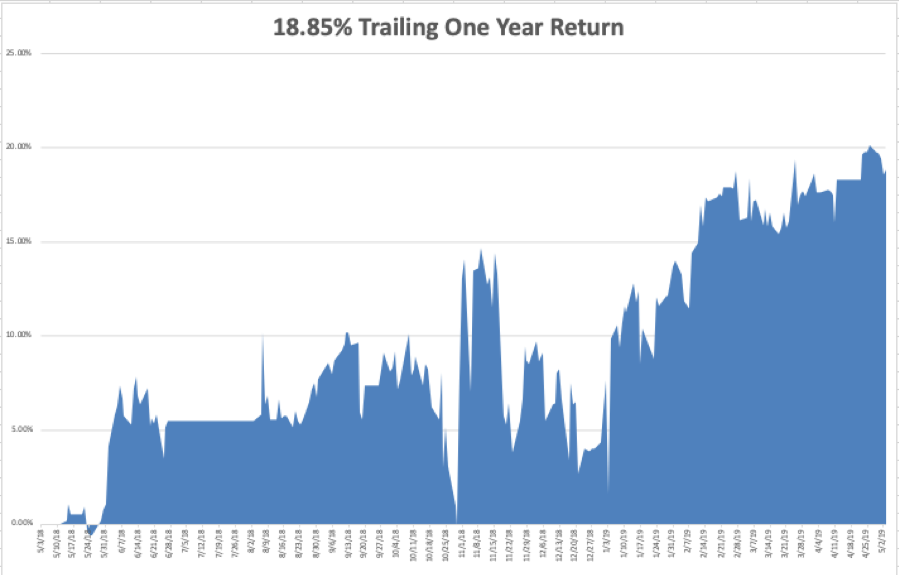
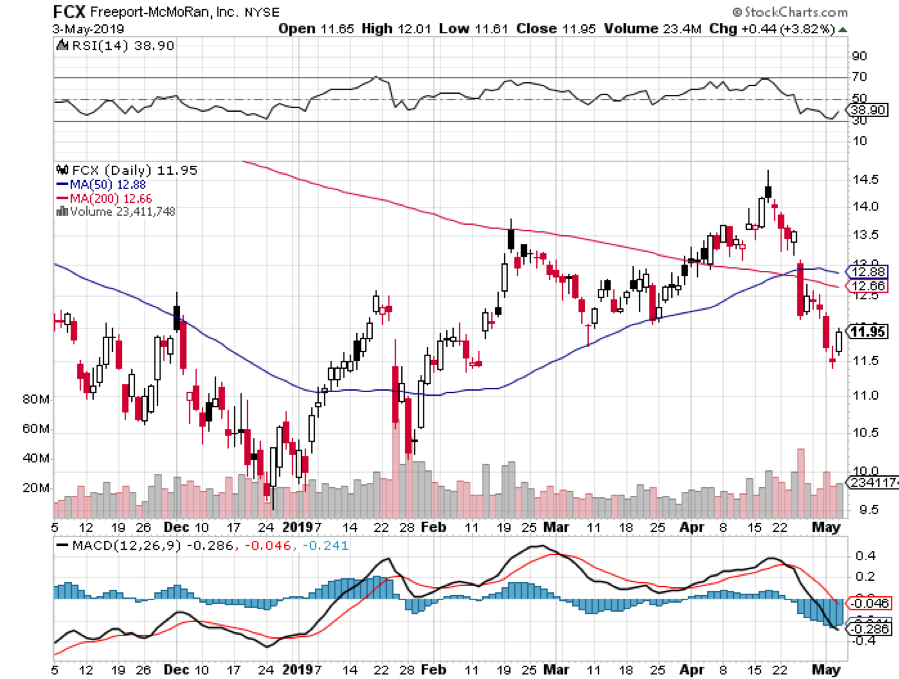
The Mad Hedge Fund Trader suffered a modest setback with the sudden collapse of copper prices last week, thus giving up all its profit in Freeport McMoRan (FCX). Global Trading Dispatch closed the week up 14.48% year to date and is down -1.48% so far in May. My trailing one-year retreated to +18.85%.
Reflecting the huge sector divergence in the market, the Mad Hedge Technology Letter leaped to another new all-time high on the back of two new very short-term positions in Intuit (INTU) and Google (GOOG), which we picked up after the earnings debacle there. Some 11 out of 13 Mad Hedge Technology Letter round trips have been profitable this year.
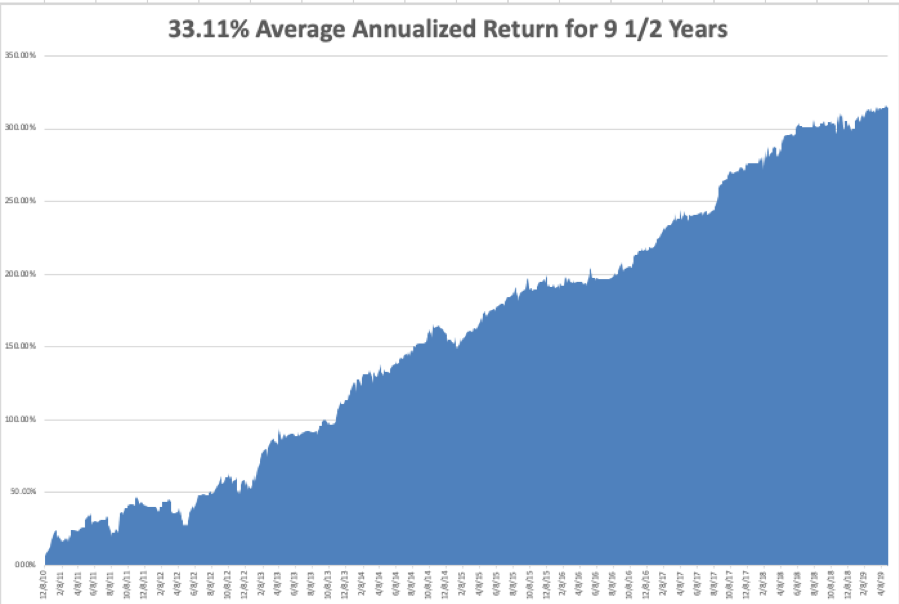
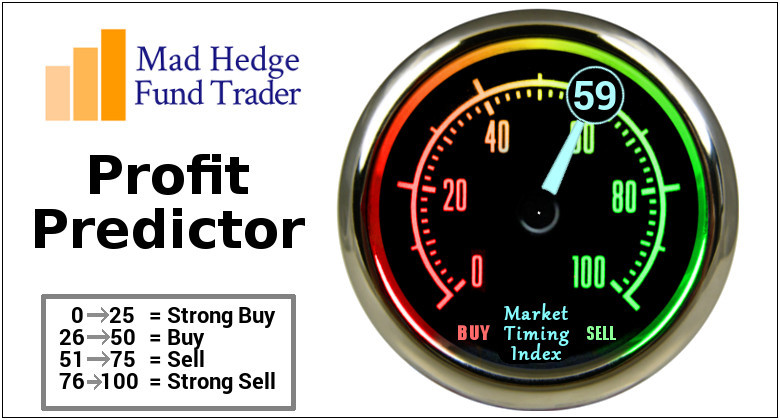
My nine and a half year profit shrank to +314.62%. The average annualized return backed off to +33.11%. With the markets at all-time highs and my Mad Hedge Market Timing Index forming a 2 ½ month high, I am now 90% in cash with Global Trading Dispatch and 80% cash in the Mad Hedge Tech Letter.
The coming week will be pretty boring after last week’s excitement, at least on the hard data front.
On Monday, May 6, Occidental Petroleum (OXY), now engaged in a ferocious takeover battle for Anadarko, reports. So does (AIG).
On Tuesday, May 7, 3:00 PM EST, we obtain March Consumer Credit. (LYFT), one of the worst performing IPOs this year, gives its first ever earnings report.
On Wednesday, May 8 at 2:00 PM, we get the most important earnings report of the week with Walt Disney (DIS), along with (ROKU).
On Thursday, May 9 at 8:30 the Weekly Jobless Claims are produced. At the same time, we get the March Producer Price Index. Dropbox (DBX) reports.
On Friday, May 10 at 8:30 AM, we get the Consumer Price Index. The Baker-Hughes Rig Count follows at 1:00 PM. (UBER)’s IPO will be priced at the opening. Viacom (VIA) Reports.
As for me, I’ll be watching the Kentucky Derby on Saturday. The field is wide open, now that the favorite, Omaha Beach, has been scratched.
As I will be attending the Las Vegas SALT conference during the coming week, the Woodstock of hedge fund managers, I will take the opportunity to rerun some of my oldies but goodies. We also have recently enjoyed a large number of new subscribers so I will be publishing several basic training pieces.
Maybe it was something I said?
For more on the SALT conference, please click here (you must be logged in to your account to access this piece).
Good luck and good trading.
John Thomas
CEO & Publisher
The Diary of a Mad Hedge Fund Trader


“If the product is free, then you are the product,” said a technology company CEO to me the other day.

Global Market Comments
May 3, 2019
Fiat Lux
Featured Trade:
(LAST CHANCE TO ATTEND THE LAS VEGAS MAY 9 GLOBAL STRATEGY LUNCHEON)
(APRIL 3 BIWEEKLY STRATEGY WEBINAR Q&A),
(SPY), (LYFT), (TSLA), (TLT), (XLV), (UBER),
(AAPL), (AMZN), (MSFT), (EDIT), (SGMO), (CLLS)
Come join me for lunch for the Mad Hedge Fund Trader’s Global Strategy Update which I will be conducting in Las Vegas, Nevada on Thursday, May 9 at 12:00 noon.
A three-course lunch will be followed by an extended question and answer period.
I’ll be giving you my up to date view on stocks, bonds, foreign currencies, commodities, precious metals, and real estate.
And to keep you in suspense, I’ll be throwing a few surprises out there too.
Enough charts, tables, graphs, and statistics will be thrown at you to keep your ears ringing for a week. Tickets are available for $242.
I’ll be arriving early and leaving late in case anyone wants to have a one on one discussion, or just sit around and chew the fat about the financial markets.
The lunch will be held at a top restaurant at a major Strip casino. The exact location will be emailed with your purchase confirmation.
I look forward to meeting you and thank you for supporting my research.
To purchase tickets for this luncheon, please click here.
Below please find subscribers’ Q&A for the Mad Hedge Fund Trader May 1 Global Strategy Webinar with my guest and co-host Bill Davis of the Mad Day Trader. Keep those questions coming!
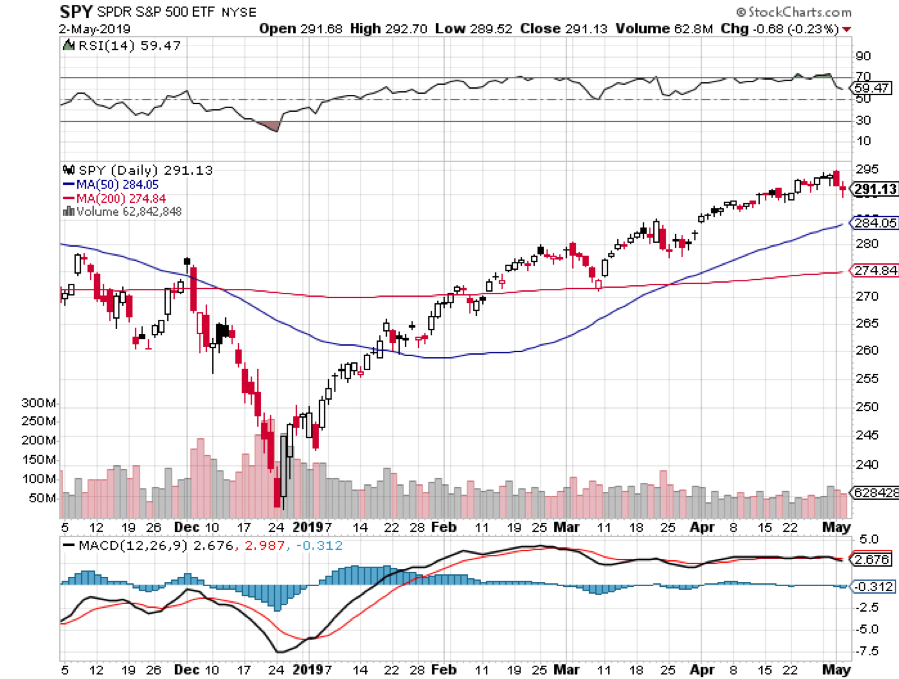
Q: Your old target for the (SPY) was $292.80; we’re clearly above that now. What’s your new target and how long will it take to get there?
A: My new target on the S&P 500 (SPY) is $296.80. You’re looking at $295 on the (SPY), so we’re almost there. However, we’re grinding up too slowly so I can’t give you an exact date.
Q: Will Fed governor Jay Powell give in to pressure from Trump who wants him to drop rates? Does he have any sway over the process?
A: Officially he has no sway, but every day Trump is tweeting: “I want QE back, I want a 1% rate cut.” And if that happened, the economy would completely blow up—an interest rate cut with the market at an all-time high and 3.25% GDP growth rate would be unprecedented, would deliver a short term gain and long term disaster.
Q: What do you think about the Uber (UBER) IPO?
A: I wouldn’t touch it with a 10-foot pole—they’ve been cutting valuations almost every day. At one point they were going to value the company at $120 billion dollars, now they’re at $90 billion and they may even lower it from there. The last car sharing IPO (LYFT) dropped 33% from its high. I would stay away from all of the IPOs once they’re listed. The rule is: only buy these things when they’re down 50%. Warren Buffet never buys IPOs, nor do I.
Q: What do you think about buying or selling Lyft?
A: I would wait a couple of months for Lyft to find its true price. Then you’ll have something to trade against.
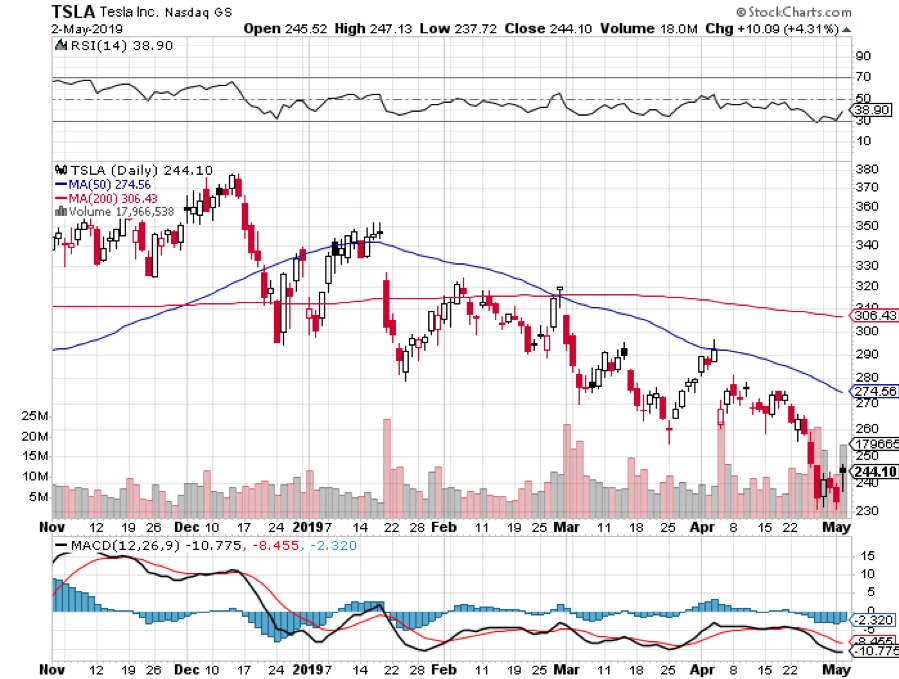
Q: Do you think the bad news is over on Tesla (TSLA)? Is it time to buy? Or is it going bankrupt?
A: The whole world knew that the electric car subsidy would be cut in January, so what customers did was accelerate their orders in the 4th quarter, which took us all the way up to $380 in the shares, and then created a vacuum in the Q1 of this year. It reported the first quarter last week—they were disastrous orders, and the company is cutting back overhead as fast as possible as if it’s going into a recession, which it kind of is. The question is whether or not sales will bounce back in Q2 with the smaller subsidy. I happen to think they will. But we may not see 2018 Q4 sales levels again until 2019 Q4.
Q: Why has healthcare (XLV) been so awful this year?
A: There’s an election next year and both parties promise to beat up on the healthcare industry with drug control pricing and other forms of regulation. Of course, the current president promised free competition in drug prices; but then he moved to Washington DC and found the drug industry lobby, and nothing was ever heard again on that front. It’s a very high political risk sector, but there is some great value at these levels in the healthcare industry in the long term. I’m about to start the Mad Hedge Biotech and Health Care newsletter imminently.
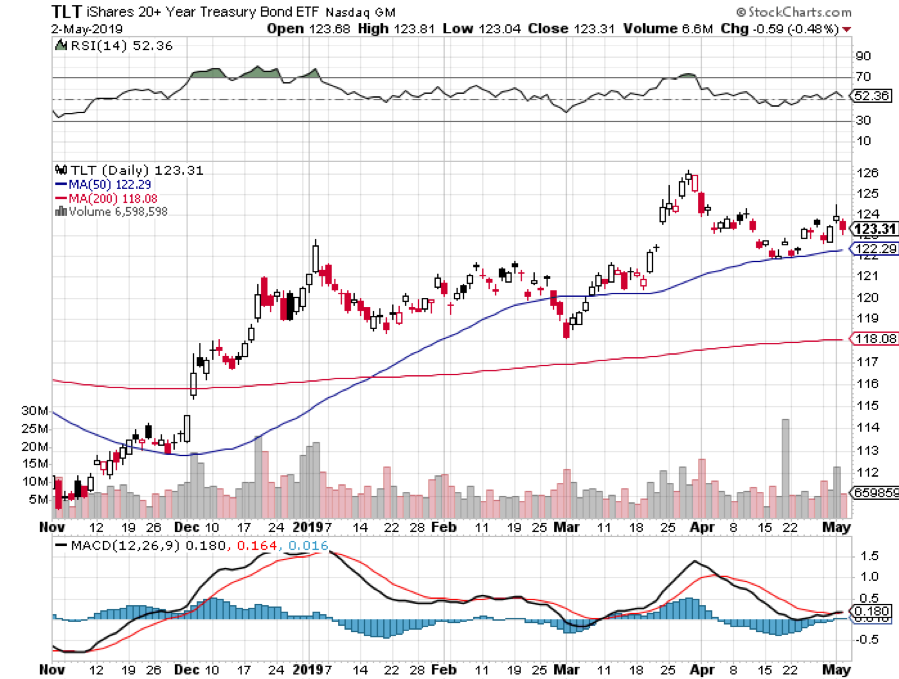
Q: Should I buy the (TLT) $120-$123 call spread now?
A: That's a very aggressive trade, I would wait and go with strikes for in the money, and then only on a big dip. Don’t reach for a trade when the market is at an all-time high.
Q: Should I be shorting Tesla down here?
A: Absolutely not, your short trade was at $380, $350, $330 and $300. Down here, you run the risk of a surprise tweet from Elon Musk causing the stock to go $50 against you. Buy the way, he’s already announced that he’s buying $10 million worth of shares in his next capital raise.
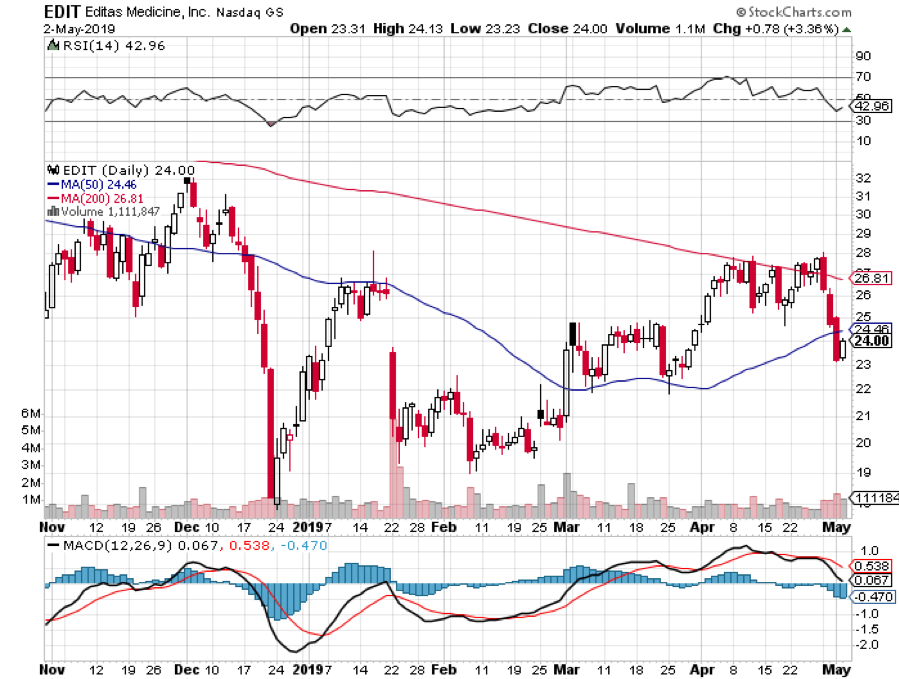
Q: What do you think about CRISPR stocks long term, like Editas Medicine (EDIT), Sangamo Life Sciences (SGMO), and Cellectis (CLLS)?
A: These are probably the best bunch of 10 baggers long term. Short term they are afflicted with the same problems impacting all of healthcare—promises of regulation and price control on all of their products ahead of an election. So, hold for the long term; short term I’d only be buying the really big dips. Did I mention that I’m about to start the Mad Hedge Biotech and Health Care newsletter imminently?
Q: Is your May 10th market top forecast still good?
A: Well we’re getting kind of close to May 10th. I made this prediction based on an inverting yield curve two years ago. However, that target did not anticipate interest rates topping out for the 10-year US Treasury bond at 3.25%. Nor did it consider the Fed canceling all interest rate hikes for the year. Without the artificial stimulus, the market would certainly have already rolled over and died. That said, I still have a week to go.
Q: Should I be selling my long term holds in the FANGS, like Apple (AAPL), Amazon (AMZN), and Microsoft (MSFT)?
A: For the long term, no. However, we know from December that these things can get hit with a 40% drawdown at any time. As long as you can handle that, they always bounce back.
Q: What will happen to Venezuela? Any trades?
A: The only related trades would be in the oil market (USO). If we get a coup d’ etat which installs a new pro-American president, which could be at any time, that could lead to a selloff in oil for a couple of days as 1 Million barrels of crude per day come back on the market, but probably no more than that.
Q: With current national debt and budget deficits, when will interest in gold kick in?
A: Very simple: when the stock market goes down, you want to buy gold. It’s the hedge that everyone will chase after, and inflation is just around the corner.
Q: Do you need me to place any Kentucky Derby bets?
A: Me being the cautious guy I am, I pick the horse with the best odds and then I bet him to show. That almost always works.
Q: What about pot stocks?
A: I’ve never liked them very much; after all, how hard is it to grow a weed? The barriers to entry are zero. All of these pot companies coming up now are not really pot stocks as much as they are marketing companies, so you’re buying their distribution capability primarily. That said, I’m having breakfast with the CEO of a major pot company next week, so I’ll be writing about that once I get the inside scoop.
Q: Will the Fed be the non-event?
A: Yes, as stated in the Mad Hedge Hot Tips this morning, it will be a non-event and the news is due out in about an hour.
"If money be not thy servant, it will be thy master. The covetous man cannot so properly be said to possess wealth, as that may be said to possess him," said Sir Francis Bacon, the 16th century English scientist.

Global Market Comments
May 2, 2019
Fiat Lux
Featured Trade:
(HEADED FOR THE LAS VEGAS SKYBRIDGE SALT CONFERENCE),
(BRK/A), (EEM)
(NOTICE TO MILITARY SUBSCRIBERS),