Global Market Comments
January 2, 2019
Fiat Lux
Featured Trade:
(MY OLD PAL, LEONARDO FIBONACCI),
(TESTIMONIAL)

Global Market Comments
January 2, 2019
Fiat Lux
Featured Trade:
(MY OLD PAL, LEONARDO FIBONACCI),
(TESTIMONIAL)
Global Market Comments
December 31, 2018
Fiat Lux
Featured Trade:
(WILL SYNBIO SAVE OR DESTROY THE WORLD?),
(XLV), (XPH), (XBI), (IMB), (GOOG), (AAPL), (CSCO), (BIIB)
Global Market Comments
December 28, 2017
Fiat Lux
SPECIAL ISSUE ABOUT THE FAR FUTURE
Featured Trade:
(PEAKING INTO THE FUTURE WITH RAY KURZWEIL),
(GOOG), (INTC), (AAPL), (TXN)

This is the most important research piece you will ever read, bar none. But you have to finish it to understand why. So, I will get on with the show.
I have been hammering away at my followers at investment conferences, webinars, and strategy luncheons this year about one recurring theme. Things are good, and about to get better, a whole lot better.
The driver will be the exploding rate of technological innovation in electronics, biotechnology, and energy. The 2020s are shaping up to be another roaring twenties, and asset prices are going to go through the roof.
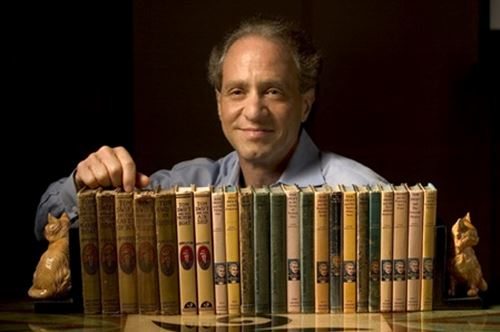
To flesh out some hard numbers about growth rates that are realistically possible and which industries will be the leaders, I hooked up with my old friend, Ray Kurzweil, one of the most brilliant minds in computer science.
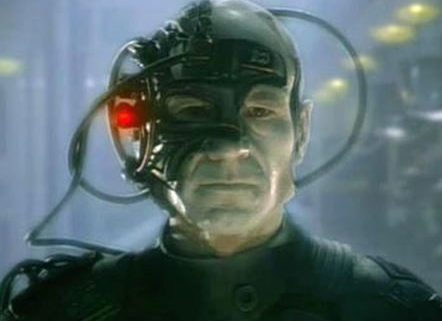
Ray is currently a director of Engineering at Google (GOOG) heading up a team that is developing stronger artificial intelligence. He is an MIT grad with a double major in computer science and creative writing. He was the principal inventor of the CCD flatbed scanner, first text-to-speech synthesizer, and the commercially marketed large-vocabulary speech recognition.
When he was still a teenager, Ray was personally awarded a science prize by President Lyndon Johnson. He has received 20 honorary doctorates and has authored 7 books. It was upon Ray’s shoulders that many of today’s technological miracles were built.
His most recent book, The Singularity is Near: When Humans Transcend Biology, was a New York Times bestseller. In it, he makes hundreds of predictions about the next 100 years that will make you fall out of your chair.
I met Ray at one of my favorite San Francisco restaurants, Morton’s on Sutter Street. I ordered a dozen oysters, a filet mignon wrapped in bacon, and drowned it all down with a fine bottle of Duckhorn merlot. Ray had a wedge salad with no dressing, a giant handful of nutritional supplements, and a bottle of water. That’s Ray, one cheap date.
The Future of Man
A singularity is defined as a single event that has monumental consequences. Astrophysicists refer to the big bang and black holes in this way. Ray’s singularity has humans and machines merging to become single entities, partially by 2040 and completely by 2100.
All of our thought processes will include built-in links to the cloud making humans super smart. Skin that absorbs energy from the sun will eliminate the need to eat. Nanobots will replace blood cells, which are far more efficient at moving oxygen. A revolution in biotechnology will enable us to eliminate all medical causes of death.
Most organs can now be partially or completely replaced. Eventually, they all will become renewable by taking one of your existing cells and cloning it into a completely new organ. We will become much more like machines, and machines will become more like us.
The first industrial revolution extended the reach of our bodies, and the second is extending the reach of our minds.
And, oh yes, prostitution will be legalized and move completely online. Sounds like a turn-off? How about virtually doing it with your favorite movie star? Your favorite investment advisor? Yikes!
Ironically, one of the great accelerants towards this singularity has been the war in Iraq. More than 50,000 young men and women came home missing arms and legs (in Vietnam these were all fatalities, thanks to the absence of modern carbon fiber body armor).
Generous government research budgets have delivered huge advances in titanium artificial limbs and the ability to control them only with thoughts. Quadriplegics can now hit computer keystrokes merely by thinking about them.
Kurzweil argues that exponentially growing information technology is encompassing more and more things that we care about, like healthcare and medicine. Reprogramming of biology will be the next big thing and is a crucial part of his “singularity.”
Our bodies are governed by obsolete genetic programs that evolved in a bygone era. For example, over millions of years, our bodies developed genes to store fat cells to protect against a poor hunting season in the following year. That gave us a great evolutionary advantage 10,000 years ago. But it is not so great now with obesity becoming the country’s number one health problem.
We would love to turn off these genes through reprogramming, confident that the hunting at the supermarket next year will be good. We can do this in mice now which, in experiments, can eat like crazy but never gain weight.
The happy rodents enjoy the full benefits of caloric restriction with no hint of diabetes or heart disease. A product like this would be revolutionary, not just for us, health care providers, and the government, but, ironically, for fast food restaurants as well.
Within the last five years, we have learned how to reprogram stem cells to rebuild the hearts of heart attack victims. The stem cells are harvested from skin cells, not human embryos, ducking the political and religious issue of the past.
And if we can turn off genes, why not the ones in cancer cells that enable them to pursue unlimited reproduction until they kill its host? That development would cure all cancers, and is probably only a decade off.
The Future of Computing
If this all sounds like science fiction, you’d be right. But Ray points out that humans have chronically underestimated the rate of technological innovation.
This is because humans evolved to become linear thinking animals. If a million years ago we saw a gazelle running from left to right, our brains calculated that one second later it would progress ten feet further to the right. That’s where we threw the spear. This gave us a huge advantage over other animals and is why we became the dominant species.
However, much of science, technology, and innovation grows at an exponential rate and is where we make our most egregious forecasting errors. Count to seven, and you get to seven. However, double something seven times and you get to a billion.
The history of the progress of communications is a good example of an exponential effect. The spoken language took hundreds of thousands of year to develop. Written language emerged thousands of years, books in 100 years, the telegraph in a century, and telephones 50 years later.
Some ten years after Steve Jobs brought out his Apple II personal computer, the growth of the Internet went hyperbolic. Within three years of the iPhone launch, social media exploded out of nowhere.
At the beginning of the 20th century, $1,000 bought 10 X -5th power worth of calculations per second in our primitive adding machines. A hundred years later a grand got you 10 X 8th power calculations, a 10 trillion-fold improvement. The present century will see gains many times this.
The iPhone itself is several thousand times smaller, a million times cheaper, and billions of times more powerful than computers of 40 years ago. That increases the price per performance by the trillions. More dramatic improvements will accelerate from here.
Moore’s law is another example of how fast this process works. Intel (INTC) founder Gordon Moore published a paper in 1965 predicting a doubling of the number of transistors on a printed circuit board every two years. Since electrons had shorter distances to travel, speeds would double as well.
Moore thought that theoretical limits imposed by the laws of physics would bring this doubling trend to end by 2018 when the gates become too small for the electrons to pass through. For decades, I have read research reports predicting that this immutable deadline would bring an end to innovation and technological growth, and bring an economic Armageddon.
Ray argues that nothing could be further from the truth. A paradigm shift will simply allow us to leapfrog conventional silicon-based semiconductor technologies and move on to bigger and better things. We did this when we jumped from vacuum tubes to transistors in 1949, and again in 1959 when Texas Instruments (TXN) invented the first integrated circuit.
Paradigm shifts occurred every ten years in the past century, every five years in the last decade, and will occur every couple of years in the 2020s. So fasten your seatbelts!
Nanotechnology has already allowed manufacturers to extend the 2018 Moore’s Law limit to 2022. On the drawing board are much more advanced computing technologies including calcium-based systems using the alternating direction of spinning electrons, and nanotubes.
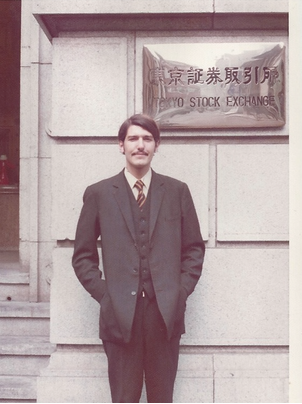
Perhaps the most promising is DNA-based computing, a high research priority at IBM and several other major firms. I earned my own 15 minutes of fame in the scientific world 40 years ago as a member of the first team ever to sequence a piece of DNA which is why Ray knows who I am.
DeoxyriboNucleic Acid makes up the genes that contain the programming that makes us who we are. It is a fantastically efficient means of storing and transmitting information. And it is found in every single cell in our bodies, all 10 trillion of them.
The great thing about DNA is that it replicates itself. Just throw it some sugar. That eliminates the cost of building the giant $2 billion silicon-based chip fabrication plants of today.
The entire human genome is a sequential binary code containing only 800 MB information which after you eliminate redundancies, has a mere 30-100 MB of useful information, about the size of an off-the-shelf software program like Word for Windows. Unwind a single DNA molecule and it is only six feet long.
What this means is that, just when many believe that our computer power is peaking, it is in fact just launching on an era of exponential growth. Supercomputers surpassed human brain computational ability in 2012, about 10 to the 16th power (ten quadrillion) calculations per second.
That power will be available on a low-end laptop by 2020. By 2050, this prospective single laptop will have the same computing power of the entire human race, about 9 billion individuals. It will also be small enough to implant in our brains.
The Future of the Economy
Ray is not really that interested in financial markets or, for that matter, making money. Where technology will be in a half-century and how to get us there are what get his juices flowing. However, I did manage to tease a few mind-boggling thoughts from him.
At the current rate of change, the 21st century will see 200 times the technological progress that we saw in the 20th century. Shouldn’t corporate profits, and therefore share prices, rise by as much?
Technology is rapidly increasing its share of the economy and increasing its influence on other sectors. That’s why tech has been everyone’s favorite sector for the past 30 years and will remain so for the foreseeable future. For two centuries, technology has been eliminating jobs at the bottom of the economy and creating new ones at the top.
Stock analysts and investors make a fatal flaw in estimating future earnings based on the linear trends of the past, instead of the exceptional growth that will occur in the future.
In the last century, the Dow appreciated from 100 to 10,000, an increase of 100 times. If we grow at that rate in this century, the Dow should increase by 10,000% to 1 million by 2100. But so far, we are up only 6%, even though we are already 18 years into the new century.
The index is seriously lagging but will play catch up in a major way during the 2020s when economic growth jumps from 2% to 4% or more, thanks to the effects of massively accelerating technological change.
Some 100 years ago, one-third of jobs were in farming, one third were in manufacturing, and one third in services. If you predicted then that in a century farming and manufacturing would each be 3% of total employment and that something else unknown would come along for the rest of us, people would have been horrified. But that’s exactly what happened.
Solar energy use is also on an exponential path. It is now 1% of the world’s supply but is only seven doublings away from becoming 100%. Then we will consume only one 10,000th of the sunlight hitting the earth. Geothermal energy offers the same opportunities.
We are only running out of energy if you limit yourself to 19th-century methods. Energy costs will plummet. Eventually, energy will be essentially free when compared to today’s costs, further boosting corporate profits.
Hyper-growth in technology means that we will be battling with deflation for the rest of the century, as the cost of production and price of everything fall off a cliff. That makes our 10-year Treasury bonds a steal at a generous 2.60% yield, a full 460 basis points over the real long-term inflation rate of negative 2% a year.
US Treasuries could eventually trade down to the 0.40% yields seen in Japan only a couple of years ago. This means that the bull market in bonds is still in its early stages, and could continue for decades.
The upshot for all of this these technologies will rapidly eliminate poverty, not just in the US but around the world. Each industry will need to continuously reinvent its business model, or disappear.
The takeaway for investors that stocks, as well as other asset prices, are now wildly undervalued given their spectacular future earnings potential. It also makes the Dow target of 1 million by 2100 absurdly low, and off by a factor of 10 or even 100. Will we be donning our “Dow 100 Million” then?
Other Random Thoughts
As we ordered dessert, Ray launched into another stream of random thoughts. I asked for Morton’s exquisite double chocolate mousse. Ray had another handful of supplements. Yep, Mr. Cheap Date.
The number of college students has grown from 50,000 to 12 million since the 1870s. A kid in Africa with a cell phone has more access to accurate information than the president of the United States did 15 years ago.
The great superpower, the Soviet Union, was wiped out by a few fax machines distributing information in 1991.
Company offices will become entirely virtual by 2025.
Cows are very inefficient at producing meat. In the near future, cloned muscle tissue will be produced in factories, disease free, and at a fraction of the present cost without the participation of the animal. PETA will be thrilled.
Use of nanomaterials to build ultra light but ultra strong cars cuts fuel consumption dramatically. Battery efficiencies will improve by 10 to 100 times. Imagine powering Tesla Model S1 with a 10-pound battery! Advances in nanotube construction mean the weight of the vehicle will drop from the present 3 tons to just 100 pounds but will be far safer.
Ray is also on a scientific advisory panel for the US Army. Uncertain about my own security clearance, he was reluctant to go into detail. Suffice it to say that the weight of an M1 Abrams main battle tank will shrink from 70 tons to 1 ton, but will be 100 times stronger.
A zero tolerance policy towards biotechnology by the environmental movement exposes their intellectual and moral bankruptcy. Opposing a technology with so many positive benefits for humankind and the environment will inevitably alienate them from the media and the public who will see the insanity of their position.
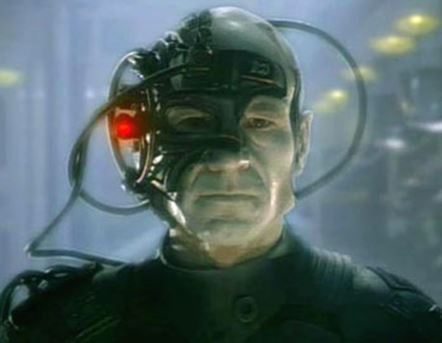
Artificial intelligence is already far more prevalent than you understand. The advent of strong artificial intelligence will be the most significant development of this century. You can’t buy a book from Amazon, withdraw money from your bank, or book a flight without relying on AI.
Ray finished up by saying that by 2100 humans will have the choice of living in a biological, or in a totally virtual, online form. In the end, we will all just be files.
Personally, I prefer the former, as the best things in life are biological, and free!
I walked over to the valet parking, stunned and disoriented by the mother load of insight I had just obtained, and it wasn’t just the merlot talking, either! Imagine what they talk about at Google all day.
To buy The Singularity is Near at discount Amazon pricing, please click here. It is worth purchasing the book just to read Ray’s single chapter on the future of the economy.

Global Market Comments
December 27, 2018
Fiat Lux
Featured Trade:
(HOW TO PLAY APPLE IN 2019)
(AAPL)
(THE EIGHT WORST TRADES IN HISTORY),
(TESTIMONIAL)

Not a day goes by when someone doesn’t ask me about what to do about Apple (AAPL).
After all, it is the world largest company. It is the planet’s most widely owned stock. Almost everyone uses their products in some form or another.
So, the widespread interest is totally understandable.
Apple is a company with which I have a very long relationship. During the early 1980s, I was ordered by Morgan Stanley to take Steve Jobs around to the big New York Institutional Investors to pitch a secondary share offer for the sole reason that I was one of three people who worked for the firm who was then from California.
They thought one West Coast hippy would easily get along with another. Boy, were they wrong. It was the worst day of my life. Steve was not a guy who palled around with anyone.
Today, some 200 Apple employees subscribe to the Diary of a Mad Hedge Fund Trader looking to diversify their substantial holdings. Many own Apple stock with an adjusted cost basis of under $5. Suffice it to say, they all drive really nice Priuses.
So I get a lot of information about the firm far above and beyond the normal effluent of the media and stock analysts. That’s why Apple has become a favorite target of my Trade Alerts over the years.
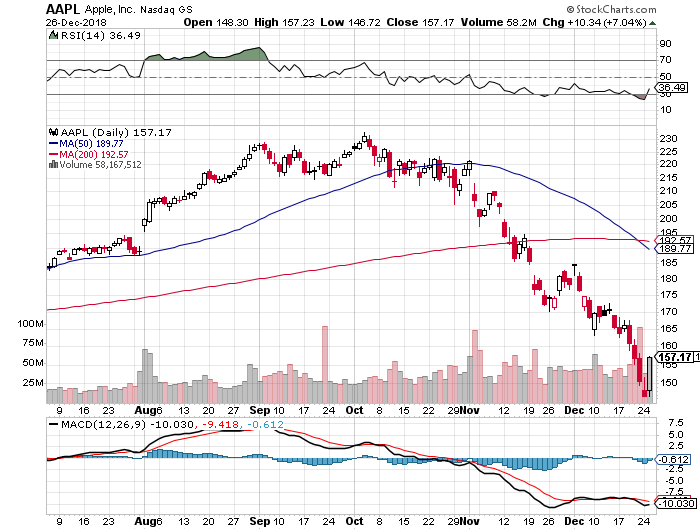
And here is the take: You didn’t want to touch the stock during the last quarter of 2018.
And here’s why. Apple is all about the iPhone which accounts for 75% of its total earnings. The TV, the watch, the car, iPods, the iMac, and Apple pay are all a waste of time and consume far more coverage than they are collectively worth.
The good news is that iPhone sales are subject to a fairly reliable cycle. Apple launches a major new iPhone every other fall. The share price peaks shortly after that. The odd years see minor upgrades, not generational changes.
Just like you see a big pullback in the tide before a tsunami hits, iPhone sales are flattening out. This is because consumers start delaying purchases in expectation of the introduction of the iPhone 7 in September 2016 with far more power, gadgets, and gizmos.
Channel checks, however dubious these may be, are already confirming the slowdown of orders for iPhone-related semiconductors from suppliers you would expect from such a downturn.
So during those in-between years, the stock performance is disappointing. 2018 certainly followed this script with Apple down a horrific 30.13% at the lows. Maybe it’s a coincidence, but that last generation in Apple shares in 2015 brought a decline of, you guessed it, exactly 29.33%.
The coming quarter could bring the opposite.
After March, things will start to get interesting especially post the Q1 earnings report in April. That’s when investors will start to discount the rollout of the next iPhone seven months later.
The last time this happened, in 2018, Apple stock rocketed by $86, or 55.33%. This time, I expect a minimum rally to the old $233 high, a gain of $71, or 43.82%.
After all, I am such a conservative guy with my predictions.
Even at that price, it will still be one of the cheapest stocks in the market on a valuation basis which currently trades at a 14X earnings multiple. The value players will have no choice to join in, if they’re not already there.
But Apple is a much bigger company this time around, and well-established cycles tend to bring in diminishing returns. It’s like watching the declining peaks of a bouncing rubber ball.
The bull case for Apple isn’t dead, it is just resting.
The China business will continue to grow nicely once we get through the current trade war. Their new lease program promises to deliver a faster upgrade cycle that will allow higher premium prices for their products. That will bring larger profits.
Just thought you’d like to know.


As you are all well aware, I have long been a history buff. I am particularly fond of studying the history of my own avocation, trading, in the hope that the past errors of others will provide insights into the future.
History doesn’t repeat itself, but it certainly rhymes.
So after decades of research on the topic, I thought I would provide you with a list of the eight worst trades in history. Some of these are subjective, some are judgment calls, but all are educational. And I do personally know many of the individuals involved.
Here they are for your edification, in no particular order. You will notice a constantly recurring theme of hubris.
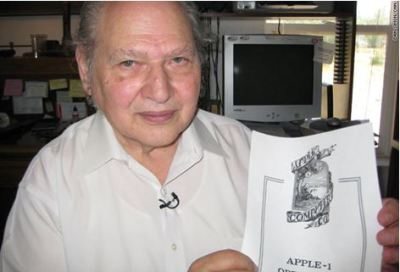
1) Ron Wayne’s sales of 10% of Apple (AAPL) for $800 in 1976
Say you owned 10% of Apple (AAPL) and you sold it for $800 in 1976. What would that stake be worth today? Try $70 billion. That is the harsh reality that Ron Wayne, 76, faces every morning when he wakes up, one of the three original founders of the consumer electronics giant.
Ron first met Steve Jobs when he was a spritely 21-year-old marketing guy at Atari, the inventor of the hugely successful “Pong” video arcade game.
Ron dumped his shares when he became convinced that Steve Jobs’ reckless spending was going to drive the nascent startup into the ground and he wanted to protect his own assets in a future bankruptcy.
Co-founders Jobs and Steve Wozniak each kept their original 45% ownership. Today Jobs’ widow, Laurene Powel Jobs, has a 0.5% ownership in Apple worth $4 billion, while the value of Woz’s share remains undisclosed.
Today, Ron is living off of a meager monthly Social Security check in remote Pahrump, Nevada, about as far out in the middle of nowhere as you can get where he can occasionally be seen playing the penny slots.
2) AOL's 2001 Takeover of Time Warner
Seeking to gain dominance in the brave new online world, Gerald Levin pushed old-line cable TV and magazine conglomerate, Time Warner, to pay $164 billion to buy upstart America Online in 2001. AOL CEO, Steve Case, became chairman of the new entity. Blinded by greed, Levin was lured by the prospect of 130 million big spending new customers.
It was not to be.
The wheels fell off almost immediately. The promised synergies never materialized. The Dotcom Crash vaporized AOL’s business the second the ink was dry. Then came a big recession and the Second Gulf War. By 2002, the value of the firm’s shares cratered from $226 billion to $20 billion.
The shareholders got wiped out, including “Mouth of the South” Ted Turner. That year, the firm announced a $99 billion loss as the goodwill from the merger was written off, the largest such loss in corporate history. Time Warner finally spun off AOL in 2009, ending the agony.
Steve Case walked away with billions, and is now an active venture capitalist. Gerald Levin left a pauper, and is occasionally seen as a forlorn guest on talk shows. The deal is widely perceived to be the worst corporate merger in history.
3) Bank of America's Purchase of Countrywide Savings in 2008
Bank of America’s CEO Ken Lewis thought he was getting the deal of the century picking up aggressive subprime lender, Countrywide Savings, for a bargain $4.1 billion, a “rare opportunity.”
As a result, Countrywide CEO Angelo Mozilo pocketed several hundred million dollars. Then the financial system collapsed, and suddenly we learned about liar loans, zero money down, and robo signing of loan documents.
Bank of America’s shares plunged by 95%, wiping out $500 billion in market capitalization. The deal saddled (BAC) with liability for Countrywide’s many sins, ultimately, paying out $40 billion in endless fines and settlements to aggrieved regulators and shareholders.
Ken Lewis was quickly put out to pasture, cashing in on an $83 million golden parachute, and is now working on his golf swing. Mozilo had to pay a number of out of court settlements, but was able to retain a substantial fortune, and is still walking around free.
The nicely tanned Mozilo is also working on his golf swing.
4) The 1973 Sale of All Star Wars Licensing and Merchandising Rights by 20th Century Fox for Free
In 1973, my former neighbor George Lucas approached 20th Century Fox Studios with the idea for the blockbuster film, Star Wars. It was going to be his next film after American Graffiti which had been a big hit earlier that year.
While Lucas was set for a large raise for his directing services – from $150,000 for American Graffiti to potentially $500,000 for Star Wars – he had a different twist ending in mind. Instead of asking for the full $500,000 directing fee, he offered a discount: $350,000 off in return for the unlimited rights to merchandising and any sequels.
Fox executives agreed, figuring that the rights were worthless, and fearing that the timing might not be right for a science fiction film.
In hindsight, their decision seems ridiculously short-sighted.
Since 1977, the Star Wars franchise has generated about $27 billion in revenue, leaving George Lucas with a net worth of over $3 billion by 2012. In 2012, Disney paid Lucas an additional $4 billion to buy the rights to the franchise
The initial budget for Star Wars was a pittance at $8 million, a big sum for an unproven film. So, saving $150,000 on production costs was no small matter, and Fox thought it was hedging its bets.
George once told me that he had a problem with depressed actors on the set while filming. Harrison Ford and Carrie Fisher thought the plot was stupid and the costumes silly.
Today, it is George Lucas that is laughing all the way to the bank.
5) Lehman Brothers Entry Into the Bond Derivatives Market in the 2000s
I hated the 2000s because it was clear that men with lesser intelligence were using other people’s money to hyper leverage their own personal net worth. The money wasn’t the point. The quantities of cash involved were so humongous they could never be spent. It was all about winning points in a game with the CEOs of the other big Wall Street institutions.
CEO Richard Fuld could have come out of central casting as a stereotypical bad guy. He even once offered me a job which I wisely turned down. Fuld took his firm’s leverage ratio up to 100 times in an extended reach for obscene profits. This meant that a 1% drop in the underlying securities would entirely wipe out its capital.
That’s exactly what happened, and 10,000 employees lost their jobs, sent packing with their cardboard boxes with no notice. It was a classic case of a company piling on more risk to compensate for the lack of experience and intelligence. This only ends one way.
Morgan Stanley (MS) and Goldman Sachs (GS) drew the line at 40 times leverage and are still around today but just by the skin of their teeth, thanks to the TARP.
Fuld has spent much of the last five years ducking in and out of depositions in protracted litigation. Lehman issued public bonds only months before the final debacle, and how he has stayed out of jail has amazed me. Today he works as an independent consultant. On what I have no idea.
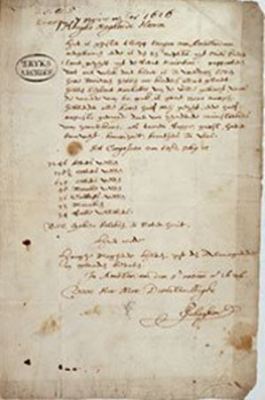
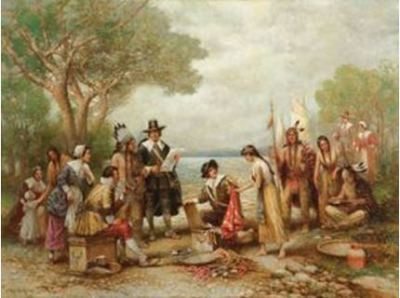
6) The Manhasset Indians' Sale of Manhattan to the Dutch in 1626
Only a single original period document mentions anything about the purchase of Manhattan. This letter states that the island was bought from the Indians for 60 Dutch guilders worth of trade goods which would consist of axes, iron kettles, beads, and wool clothing.
No record exists of exactly what the mix was. Indians were notoriously shrewd traders and would not have been fooled by worthless trinkets.
The original letter outlining the deal is today kept at a museum in the Netherlands. It was written by a merchant, Pieter Schagen, to the directors of the West India Company (owners of New Netherlands) and is dated 5 November 1626.
He mentions that the settlers “have bought the island of Manhattes from the savages for a value of 60 guilders.” That’s it. It doesn’t say who purchased the island or from whom they purchased it, although it was probably the local Lenape tribe.
Historians often point out that North American Indians had a concept of land ownership different from that of the Europeans. The Indians regarded land, like air and water, as something you could use but not own or sell. It has been suggested that the Indians may have thought they were sharing, not selling.
It is anyone’s guess what Manhattan is worth today. Just my old two-bedroom 34th-floor apartment at 400 East 56th Street is now worth $2 million. Better think in the trillions.
7) Napoleon's 1803 Sale of the Louisiana Purchase to the United States
Invading Europe is not cheap, as Napoleon found out, and he needed some quick cash to continue his conquests. What could be more convenient than unloading France’s American colonies to the newly founded United States for a tidy $7 million? A British naval blockade had made them all but inaccessible anyway.
What is amazing is that president Thomas Jefferson agreed to the deal without the authority to do so, lacking permission from Congress, and with no money. What lies beyond the Mississippi River then was unknown.
Many Americans hoped for a waterway across the continent while others thought dinosaurs might still roam there. Jefferson just took a flyer on it. It was up to the intrepid explorers, Lewis and Clark, to find out what we bought.
Sound familiar? Without his bold action, the middle 15 states of the country would still be speaking French, smoking Gitanes, and getting paid in Euros.
After Waterloo in 1815, the British tried to reverse the deal and claim the American Midwest for themselves. It took Andrew Jackson’s (see the $20 bill) surprise win at the Battle of New Orleans to solidify the US claim.
The value of the Louisiana Purchase today is incalculable. But half of a country that creates $17 trillion in GDP per year and is still growing would be worth quite a lot.
8) The John Thomas Family Sale of Nantucket Island in 1740
Yes, my own ancestors are to be included among the worst traders in history. My great X 12 grandfather, a pioneering venture capitalist investor of the day from England, managed to buy the island of Nantucket off the coast of Massachusetts from the Indians for three ax heads and a sheep in the mid-1600s. Barren, windswept, and distant, it was considered worthless.
Two generations later, my great X 10 grandfather decided to cut his risk and sell the land to local residents just ahead of the Revolutionary War. Some 17 of my ancestors fought in that war including the original John Thomas who served on George Washington’s staff at the harsh winter encampment at Valley Forge during 1777-78. Maybe that’s why I have an obsession about not wasting food?
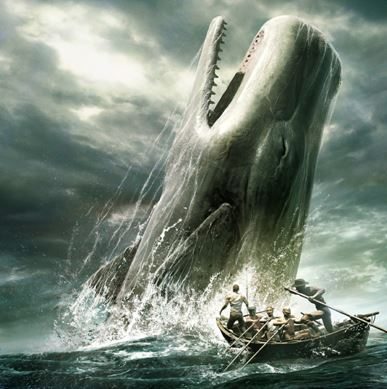
By the early 19th century, a major whaling industry developed on Nantucket fueling the lamps of the world with smoke-free fuel. By then, our family name was “Coffin,” which is still abundantly found on the headstones of the island’s cemeteries.
One Coffin even saw his ship, the Essex, rammed by a whale and sunk in the Pacific in 1821 (read about it in The Heart of the Sea by Nathaniel Philbrick, to be released as a movie in 2015). He was eaten by fellow crewmembers after spending 99 days adrift in an open lifeboat. Maybe that’s why I have an obsession about not wasting food?
In the 1840s, a young itinerant writer named Herman Melville visited Nantucket and heard the Essex story. He turned it into a massive novel about a mysterious rogue white whale, Moby Dick, which has been torturing English literature students ever since. Our family name, Coffin, is mentioned seven times in the book.
Nantucket is probably worth many tens of billions of dollars today as a playground for the rich and famous. Just a decent beachfront cottage there rents for $50,000 a week in the summer.
The Ron Howard film The Heart of the Sea came out a few years ago, and it is breathtaking. Just be happy you never worked on a 19th-century sailing ship.
Yes, it’s all true and documented.
First and foremost, thank you for what you do.
The small cost of this newsletter pays for itself a thousand times over. My returns mimic those of your portfolio for the year and for that I am grateful.
The only suggestion I would offer is to keep doing what you are doing. It is people like you that will help return the once storied name to Wall Street.
Regards,
Shirin
Tampa, Florida
Global Market Comments
December 26, 2018
Featured Trades:
(A CHRISTMAS STORY),
(THE U-HAUL INDICATOR)

Global Market Comments
December 24, 2018
Fiat Lux
SPECIAL END OF YEAR ISSUE
Featured Trade:
(THANK YOU FROM THE MAD HEDGE FUND TRADER),
(MY LAST RESEARCH PIECE OF THE YEAR)

 Did You Say "BUY" or "SELL"
 The Future is Closer than You Think