Featured Trade: (HOW THIS MARKET WILL DIE), (SPY), (SPX), (DOW AVERAGE), (AAPL), (QQQ), (APRIL 12 SAN FRANCISCO STRATEGY LUNCHEON), (THE CRUEL TRUTH ABOUT GOVERNMENT STATISTICS), (TESTIMONIAL)
SPDR S&P 500
S&P Large Cap Index
Apple
Power Shares QQQ
https://madhedgefundtrader.com/wp-content/uploads/2019/05/cropped-mad-hedge-logo-transparent-192x192_f9578834168ba24df3eb53916a12c882.png00Mad Hedge Fund Traderhttps://madhedgefundtrader.com/wp-content/uploads/2019/05/cropped-mad-hedge-logo-transparent-192x192_f9578834168ba24df3eb53916a12c882.pngMad Hedge Fund Trader2013-02-08 09:46:462013-02-08 09:46:46February 8, 2013
The universal question in the market today was ?Why is it down? when all the news was good? The weekly jobless claims dropped 5,000 to 366,000, near a five-year low, confirming that the jobs recovery is still on track. Activist shareholder, David Einkorn?s, lawsuit against Apple (AAPL) to unfreeze its cash mountain should have boosted the market?s major buzz kill.
Sure, ECB president said that European growth would continue to slow. No news there, and certainly not enough to prompt a triple digit decline in the Dow.
The harsh truth is that after the near parabolic move we have seen since the beginning of the year, you don?t need a news event to trigger a market sell off. The mere altitude of the (SPX) at 1,515 should, alone, be enough to do it, a mere 3.8% off the all time high.
The fact is that almost every manager has seen the best start to his track record in decades. Prudence requires that one book some profit, deleverage, reduce risk, and take some money off the table at these euphoric highs.
That especially applies to myself. If I make any more than the 22% I have clocked so far in 2013, nobody will believe it anyway. So why risk everything I?ve made just to make another 20%. Who wants to start over again if the wheels suddenly fall off the market?
That is what prompted my flurry of Trade Alerts at the Thursday morning opening, which saw me bail on my most aggressive positions in the (SPY) and the (IWM), taking profits on my nearest money strikes. I did maintain the bulk of my portfolio, which is still in much farther out-of-the-money strikes, and in short positions in the Japanese yen. I also added to my short positions, buying out-of-the-money bear put spreads on the (SPY), betting that even if we continue up, it won?t be in the ballistic, devil may care fashion that we saw in January.
There are, in fact, real reasons out there for the market to fall. You need look no further than the calendar, which I eloquently outlined the dangers of, in my piece ?February is the Cruelest Month? (click here).
On March 1, the sequestration cuts hit. The 2% increase in payroll taxes has yet to be reflected in slower consumer spending. Federal income taxes have already gone up on those earning over $450,000 a year. This is important, as the top 20% of income earnings account for 40% of consumer spending, and consumer spending delivers 70% of all consumption.
Although it has been postponed by three months, we have a debt ceiling crisis looming that will have to result in spending cuts across the board. My favorite stealth drag on the economy, the paring back of major tax deductions, will be the next big issue to be fought over publicly (the oil depletion allowance versus alternative energy tax credits, and so on, and so on).
All of this adds up to a 1.5% reduction in US GDP growth this year. When you are starting with a feeble, tepid, and flaccid 2% rate, that does not leave much for us to live on. This is how disappointments turn into recession. IT is no empty threat, as many US corporations are seeing earnings slow, and could well disappoint with the next quarter?s results.
This is why I predicted an ?M? shaped year in my ?2013 Annual Asset Class Review? which I am still standing by (click here). We are already well into the heady run up to construct the left leg of the ?M?. Next comes the heart rending ?V? in the middle. Some analysts are amazed that we have gone this far in front of such daunting challenges and haven?t already collapsed. I think that is going to be April or May business, given the humongous cash flows we have witnessed.
This Bull May Not Have Long to Live
https://www.madhedgefundtrader.com/wp-content/uploads/2013/02/Bull.jpg293419Mad Hedge Fund Traderhttps://madhedgefundtrader.com/wp-content/uploads/2019/05/cropped-mad-hedge-logo-transparent-192x192_f9578834168ba24df3eb53916a12c882.pngMad Hedge Fund Trader2013-02-08 09:45:152013-02-08 09:45:15How This Bull Market Will Die
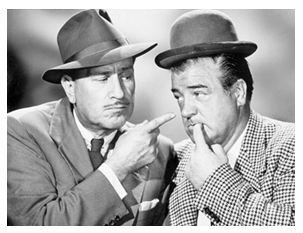
There have been complaints about the quality of government data as long as there have been stock markets. The US is not much better than emerging markets, like China, where numbers are subject to huge, after the fact revisions. A broker friend of mine emailed the conversation below, which has been circulating around the street. Enjoy.
Costello: I want to talk about the unemployment rate in America. Abbott: Good subject. Terrible times. It's 7.8%. Costello: That many people are out of work? Abbott: No, that's 14.7%. Costello: You just said 7.8%. Abbott: 7.8% unemployed. Costello: Right 7.8% out of work. Abbott: No, that's 14.7%. Costello: OK, so it's 14.7% unemployed. Abbott: No, that's 7.8%. Costello:?Wait a minute. Is it 7.8% or 14.7%? Abbott: 7.8% are unemployed. 14.7% are out of work. Costello: If you are out of work, you are unemployed. Abbott: No, Congress said you can't count the "out of work" as the unemployed.?You have to look for work to be unemployed. Costello:?But they are out of work!!! Abbott: No, you miss his point. Costello: What point? Abbott: Someone who doesn't look for work can't be counted with those who look for work. It wouldn't be fair. Costello: To whom? Abbott: The unemployed. Costello: But?all?of them are out of work. Abbott: No, the unemployed are actively looking for work. Those who are out of work gave up looking and if you give up, you are no longer in the ranks of the unemployed. Costello: So if you're off the unemployment roles, that would count as less unemployment? Abbott: Unemployment would go down. Absolutely! Costello: The unemployment just goes down because you don't look for work? Abbott: Absolutely it goes down. That's how they get it to 7.8%. Otherwise it would be 14.7%. Our government doesn't want you to read about 14.7% unemployment. Costello: That would be tough on those running for reelection. Abbott: Absolutely. Costello: Wait, I got a question for you. That means there are two ways to bring down the unemployment number? Abbott: Two ways is correct. Costello: Unemployment can go down if someone gets a job? Abbott: Correct. Costello: And unemployment can also go down if you stop looking for a job? Abbott: Bingo. Costello: So there are two ways to bring unemployment down, and the easier of the two is to have people stop looking for work. Abbott: Now you're thinking like an economist. Costello: I don't even know what the hell I just said! Abbott: Now you're thinking like Congress.
So, Who?s on First?
https://www.madhedgefundtrader.com/wp-content/uploads/2013/02/Abbott-Costello.jpg233303Mad Hedge Fund Traderhttps://madhedgefundtrader.com/wp-content/uploads/2019/05/cropped-mad-hedge-logo-transparent-192x192_f9578834168ba24df3eb53916a12c882.pngMad Hedge Fund Trader2013-02-08 09:34:072013-02-08 09:34:07The Cruel Truth About Government Statistics
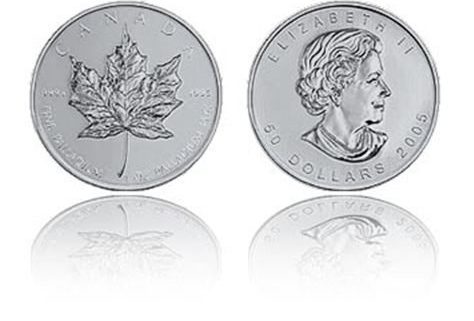
Palladium has caught absolutely on fire in recent months. The ETF (PALL) for the hedge fund darling has soared by 34% since the September low, and shows no sign of slowing. The CFTC announced that speculative positions in palladium futures leapt 12% last week to an all time high.
Also known as the ?poor man?s platinum,? demand for palladium for jewelry in China has been soaring with the growth of the middle class. On top of this, you can add huge new investment demand from the palladium ETF, which launched three years ago. As of yesterday, it boasted $500 million in assets, which amounts to a breathtaking 9.3% of 2011?s 7 million ounce global production.
Car manufacturers consume huge amounts of the white metal to make catalytic converters, which are used to scrub the emissions of vehicle air pollution. They could turn out as many as 15.5 million cars this year, up from a paltry 9 million annual rate during the dark days of 2009. Remember cash for clunkers?
Fewer than one million of these will be hybrids or electrics. That means industry demand for catalytic converters is ramping up by 5.5 million units a year from the lows.?That is a lot of palladium, and platinum (PPLT), the substitute metal.
Some 80% of the world?s palladium production comes from Russia and South Africa, dubious sources on the best of days. So a long position in this white metal gives you a free call on political instability in these two less than perfectly run countries. Last year, Russia cut the amount of palladium released from stockpiles from 1 million ounces to only 100,000. Strikes in South Africa have recently crimped supply there.
For traders, it is kind of late to get involved in (PALL) here from the long side. What is of value now is the predictive power palladium has recently achieved. It perfectly called the bottom of all risk assets in August. It ducked the Federal Reserve?s QE3 head fake in September and kept going up. It then ducked a second head fake in November with the tax loss selling that ensued after the presidential election, maintaining its appreciation. It was off to the races once again at the beginning of January.
The message here is that if you are ever in doubt about the short-term direction of the markets, check out palladium. If it is still going ballistic it means buy every dip. If it isn?t, you should sell everything.
https://www.madhedgefundtrader.com/wp-content/uploads/2013/02/Canadian-Coin.jpg390474Mad Hedge Fund Traderhttps://madhedgefundtrader.com/wp-content/uploads/2019/05/cropped-mad-hedge-logo-transparent-192x192_f9578834168ba24df3eb53916a12c882.pngMad Hedge Fund Trader2013-02-06 23:04:002013-02-06 23:04:00How Much to Go With Palladium?
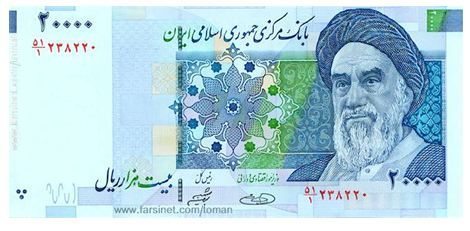
The Iranian Rial (IRR) has just suffered one of the most cataclysmic crashes in the history of the foreign exchange markets. It is off a mind numbing 75% since the beginning of 2011. One dollar now buys 12,200 Rials. Watch out Zimbabwe!
When communications between intelligence agencies suddenly spike, as has recently been the case, I sit up and take note. Hey, do you think I talk to all of those generals because I like their snappy uniforms, do you?
The word is that the despotic, authoritarian regime in Syria is on the verge of collapse, and is unlikely to survive more than a few more months. The body count is mounting, and the only question now is whether Bashar al-Assad will flee to an undisclosed African country or get dragged out of a storm drain to take a bullet in his head a la Gaddafi. It couldn?t happen to a nicer guy.
The geopolitical implications for the US are enormous.? With Syria gone, Iran will be the last rogue state hostile to the US in the Middle East, and it is teetering. The next and final domino of the Arab spring falls squarely at the gates of Tehran.
Remember that the first real revolution in the region was the street uprising there in 2009. That revolt was successfully suppressed with an iron fist by fanatical and pitiless Revolutionary Guards. The true death toll will never be known, but is thought to be in the thousands. The anti-government sentiments that provided the spark never went away and they continue to percolate just under the surface.
At the end of the day, the majority of the Persian population wants to join the tide of globalization. They want to buy IPods and blue jeans, communicate freely through their Facebook pages and Twitter accounts, and have the jobs to pay for it all. Since 1979, when the Shah was deposed, a succession of extremist, ultraconservative governments ruled by a religious minority, have failed to cater to these desires.
When Syria collapses, the Iranian ?street? will figure out that if they spill enough of their own blood that regime change is possible and the revolution there will reignite. The Obama administration is now pulling out all the stops to accelerate the process. The new Secretary of State, John Kerry, will stiffened his rhetoric and work tirelessly behind the scenes to bring about the collapse of the Iranian economy.
The oil embargo is steadily tightening the noose, with heating oil and gasoline becoming hard to obtain in this oil producing country. Yes, Russia and China are doing what they can to slow the process, but conducting international trade through the back door is expensive, and prices are rocketing. The unemployment rate is 25%.
Iranian banks have been kicked out of the SWIFT international settlements system, a death blow to their trade. That is what the Standard Chartered money laundering scandal last year was all about. Sure, you can sell oil one truckload at a time for cash. Try doing that with 3 million barrels a day of which should fetch $270 million. That?s a lot of Benjamins. Forget the fives and tens.
Let?s see how docile these people remain when the air conditioning quits running because of power shortages. With their currency now worthless, it has become impossible to import anything. This is causing severe shortages of everything under the sun, especially foodstuffs, which in some cases have more than doubled in price in months.
What does the government in Tehran say about all of this? Blame it on the speculators. Sound familiar?
Iran is a rotten piece of fruit ready to fall of its own accord and go splat. The Obama administration is doing everything it can to shake the tree. No military action of any kind is required on America?s part. Think of it as victory on the cheap.
The geopolitical payoff of such an event for the US would be almost incalculable. A successful Iranian revolution will almost certainly produce a secular, pro-Western regime whose first priority will be to rejoin the international community and use its oil wealth to rebuild an economy now in tatters.
Oil will lose its risk premium, now believed by the oil industry to be $30 a barrel. A looming oversupply could cause prices to drop to as low as $30 a barrel. This would amount to a gigantic $1.66 trillion tax cut for not just the US, but the entire global economy as well (87 million barrels a day X 365 days a year X $100 dollars a barrel X 50%).
Almost all funding of terrorist organizations will immediately dry up. I might point out here that this has always been the oil industry?s worst nightmare. Commercial office space in Houston may not do so well either, as imports account for 80% of the oil majors? profits.
At that point, the US will be without enemies, save for North Korea, and even the Hermit Kingdom could change with a new leader in place. A long Pax Americana will settle over the planet.
The implications for the financial markets will be enormous. The US will reap a peace dividend as large, or larger, than the one we enjoyed after the fall of the Soviet Union in 1992. As you may recall, that black swan caused the Dow Average to soar from 2,000 to 10,000 in less than eight years, also partly fueled by the technology boom.
A collapse in oil imports will cause the US dollar to rocket.? An immediate halving of our defense spending to $400 billion or less and burgeoning new tax revenues would cause the budget deficit to collapse. With the US government gone as a major new borrower, interest rates across the yield curve will fall further.
A peace dividend will also cause US GDP growth to reaccelerate from a tepid 2% rate to a more robust 4%. Risk assets of every description will soar to multiples of their current levels, including stocks, junk bonds, commodities, precious metals, and food. The Dow will soar to 30,000, the Euro collapses to parity, gold rockets to $3,000 an ounce, silver flies to $100 an ounce, copper leaps to $6 a pound, and corn recovers $8 a bushel. The 60-year bull market in bonds ends in a crash.
Some 1 million of the armed forces will get dumped on the job market as our manpower requirements shrink to peacetime levels. But a strong economy should be able to soak right up these well-trained and motivated. We will enter a new Golden Age, not just at home, but for civilization as a whole.
Wait, you ask, what if Iran develops an atomic bomb and holds the US at bay? Don?t worry. There is no Iranian nuclear device. There is no real Iranian nuclear program. The entire concept is an invention of Israeli and American intelligence agencies as a means to put pressure on the regime and boost their own budget allocations. The head of the miniscule effort they have was assassinated by Israeli intelligence last year (a magnetic bomb, placed on a moving car, by a team on a motorcycle, nice!). What nuclear infrastructure they have is being decimated by computer viruses as I write this.
If Iran had anything substantial in the works, the Israeli planes would have taken off a long time ago. There is no plan to close the Straits of Hormuz, either. The training exercises in small rubber boats we have seen are done for CNN?s benefit, and comprise no credible threat.
I am a firm believer in the wisdom of markets, and that the marketplace becomes aware of major history changing events well before we mere individual mortals do. The Dow began a 25-year bull market the day after American forces defeated the Japanese in the Battle of Midway in May of 1942, even though the true outcome of that confrontation was kept top secret for years.
If the collapse of Iran was going to lead to a global multi decade economic boom and the end of history, how would the stock markets behave now? They would rise virtually every day, offering no substantial pullbacks for latecomers to get in. That is exactly what they have been doing since mid-November.
Here?s The Next Big Short
Not Worth So Much Today
https://www.madhedgefundtrader.com/wp-content/uploads/2013/02/Rial.jpg231470Mad Hedge Fund Traderhttps://madhedgefundtrader.com/wp-content/uploads/2019/05/cropped-mad-hedge-logo-transparent-192x192_f9578834168ba24df3eb53916a12c882.pngMad Hedge Fund Trader2013-02-06 09:03:502013-02-06 09:03:50Why You Should Care About the Iran Rial Collapse
I received a few emails from readers whose option holdings have been exercised against them, and have asked me for advice on how best to proceed. So, here we go.
The options traded on US exchanges are American style, meaning that they can be exercised at any time by the owner. This is opposed to European style options, which can only be exercised on the expiration day.
The call option spreads that I have been recommending for the past year are composed of a deep out-of-the-money long strike price and a short portion at a near money strike price. ?When stocks have high dividends, there is a chance that the near money option you are short gets exercised against you. This requires you to deliver the stock equivalent of the option you are short, plus any quarterly dividends that are due.
You get notice of this assignment in an email after the close. You then need to email or call your broker back informing him that you want to exercise your remaining long option position to meet your assigned short position. This should completely close out your position. This is not an automatic process and requires action on your part.
Assignments are made on a random basis by an exchange computer, and can happen any day. Exercise means the owner completely loses the premium on his at-the-money call. Dividends have to be pretty high to make such a move economic, usually at least over 3% on an annual rate. But these days, markets are so efficient that traders, or their machines, will exercise options for as single penny profit.
Assignments create a risk for option spread owners in a couple of ways. If you don?t check your email every day, you might not be aware that you have been assigned. Alternatively, emails sometimes get lost, or hung up in local servers, which occasionally happens to readers of my own letter. Then, you are left with the long side deep out-of-the-money call alone, which will have a substantially higher margin requirement.
If you don?t have the cash in your account to cover this, you could get a margin call. If you ignore this call as well, your broker will close out your position at market without your permission. You shouldn?t lose much, if any, money in this event, as your long and short options positions perfectly hedge each other. But it could produce some disconcerting communications from your broker. Brokers generally hate issuing margin calls, and could well close your account if it is too small to bother with, as they create regulatory issues.
It order to get belt and braces coverage on this issue, it is best to call your brokers and find out exactly what their assignment policies and procedures are. Believe it or not, some are still in the Stone Age, and have yet to automate the assignment process or give notice my email.
The readers I have heard from still had a profit in the positions after an assignment, albeit a smaller one. Consider it a cost of doing business, or a frictional cost. In-the-money options are still a great strategy. But you should be aware of all the potential costs and risks to get the most benefit.
John Thomas
00Mad Hedge Fund Traderhttps://madhedgefundtrader.com/wp-content/uploads/2019/05/cropped-mad-hedge-logo-transparent-192x192_f9578834168ba24df3eb53916a12c882.pngMad Hedge Fund Trader2013-02-06 08:57:522013-02-06 08:57:52When Your Options Are Exercised
Actually, it is the second cruelest month. September is the worst, as indicated by the table below, put together by my friends at Stockcarts.com.
I think you have to get some sort of pullback between now and March 15, like of the 2%-4% range. It?s not that we are without fundamental reasons to do so. Don?t forget, we have a sequestration deadline looming on March 1, when the world as we know it is supposed to end. However, what is more likely is that Wall Street calls Washington?s bluff, since the last several Armageddon?s have failed to materialize.
Another possibility is that it grinds sideways in a narrowing range with diminishing volatility, because there are still so many investors trying to get in. If you believe, as I do, that markets will do whatever they have to do to screw the most people, then this is your scenario.
The only choices are down, or sideways. Trees don?t go to the sky, and markets don?t go up forever. I think long side plays in equities from here on will be a story of diminishing returns.
This is why I started selling short out of the money calls and call spreads on the S&P 500 (SPY), (SPX) first thing Monday morning. In either scenario these expire at their maximum point of profitability on March 15. These will help hedge, and lower the average breakeven points of my remaining long side plays in the market.
The move we have seen in stocks this year has been one of the most extended in 18 years, since back when the Dow was trading at about 3,000. These positions will partially hedge the remaining long positions that currently bulk up our portfolio. There is absolutely no way that we will repeat the January performance in February.
Yes, this is a short position. Warning: I have issued so many Trade Alerts for call spreads in the past two months, about 60, that readers forgot what bearish trades looked like. When I issued my Trade Alert on bear put spreads this morning, some readers went ahead and bought the call spread anyway.
Advice: for these alerts to work, you have to read them first.
Looks Like Another No Show
https://www.madhedgefundtrader.com/wp-content/uploads/2013/01/Lady-Liberty.jpg218421Mad Hedge Fund Traderhttps://madhedgefundtrader.com/wp-content/uploads/2019/05/cropped-mad-hedge-logo-transparent-192x192_f9578834168ba24df3eb53916a12c882.pngMad Hedge Fund Trader2013-02-05 09:34:572013-02-05 09:34:57February is the Cruelest Month
Legal Disclaimer
There is a very high degree of risk involved in trading. Past results are not indicative of future returns. MadHedgeFundTrader.com and all individuals affiliated with this site assume no responsibilities for your trading and investment results. The indicators, strategies, columns, articles and all other features are for educational purposes only and should not be construed as investment advice. Information for futures trading observations are obtained from sources believed to be reliable, but we do not warrant its completeness or accuracy, or warrant any results from the use of the information. Your use of the trading observations is entirely at your own risk and it is your sole responsibility to evaluate the accuracy, completeness and usefulness of the information. You must assess the risk of any trade with your broker and make your own independent decisions regarding any securities mentioned herein. Affiliates of MadHedgeFundTrader.com may have a position or effect transactions in the securities described herein (or options thereon) and/or otherwise employ trading strategies that may be consistent or inconsistent with the provided strategies.