Boy, am I spoiled for choice on what to do this weekend. On the one hand, I have been invited to join the president on the reviewing stand for Monday?s inauguration in Washington DC. On the other, the Maverick?s World Surf competition near California?s Half Moon Bay is on the same day, which has not been held for three years.
I have to admit that it is temping to don my wetsuit, throw my Firewire Dominator board into the back of my Highlander, and catch some 40-foot waves with the best in the world. It is rare to get these monster waves on the California coast, which are more often found at Waimea Bay on Oahu?s North Shore. But the mid Pacific buoy says they are headed our way.
I can?t tell you what impossible mission I accomplished to get invitations like these. If I did, I would have to kill you.
In the end, it?s my readership that will decide the issue. I think I can gain more market insight hanging for a day with the cabinet, the Supreme Court, and the leaders of Congress and the Federal Reserve, than a bunch of surfer dudes. It is especially critical that I gauge their thinking, since there are so many momentous political events hanging over the financial markets these days.
I also don?t want to risk offending the president, as I might lose my special access and get cut off his Christmas card list. So I?ll let you know what I decide. In the meantime, on Monday, look for me about ten rows behind the Chief Justice during the swearing in ceremony. And you can catch the Mavericks on ESPN.
https://www.madhedgefundtrader.com/wp-content/uploads/2013/01/Surfing.jpg298455Mad Hedge Fund Traderhttps://madhedgefundtrader.com/wp-content/uploads/2019/05/cropped-mad-hedge-logo-transparent-192x192_f9578834168ba24df3eb53916a12c882.pngMad Hedge Fund Trader2013-01-17 23:01:132013-01-17 23:01:13Spoiled for Choice
Master Limited Partnerships have been on fire since the beginning of the year. Once the deal on the ?Fiscal Cliff? was done, and these instruments? special tax treatment protected, it was off to the races. These unique and versatile instruments combine the tax benefits of a limited partnership with the liquidity of publicly traded securities.
The explosion in demand has created a new issue boom. SunCoke Energy Partners (SXCP) makes coking coal used in the steel production process, came to market this week boasting an 8.25% yield. Then, CVR Refining (CVRR), which specializes in petroleum refining in Texas and Oklahoma, upped the ante with an eye popping 18.8% yield. These things can?t be that high risk!
Enbridge Energy Partners (EEP) is run by some of my former colleagues at Morgan Stanley and offers a 7% yield. Kinder Morgan Energy (KMP) posts a healthy 5.8% yield, while Trans Mountain (TLP) ups the ante with an 8% return. Linn Energy goes all the way up to a healthy 6.3% yield.
Why the enticing cash flow? The problem is that these partnerships suffer from their guilt by association with Texas Tea, which is notorious for its volatility. Although they have no direct exposure to the price of oil, investors tend to incorrectly classify them as energy stocks and dump them whenever oil falls. The great thing about these high yields is that you get paid to wait until crude makes a comeback, which it will always do, as long as there is a China. Not a bad game to play in a zero return world.
To qualify for MLP status, a partnership must generate at least 90 percent of its income from what the Internal Revenue Service deems ?qualifying? sources. For many MLPs, these include all manner of activities related to the production, processing or transportation of oil, natural gas and coal.
Energy MLPs are defined as owning energy infrastructure in the U.S., including pipelines, natural gas, gasoline, oil, storage, terminals, and processing plants. These are all special tax subsidies put into place when oil companies suffered from extremely low oil prices. Once on the books, they lived on forever.
In practice, MLPs pay their investors through quarterly distributions. Typically, the higher the quarterly distributions paid to LP unit holders, the higher the management fee paid to the general partner. The idea is that the GP has an incentive to try to boost distributions through pursuing income-accretive acquisitions and organic growth projects.
Because MLPs are partnerships, they avoid the corporate income tax, on both a state and federal basis. Instead of getting a form 1099-DIV and the end of the year, you receive a form K-1, which your accountant should know how to handle. The only problem with this set up is that the partnerships are required to send you a K-1 for every state in which they do business. Own enough of these, and your tax return will end up as thick as the Houston telephone book.
Additionally, the limited partner (investor) may also record a pro-rated share of the MLP?s depreciation on his or her own tax forms to reduce liability. This is the primary benefit of MLPs and gives MLPs relatively cheap funding costs.
The tax implications of MLPs for individual investors are complex. The distributions are taxed at the marginal rate of the partner, unlike dividends from qualified stock corporations. On the other hand, there is no advantage to claiming the pro-rated share of the MLP?s depreciation (see above) when held in a tax deferred account, like an IRA or 401k. To encourage tax-deferred investors, many MLP?s set up corporation holding companies of LP claims which can issue common equity.
Since 2003, MLPs as an asset class have grown astronomically, from $30 billion to over $250 billion, and have also been the best performing asset class in the world over the last 10, 5, and 3 year periods. The recent discovery of new, massive gas and oil fields in the US and the rapid expansion of shale fracking should auger well for the rising popularity of this instrument.
If you don?t want to bet the ranch putting all you money into a single issue, you might consider the JP Morgan Alerian MLP Index ETN (AMJ), with a 5.35% yield. You give up some yield here in exchange for a broader diversification of risk across many issues in this quasi index fund. For many, it will be worth it to just to sleep at night.
Nope, Don?t See Any Yield Yet
https://www.madhedgefundtrader.com/wp-content/uploads/2013/01/Pipeline.jpg251388Mad Hedge Fund Traderhttps://madhedgefundtrader.com/wp-content/uploads/2019/05/cropped-mad-hedge-logo-transparent-192x192_f9578834168ba24df3eb53916a12c882.pngMad Hedge Fund Trader2013-01-16 23:02:352013-01-16 23:02:35MLP?s Are On Fire
I have always believed that if you don?t have a sense of humor, then you better get the hell out of this business. Below is a link to a YouTube video entitled ?All I Want to do is Retire? which covers the decline of the brokerage industry over the last 20 years. The video is currently going viral and sent to me by a subscriber. Watch this during your next coffee break. The run time is five minutes. Sometimes the truth can be hard to swallow. Click here
https://www.madhedgefundtrader.com/wp-content/uploads/2013/01/Dollar-in-Vice.jpg295355Mad Hedge Fund Traderhttps://madhedgefundtrader.com/wp-content/uploads/2019/05/cropped-mad-hedge-logo-transparent-192x192_f9578834168ba24df3eb53916a12c882.pngMad Hedge Fund Trader2013-01-16 23:01:292013-01-16 23:01:29All I Want to do is Retire
I?ll give myself a ?B? on this one. Sure, with the Trade Alert Service generating a 14.87% net profit for the year, I was able to bring in double the Dow average, and triple what most hedge funds delivered, including some of the biggest ones.
But for once, I did not achieve true greatness. I feel that, given the amount of work I did, I should have done much better. I issued 230 Trade Alerts in rapid-fire succession with a ?to die for? success rate of 70%.
I managed to capture these gains with half the market volatility of 2011. While the Volatility Index (VIX) reached the lofty height of 49% in 2011, in 2012 we managed to eke out a peak of only 27%, and that was only for a few nanoseconds. In fact, volatility was down for almost the entire year, save for a brief spike in May, and some yearend short covering.
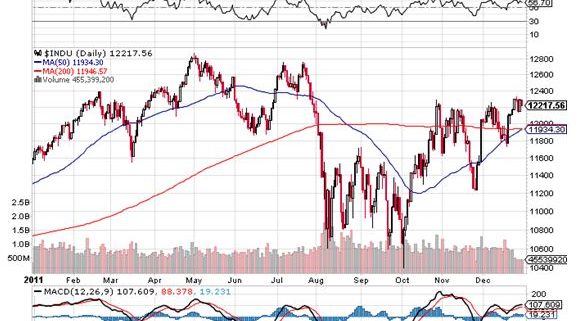
In 2011, I had a much higher range in the market to work with, the high for the Dow coming in at 12,850 and the low at 10,400, for a total range of 2,450 points. In 2012, the range was only 1,630 points, making it a much more difficult market to work with. This meant shifting from outright call and put option positions to spreads, in order to keep the dosh reliably rolling in.
Nevertheless, I made some serious money in 2012. The best trade of the year was a call spread in the S&P 500, which nicely caught the yearend rally in equities, producing a 4.75% profit for the notional $100,000 portfolio. The worst was a short position in Boeing (BA), which cost me a gut wrenching 8.70%.
In terms of asset classes, foreign exchange trading was far and away my biggest earner, adding 11.85% in positive performance. This was because I shorted volatility in the Japanese yen (FXY), (YCS) for the first three quarters of the year when it flat lined, and then went aggressively short when the big break to the downside came. Thank you Mr. Shinzo Abe, Japan?s new prime minister, who championed the beleaguered country?s assertive weak yen policy during the December elections! Shorts in the Euro (FXE), (EUO) also chipped in.
Gold (GLD) was my second income producer, taking in 6.40%. I timed the summer rally in the barbarous relic perfectly, and shook it by the lapels until its gold teeth came chattering out. I would have made more, but the yellow metal then died on the announcement of Ben Bernanke?s QE3, much to everyone?s surprise.
My five years spent drilling for oil and gas in West Texas came in handy once again, netting 4.75% in gains. This was entirely made on the short side. Friends calling me from the Lone Star State with tales of endless oil gluts gushing forth from North Dakota encouraged me to be more bold in selling the (USO) than I might have otherwise.
I was also a fairly nimble bond trader in 2012 (TLT), (TBT), harvesting another 1.62% in profits. I correctly called the top in prices/bottom in yields in August, but failed to capitalize with bigger short positions. This could be a big trade in 2013.
Ah, now for the hard part. Not every trade was a winner in 2012, although many of the losers were hedges for long side plays that ultimately made money. Trading in the index ETF options for the S&P 500 (SPY) and the Russell 200 (IWM) lost -1.30%. An early long position in the volatility Index (VXX) eroded -3.42% from the performance. Fortunately, I bailed from that strategy quickly.
Options positions in individual equities bled me by another -9.54%. Almost the entire loss came from one stock, Apple (AAPL), which is still perplexing the street. I managed the first $150 decline in the stock admirably. After that, it was a bloodbath. Never have I seen a share price divorce itself so dramatically from the underlying fundamentals. Either something terrible is about to happen to Steve Jobs? creation, or the stock market has got it all wrong.
This was one tricky year to trade. I started off all right, clocking gains in January and February. I correctly anticipated another ?Sell in May, and go away? year. But I underestimated the extent that volatility would fall. Melting option premiums absolutely took me to the cleaners in March and April.
When I realized the problem, I switched from outright options to spreads, which included a short volatility element to every single position. That launched a white-hot run of 25 consecutive profitable trades from April to September.
Then Ben Bernanke caught me by surprise, launching QE3 sooner than expected, just before the presidential election. That forced me to stop out of positions that turned good only days later. I correctly called the outcome of the election in all 50 states. But the big Obama win caught many portfolio managers by surprise, who responded by dumping positions to realize capital gains and beat expected tax increases. That took the (SPX) down 10%, leaving the market unchanged on the year by mid November. This cost me more money.
I redeemed myself by accurately calling the yearend rally and going aggressively long. In the end, the ?Fiscal Cliff? that was supposed to crash the market was little more than a media invention. Stocks closed on their highs.
It was one of the tougher years in my career, so I was quite happy to deliver double-digit profits for my readers. It was also a learning experience. After slogging through 45 years in this business, I still occasionally commit the same blunders as a first year trainee. Don?t we all.
Hopefully, you learned something too from my outpouring of 400,000 words in the 250 daily letters that I penned during the year analyzing every investment theme under the sun. You should have also gained some insight from the 22 biweekly webinars I produced. You also had a chance to expand your horizons at by 26 strategy luncheons and speaking engagements held around the world.
2013 will be better, as our blistering gains so far testify.
The Dow in 2011
The Dow in 2012
The Volatility Index in 2012
Good Luck and Good Trading
John Thomas
The Mad Hedge Fund Trader
https://www.madhedgefundtrader.com/wp-content/uploads/2013/01/INDU-2011.jpg475581Mad Hedge Fund Traderhttps://madhedgefundtrader.com/wp-content/uploads/2019/05/cropped-mad-hedge-logo-transparent-192x192_f9578834168ba24df3eb53916a12c882.pngMad Hedge Fund Trader2013-01-16 09:26:062013-01-16 09:26:06My 2012 Report Card
From time to time I receive an email from a subscriber telling me that they are unable to get executions on trade alerts that are as good as the ones I get. There are several possible reasons for this:
1) Markets move, sometimes quite dramatically so.
2) Your Trade Alert email was hung up on your local provider?s server, getting it to you late. This is a function of your local provider?s capital investment, and is totally outside our control.
3) The spreads on deep-in-the-money options spreads can be quite wide. This is why I recommend readers place limit orders to work in the middle market. Make the market come to you.
4) Hundreds of market makers read Global Trading Dispatch. The second they see one of my Trade Alerts, they adjust their markets accordingly. This is especially true for deep-in-the-money options. A spread can go from totally ignored to a hot item in seconds.
On the one hand, this is good news, as my Trade Alerts have earned such credibility in the marketplace. On the other hand, it is a problem for readers encountering sharp elbows when attempting executions.
5) Occasionally, emails just disappear into thin air. This is cutting edge technology, and sometimes it just plain doesn?t work. This is why I strongly recommend that readers sign up for my free Text Alert Service as a back up.
The bottom line on all of this is that the prices quoted in my Trade Alerts are just ballpark ones with the intention of giving traders some directional guidance. You have to exercise your own judgment as to whether the risk/reward is sufficient with the prices you are able to execute yourself. Sometimes it is better to pay up by a few cents rather than miss the big trend. The market rarely gives you second chances.
Good luck and good trading.
John Thomas
00Mad Hedge Fund Traderhttps://madhedgefundtrader.com/wp-content/uploads/2019/05/cropped-mad-hedge-logo-transparent-192x192_f9578834168ba24df3eb53916a12c882.pngMad Hedge Fund Trader2013-01-15 09:29:152013-01-15 09:29:15On Executing Trade Alerts
I was in a huge hurry last week when I sent out a Trade Alert to buy insurance giant American International Group (AIG), operating from a Chicago hotel suite with a stock market that was flying. Now that I am home, and have single handedly brought Oakland?s crime wave to a juddering halt, I have an opportunity to go into depth on this troubled company.
I know it well, as it originally started out in Shanghai to insure the once sizeable Jewish and white Russian community there. When the communists took over China in 1949, it moved its entire business to Japan. Its skyscraper just across the moat from the Imperial Palace still maintains a conspicuous presence on the Tokyo skyline.
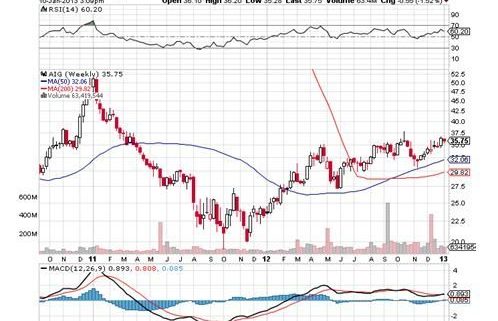
Buy sun hats in the winter and snow boots in the summer. That?s the simple argument. The stock market equivalent to this is to buy insurance company shares in the wake of a giant hurricane, as we had with Hurricane Sandy in November. That?s because companies can jack up rates enormously after disasters such as these, just when the probability of another storm declines, to the benefit of the bottom line. Investment sage, Warren Buffet, figured this out 60 years ago, which is why he has carried major holdings in this sector ever since.
I picked (AIG) in particular because it has a whole raft of special circumstances. You may recall that the company went bust in 2009 after massively leveraged derivatives bets by its Greenwich, CT office went awry. Because it was feared that the extent of their bets would take down the entire global financial system, the Treasury stepped in with a whopping $183 billion bailout.
Much of this money went to European banks, and some $165 million was paid out as retention bonuses to the errant staff. It was the most despised rescue in the history of US financial markets.
I believe it was the single largest policy error of the Obama administration. Instead of honoring AIG?s obligations in full, I would have offered 50 cents on the dollar, which the creditors would have taken in a heartbeat at the time. But the new Obama administration had exactly a week to figure this out, with no time for research or analysis. When your ship is on fire and sinking, you don?t spend a lot of time figuring out what kind of fire hose to use.
In the end, the government made a $23 billion profit on the deal, dumping its last 15% share of the company in December. It was largely assisted by the bond market bubble, which panicked investors of every stripe to reach for yield, including that offered by the impossible to define garbage on AIG?s books. In the end, (AIG) turned out be to a gigantic, hyper leveraged call on the corporate bond market.
With the government out of its hair now, it is suddenly a whole new world for AIG. Investors had been avoiding the stock like the plague, as the ever present risk of a government unload was capping the share price. You only need 10 institutional investors to take 5% weightings each to soak up the entire government holding.
The company, which consists of its core U.S. life, global property and casualty, and U.S. mortgage insurance units, will now have to focus on turning around earnings at the property and casualty business, formerly known as Chartis. As a stand-alone entity, the investment case for (AIG) is really quite compelling. It is trading at a big discount to book, and is even a bigger bargain when compared to its insurance industry peers.
On top of this, the company is a big asset story. It still retains some securities that originally got it into trouble, which are marked at, or close to, zero. As these are sold out into a frothy bond market, huge profits will be realized. What we don?t know is how much money regulators will allow the company to take out of reserves to book in profits or pay in dividends.
As for the lawsuit just announced by former owner, Hank Greenberg, (which AIG has refused to participate in) claiming that the government paid an unfairly low price for the company, you can forget about it. This is more about salving an ego than pursuing a legitimate economic claim. If he had done a better job managing his risk, AIG would not have gone under in the first place. What is a fair price for an illiquid asset when the world is ending?
I Think I?ll Buy Some Insurance Companies
https://www.madhedgefundtrader.com/wp-content/uploads/2013/01/AIG-1-10-13.jpg396498Mad Hedge Fund Traderhttps://madhedgefundtrader.com/wp-content/uploads/2019/05/cropped-mad-hedge-logo-transparent-192x192_f9578834168ba24df3eb53916a12c882.pngMad Hedge Fund Trader2013-01-10 23:03:232013-01-10 23:03:23The Bull Case for AIG
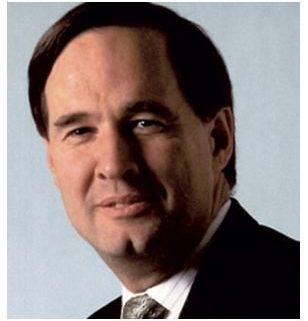
I have been relying on David Hale as my de facto global macro economist for decades, and I never miss an opportunity to get his updated views. The challenge is in writing down David?s eye popping, out of consensus ideas fast enough, because he spits them out in such a rapid-fire succession.
Since David is an independent economic advisor to many of the world's government?s, largest banks, and investment firms, I thought his views would be of riveting interest. It was with great pleasure that I joined him for lunch at the Federal Reserve Bank of San Francisco to discuss the outlook for Asia.
David sees the US economy growing by 2.5% in 2013, China by 8.5%, but for much of Europe to remain in recession. He sees the best growth opportunities in Southeast Asia, which delivered stellar results last year.
The Philippines grew by 6.6% and has the best long-term outlook of all. Some 600,000 now work there in the call center and support business, and the industry is growing at a breakneck pace. Personal consumption is flying, and the government is about to launch a major infrastructure program. Heaven knows they need it, as I recall the roads there are absolutely deplorable. The ETF (EPHE) was on fire last year, up some 56%, making it one of the best performing single country funds.
Indonesia (IDX) expanded by 6.1% in 2012, making a killing on energy and commodity exports to China and Japan. Its ETF was unchanged last year, but could be ready for take off. Thailand (THD) scored a 5.5% gain in its GDP, boosted by flood reconstruction, taking its ETF northward by 38%. Malaysia?s economy (EWM) expanded by 5.3%.
David has seen the same dramatic improvement that I have in the economic data from China over the last three months. This is in response to a moderate stimulus budget which they started to implement in the summer. Residential housing, which has been a major drag on the economy for the past year, is now starting to trend up. Liberalization of real estate lending is in the cards.
While the Middle Kingdom lost 20 million jobs during the 2008 crash, almost none disappeared in the latest slowdown. This year, Chinese consumption will exceed that of the US for the first time in history, at $470 billion compared to $403 billion.
The fight against corruption has emerged as a major domestic issue. Some 25% of all the luxury spending in China is though to be for gifts (bribes) to government officials. Mid level Mandarins caught wearing $50,000 watches are now getting fired.
David made some far out predictions that were real zingers. Population growth is grinding to a halt throughout Asia. It is already well below the replacement rate in Japan and South Korea, which will soon be joined by China. This will eventually lead to labor shortages in Asia, and bring to an end the cheap labor regime, which has driven their economies for the past 100 years. The Chinese work force will shrink from five times ours to only three times.
Their cost advantage then goes out the window. The upshot for us is that perhaps half of the 6 million jobs that America lost to China over the last 20 years will come back. Many items can now be bought cheaper in Chicago than they can in Shanghai.
China will still become far and away the world?s largest economy in our lifetimes. In 1700, Asia accounted for 58% of world GDP. Some 250 years of wars pulled that figure down to 15% by 1950. It is on track to recover to 50% by 2050.
To learn more about David Hale and the extensive list of services he offers, please visit the site of David Hale Global Economics at http://www.davidhaleweb.com.
https://www.madhedgefundtrader.com/wp-content/uploads/2013/01/David-Hale.jpg335308Mad Hedge Fund Traderhttps://madhedgefundtrader.com/wp-content/uploads/2019/05/cropped-mad-hedge-logo-transparent-192x192_f9578834168ba24df3eb53916a12c882.pngMad Hedge Fund Trader2013-01-10 10:02:482013-01-10 10:02:48Economist David Hale Says the Action will be in Southeast Asia
https://madhedgefundtrader.com/wp-content/uploads/2019/05/cropped-mad-hedge-logo-transparent-192x192_f9578834168ba24df3eb53916a12c882.png00Mad Hedge Fund Traderhttps://madhedgefundtrader.com/wp-content/uploads/2019/05/cropped-mad-hedge-logo-transparent-192x192_f9578834168ba24df3eb53916a12c882.pngMad Hedge Fund Trader2013-01-07 17:03:312013-01-07 17:03:31January 7, 2013
Legal Disclaimer
There is a very high degree of risk involved in trading. Past results are not indicative of future returns. MadHedgeFundTrader.com and all individuals affiliated with this site assume no responsibilities for your trading and investment results. The indicators, strategies, columns, articles and all other features are for educational purposes only and should not be construed as investment advice. Information for futures trading observations are obtained from sources believed to be reliable, but we do not warrant its completeness or accuracy, or warrant any results from the use of the information. Your use of the trading observations is entirely at your own risk and it is your sole responsibility to evaluate the accuracy, completeness and usefulness of the information. You must assess the risk of any trade with your broker and make your own independent decisions regarding any securities mentioned herein. Affiliates of MadHedgeFundTrader.com may have a position or effect transactions in the securities described herein (or options thereon) and/or otherwise employ trading strategies that may be consistent or inconsistent with the provided strategies.


 ??????? ? ? ? ? ? ?? ?????????????