My Fed Call. Survey traders and investors today, and you will find that 99% believe further quantitative easing via QE3 will be announced on Thursday. Poll vote Fed governors and you get a more realistic 50% probability. I think it is much less than that ? and therein lies the trade.
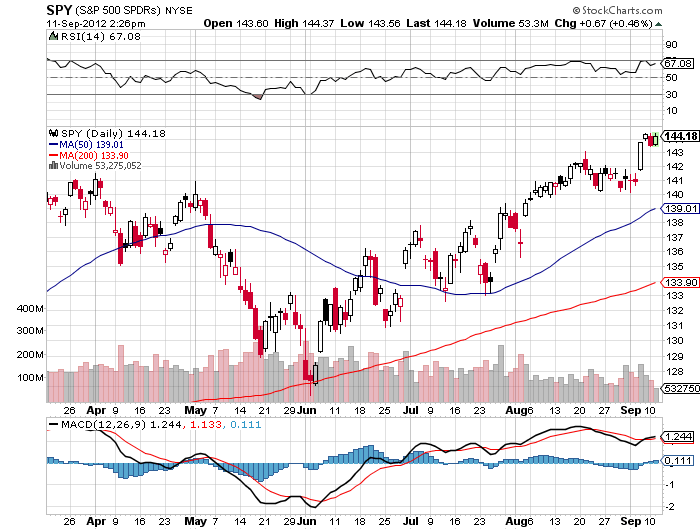
I think that markets are getting rather over-expended up here. They have been discounting the launch of QE3 since June 1, or more than three months. The (SPY) has rocketed some 12.7% from $128 to $144.33 during this time. It has also done this in the face of a dramatically weakening economy around the world.
This means that an asymmetric situation has developed in the (SPY). If the Fed delivers, as most hope, we may rally a little further up to maybe $145 and then churn sideways until the presidential election. If it disappoints, as I expect, you could get a sudden, gut-churning sell-off worth 5-10 points in the (SPY).
So caution argues for covering all of my short put positions, and running my long put positions through the Fed decision. It?s a heads I lose $1, tails I win $10 situation. I?ll take those odds all day long.
The good news is that the economy is just not bad enough for a full blown QE3. It is growing at a 1.5% annual rate. It is not shrinking. Corporate profits are at an all-time high. S&P 500 companies will come in around $100 a share this year, compared to $50 four years ago, and are hardly in need of a rescue. They are sitting on a $2 trillion mountain of cash, much of it offshore. I don?t see a QE3 anywhere in this.
The August nonfarm payroll figures further bolster this view. We came in at 96,000, some 29,000 less than consensus expectations. This is a far cry from the 700,000 in losses we were clocking 3? years ago. Gains of this magnitude are about half of what we should be at this stage of the economic cycle. But they certainly don?t justify a last-ditch emergency bailout.
The Fed is in the safety-net business, not the stepladder lending business, so you can boost asset prices ever higher. If you only have one bullet left you don?t waste it taking pot shots at empty beer bottles ? you wait until you are surrounded by Indians who are about to set the wagons on fire.
You could argue that the Fed?s dual mandate to focus on both employment and inflation would urge it to accelerate the printing presses to boost employment. However, there is little evidence that flooding the money supply will create additional jobs. It is simply pushing on a string. The hurricane-force demographic headwind the U.S. will face until 2022 assures there will be little demand for new workers no matter what the Fed does.
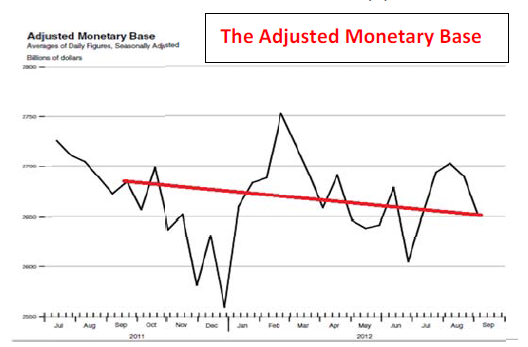
While offering little upside, QE3 does offer plenty of potential downside costs. For a start, it would expand the Fed?s balance sheet by another $500 billion to $3.5 trillion, the minimum size that a QE3 would require. This increases inflation risks down the road, a subject that Fed governors are ever cognizant of.
Nor is the Fed in the ?feel good? business. Even if we do see QE3, it is already priced in the market. It would be the most over-anticipated, non-surprise of the year. There would be no impact on the economy. Any boost would be psychological and brief. Leave that chore to your therapist, or your local bartender.
Finally, if China and Europe and launching their own stimulus programs, as they have done in the last week, why should the U.S. bother? Our economy is the healthiest of the bunch. We are the engine in this train, not the caboose.
I happen to know that at least three Fed governors agree with me. For a policy as momentous as QE3, with such long term implications for the health of the U.S. economy, Ben Bernanke would prefer to have a consensus. My Fed contacts assure me that the consensus is just not there.
What do we do in the face of any substantial sell off on a QE3 disappointment? You buy. I think that any plunge will be temporary, and it could be a matter of days or weeks before we resume an uptrend. The impending end of the presidential election is market positive, no matter who wins, and so is the resolution of the fiscal cliff after that.
 ?What's on Your Mind, Ben??