Mad Hedge Technology Letter
November 4, 2019
Fiat Lux
Featured Trade:
(THE CHICKENS COME HOME TO ROOST WITH SMALL TECH),
(AAPL), (MSFT), (AMZN), (GOOGL), (WDC), (TXI), (ANET), (PINS)
Mad Hedge Technology Letter
November 4, 2019
Fiat Lux
Featured Trade:
(THE CHICKENS COME HOME TO ROOST WITH SMALL TECH),
(AAPL), (MSFT), (AMZN), (GOOGL), (WDC), (TXI), (ANET), (PINS)
The tech story is still intact, but the edges are losing its shine.
That is the takeaway from the recent slew of earnings reports from many of the prominent yet second-tier tech companies.
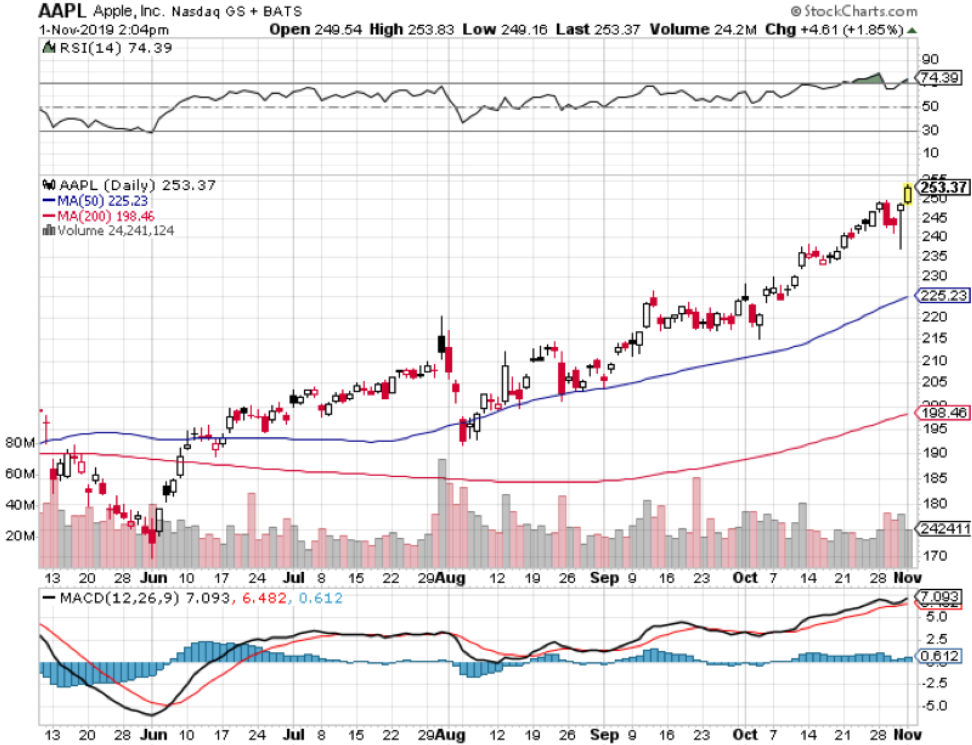
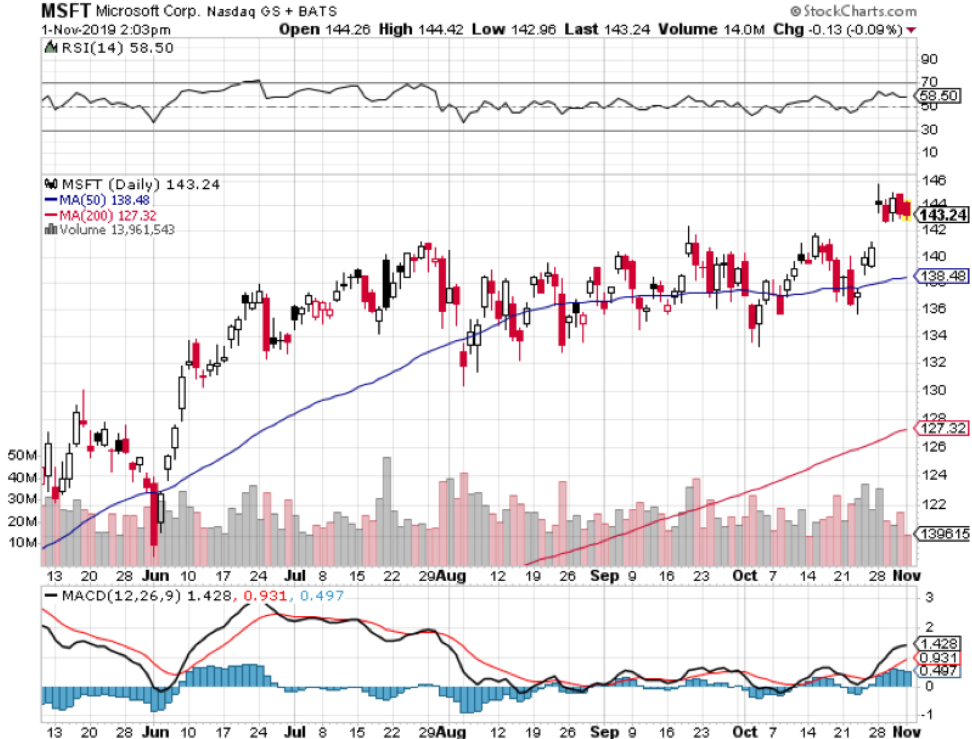
On one hand, companies like Apple (AAPL) have been holding the fort as it blasts through to new highs even amid the backdrop of the Chinese trade war that has dragged many of the strong tech names into the mud.
What we did see lately was a magnificent swan dive by chip names like Western Digital (WDC) and Texas Instruments (TXI) which were blindsided by 10-15% haircuts because of lackluster guidance.
The agony didn’t stop there with second rate cloud names like Pinterest (PINS) and Arista Networks, Inc. (ANET) reaching for scapegoats for their weak guidance. These took instant 20% haircuts.
The problem with smaller stocks like these besides having narrower spreads, they are slaves to just a few contracts and when one goes, their guidance and revenue estimates implode in their faces.
Arista slid more than 25% on news that they expect quarterly revenue of $540 million-$560 million, with the midpoint about 20% below the previous Street consensus at $686.2 million.
Arista CEO Jayshree Ullal said in a statement that the company expects “a sudden softening in Q4 with a specific cloud titan customer.”
That is Facebook who comprise about 10% of Arista’s revenue composition because Facebook has pulled back the reigns on cloud spend to cut costs amid a murky global backdrop and regulatory minefield.
Unfortunately, second tier cloud names must accept that they do not offer the best pricing when directly competing with the superior cloud names of Google Cloud, Microsoft Azure, and Amazon Web Services (AWS) because they simply can’t scale as well to the extent these monopolistic FANGs can.
Data storage often comes down to whoever has the cheapest cost of capital to pile into server farms allowing pricing to be ultra-cheap and these three companies win out.
If these firms lose one contract like Walmart’s switch over to Microsoft Azure from Amazon, it’s not a big deal.
It doesn’t put a 10% black hole in the revenue stream like for Arista.
Pinterest was one of the most overhyped IPOs of 2019 promising growth, growth and more growth.
Its digital ad business needs to deliver accelerating growth for its share price to rise and when the latest earnings report showed year-over-year growth slow from 62% to 47%, investors saw the writing on the wall.
The company only grew its users 8% in the lucrative North American market and 38% abroad.
But the foreign markets were tainted by the gruesome underbelly of earning only 13 cents per foreign users.
There is user growth but at the cost of an inferior quality of growth.
Analysts can clearly observe the accelerated erosion of Pinterest, and I can say from a personal point of view that the website isn’t that useful.
Management’s excuse was a tough comparison to the prior year but if a growth firm has a superior model, they should be able to grow past any minor problems if the secular trends stay hemmed in.
Weak excuses now and probably weak excuses next quarter as the global tech landscape gets squeezed even more at the periphery.
What does this all mean?
There has been a flight to tech quality into the Teflon names like Microsoft and Apple.
Names that are showing growth headaches saddled with too much competition and structural softness are getting killed.
Don’t even think about investing in the marginal names like Pinterest and Arista.
Better to be safe on your perch inside the moat than outside isolated from the drawbridge.
Not all tech is created equal and it's rearing its ugly face in a frothy market.

“I'd rather Apple cannibalize Apple than somebody else cannibalize Apple.” – Said Current CEO of Apple Tim Cook

Mad Hedge Technology Letter
November 1, 2019
Fiat Lux
Featured Trade:
(ZOOM ZOOMS IN THE IPO MARKET),
(ZM)
The 2019 IPO class delivered some charlatans but Zoom Video Communications (ZM) is by far and away the valedictorian of this cohort.
It’s not even close.
Sadly, the rest of the IPO class of 2019 is littered with failures and overhyped companies dumped onto the retail investors by the venture capitalists.
Let’s explore why Zoom Video Communications is a best of breed firm in their sub-sector.
Zoom Video is a video conferencing service headquartered in San Jose, California and founded by Eric Yuan.
Eric was previously vice president of engineering at Cisco for collaboration software development and realized there was no high-end video conferencing software at the time.
He took his show on the road and was able to nab 1 million users within the first 2 years after starting Zoom.
This is a real tech company with legitimate proprietary technology and unique source code.
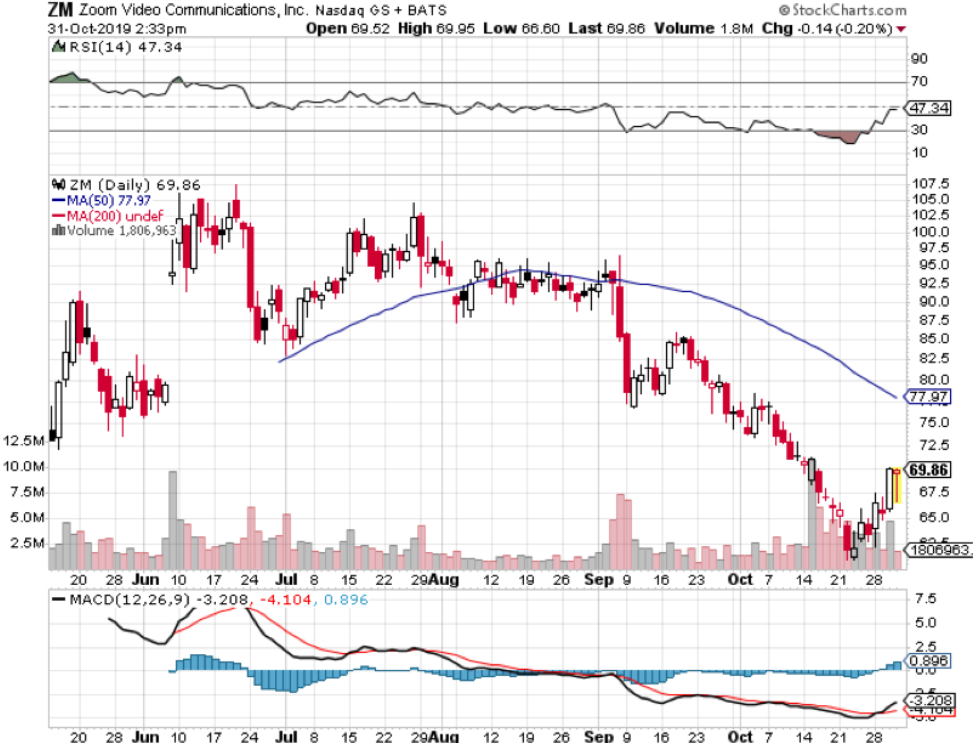
The revaluation from growth to value has hit the entire class of software growth stocks who over-rely on growth as a mechanism to boost shares.
Some have been unfairly punished like Zoom in the downgrade even though the company delivered a strong second-quarter earnings report.
Revenue exploded 96% to $145.8 million, which destroyed expectations of $130.3 million, and management boasted that the number of customers spending more than $100,000 annually on the cloud-based platform more than doubled, a signal that customers are juicing up their use of the service.
Most of the carnage from the rerouting out of growth stocks were specifically in loss-making, high cash burn stocks with the absence of sensible unit economics.
Well, Zoom easily passes this acid test as they have been profitable since the day they went public and even before then.
Even though Zoom has yet to tap the profitability Gods, the $5 million of profits last quarter is just the beginning and as they scale up, the bottom line will beef up.
Therefore, Zoom will not be reliant on outside capital to survive.
In another harbinger of a higher future stock price, adjusted earnings per share rose from $0.02 to $0.08, which also easily beat estimates of $0.01.
Zoom audaciously hiked their outlook for the year at a time when many companies of its ilk are guiding lower to insulate themselves from the global uncertainty permeating throughout the global corporate landscape.
The consolidation in this best of breed software stock will only be temporary aided by the fact that We Company has bottomed out and found a value after its horrendously botched IPO.
I am impressed with Zoom's superior products, growth prospects, and scalable business model, and the stock’s near-term risk/reward trade-off is attractive after the recent sell-off.
There is an obvious and manageable clear path to a $2 billion revenue run rate with strong margin expansion potential and with its flagship product growing around 100%, its next growth driver in Zoom Phone could translate well into a meaningful revenue stream.
Companies are increasingly allowing remote workers to traverse into a mobile lifestyle and Zoom Phone slots seamlessly into this equation.
Anyone that has used Zoom as a product can verify its superior performance standards which is head and shoulders above any competition.
If shares float down to the low 60s, it would be a great buy and hold stock, since actively trading new IPOs are often too volatile to lock in proper entry points.
“My goal was never to make Facebook cool. I am not a cool person.” – Said Co-Founder and CEO of Facebook Mark Zuckerberg


When John identifies a strategic exit point, he will send you an alert with specific trade information as to what security to sell, when to sell it, and at what price. Most often, it will be to TAKE PROFITS, but, on rare occasions, it will be to exercise a STOP LOSS at a predetermined price to adhere to strict risk management discipline. Read more
While the Diary of a Mad Hedge Fund Trader focuses on investment over a one week to a six-month time frame, Mad Day Trader, provided by Bill Davis, will exploit money-making opportunities over a brief ten minute to three-day window. It is ideally suited for day traders, but can also be used by long-term investors to improve market timing for entry and exit points. Read more
Global Market Comments
November 1, 2019
Fiat Lux
Featured Trade:
(OCTOBER 30 BIWEEKLY STRATEGY WEBINAR Q&A),
(SQ), (CCI), (SPG), (PGE), (BA), (MSFT), (GOOGL), (FB), (AAPL), (IBB), (XLV), (USO), (GM), (VNQ)

Below please find subscribers’ Q&A for the Mad Hedge Fund Trader October 30 Global Strategy Webinar broadcast from Silicon Valley, CA with my guest and co-host Bill Davis of the Mad Day Trader. Keep those questions coming!
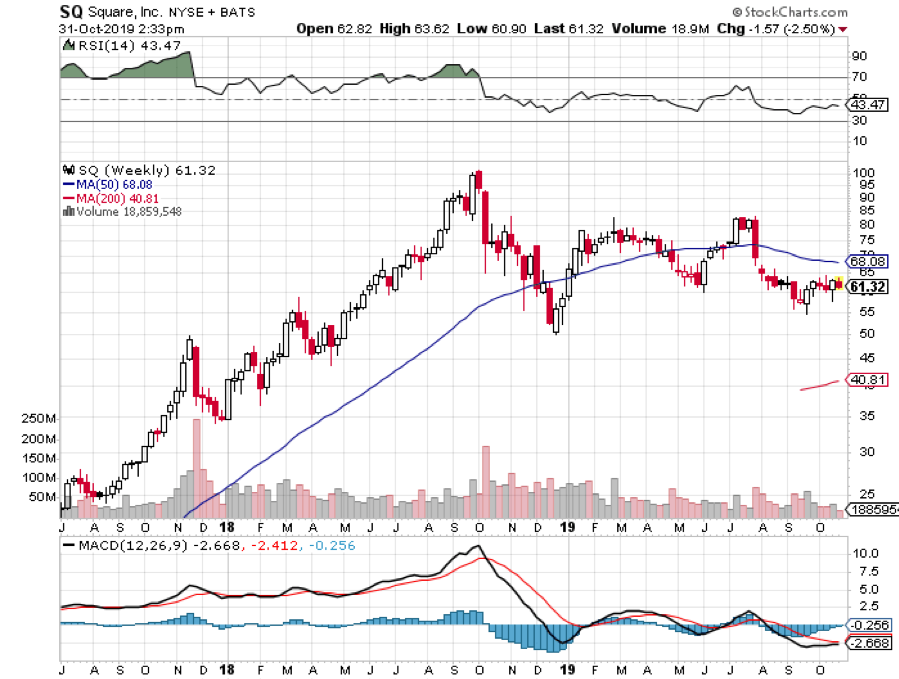
Q: Would you buy Square (SQ) around here?
A: I don’t want to buy anything around here—that’s why I’m 90% cash. Would I buy Square on a market selloff? Absolutely, it's one of our favorite fintech stocks for the long term. The fintech stocks are eating the lunch of the legacy banks at an accelerating rate.
Q: What's the best yield play currently, now that bonds have gone so high?
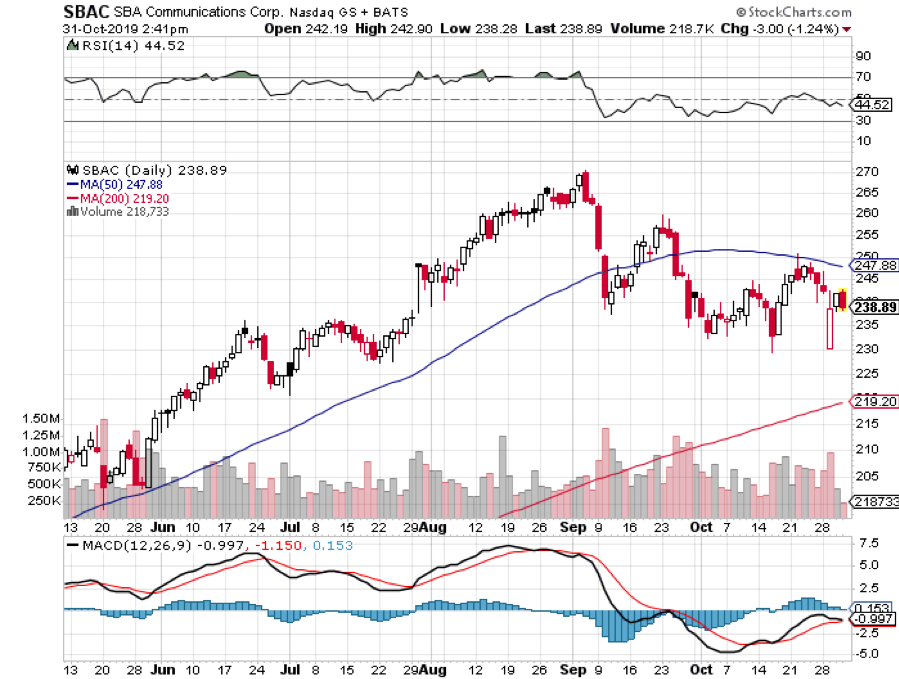
A: High-quality REITs—especially cell tower REITs. We’re going to get a significant increase in the number of cell towers, thanks to 5G, and there are REITs specifically dedicated to cell phone towers. An example is Crown Castle (CCI), which has a generous 3.45% dividend yield. The worst REITs are the mall-based like Simon Property Group (SPG).
Q: PG&E (PGE) has just had a huge selloff of 50%. Should I buy it now or is it a potential zero?
A: I wouldn’t touch PG&E at all—They’re already in bankruptcy, and they are now accepting responsibility for starting another eight fires this week, including the big Kincaid fires. You could have the state government take over the company and wipe out all the shareholders— the liabilities are just growing by the second, so I would turn my attention elsewhere. Don’t reach for new ways to get in trouble.
Q: Regarding Boeing (BA), it looks like you caught the bottom on the last dip—should I buy it here or wait for another dip?
A: Wait for another dip. The company seems to have an endless supply of bad news. That said, if we visit $325 a share one more time, I would buy it again. We caught about a $10 dollar move in Boeing to the upside. Keep buying the dips. The bad news story on this is almost over.
Q: Do you think the earnings season will be better than expected? If so, which sectors do you think will outperform?
A: It’s always better than expected because they always downgrade right before earnings, so everything is a surprise to the upside. Some 80% of all stocks surprise to the upside every quarter. And what would I be buying on dips? Big Tech. Especially things like Apple (AAPL), Facebook (FB), Alphabet (GOOGL), and Microsoft (MSFT) —that is where the only reliable longer-term growth is in the economy. If you want to buy cheap companies on dips, go for Biotech (IBB) and Health Care (XLV), which have gone up almost every day since we launched the Biotech letter a month ago. To subscribe to the Mad Hedge Biotech and Healthcare Letter, please click here.
Q: What does it mean that the Chile APEC summit is cancelled? What is Trump going to do now for signing on the trade deal?
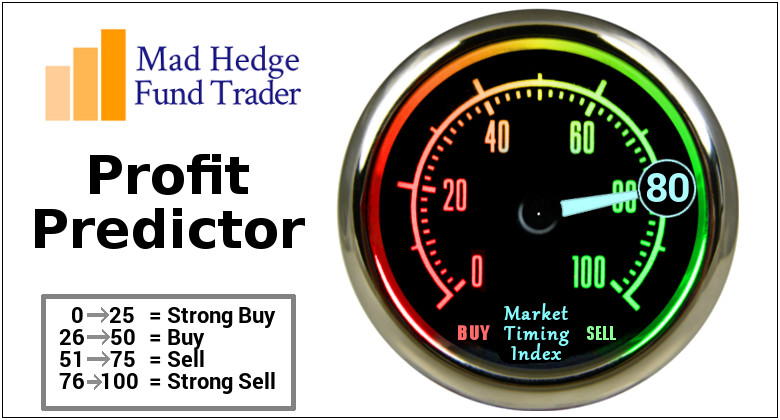
A: There may not be a trade deal. It's another postponement and could be another trigger for a long-overdue selloff in the market. We've basically been going up nonstop now for 2½ months, and almost everyone's market timing indicators are saying extreme overbought territory here, including ours.
Q: Will there be a replay of this webinar posted?
A: Yes, we always post these on the website a couple of hours after it airs. Some 95% of our viewers watch the recordings, especially those overseas in weird time zones like Australia and India. You need to be logged in to access it. Just go to www.madhedgefundtrader.com, log in, go to My Account, then Global Trading Dispatch, then click on the Webinars button. It’s there in all its glory.
Q: Does Invesco DB US Dollar Index Bullish Fund ETF (UUP) make sense (the dollar basket)?
A: No, I'm staying out of the currency market because there are no clear trends right now and there are much clearer trends in other asset classes, like stock and bonds.
Q: How do you see General Electric (GE)?
A: There are a lot of people shouting accounting fraud like Harry Markopolos, the whistleblower on Bernie Madoff. Sure, they had a good today, up a buck, but their problems are going to take a long time to fix. So, don't think of this as a trading vehicle, but rather a long-term investment vehicle.
Q: Could the Saudi Aramco IPO push the price of oil up?
A: You can bet they're going to do everything humanly possible to get the price of oil (USO) up and to get this IPO off their hands—that's why you shouldn't buy the IPO. The Saudis are desperate to get out of the oil business before prices go to zero and are pouring money into alternative energy and technology through Masayoshi Son’s Vision Fund. When you have the chief supplier of oil rigging the price, you don’t want to be anywhere near the distributor and that’s Saudi Aramco.
Q: What about selling the (SPG) (Simon Property) REIT?
A: It’s kind of too late to sell, but what you might think of doing is selling short just one deep out-of-the-money put, just to bring in a small amount of income. These things don’t crash, they grind down; so, it could be a good naked put shorting situation, but only on a very small scale. If you want to play REITs on the long side, look at the Vanguard Real Estate ETF (VNQ), which pays a handy 3.12% dividend. Guess what its largest holdings are? 5G cell tower REITs.
Q: Is General Motors (GM) a buy on the union detent?
A: Only for a trade, but not much; the auto industry is the last thing you want to buy into going into a recession, even just a growth recession.
Q: Have we topped out on Apple (AAPL) for the year at $250?
A: If we did, it’s probably just short term. Remember their 5G phone is coming out next September and I expect the stock to go to $300 dollars just off of that. Any dips in Apple won’t last more than a month or two.
Q: Could we get another leg up for the end of the year?
A: Yes, not much, maybe another 5% from here, and I wouldn't do that until we get another 5% drop in the market first which should happen sometime in November. If that happens, then you’ll have a shot at making another 10% by the end of the year, which is exactly what I plan on doing for myself. That would take our 2019 performance from 50% to 60%.
Q: Is the Fed’s printing infinite money going to lead to runaway inflation crashing the value of the dollar?
A: Yes, but it may take us a couple of years to get to that point. So far, no sign of inflation, except inflation of things you want to buy, like healthcare, a college education, and so on. For anything you want to sell, like your labor or service, the prices are collapsing. That’s the new inflation, the type that screws you the most.
Good Luck and Good Trading
John Thomas
CEO & Publisher
The Diary of a Mad Hedge Fund Trader