Featured Trade: (WHAT?S ON YOUR PLATE FOR THIS WEEK), (FXY), (FXE), (FXB), (SPY), (MAD OPTIONS TRADER KILLS IT WITH HIS FIRST WEEK), ?(SPX), (FB), (TESTIMONIAL)
CurrencyShares Japanese Yen ETF (FXY) CurrencyShares Euro ETF (FXE) CurrencyShares British Pound Ster ETF (FXB) SPDR S&P 500 ETF (SPY) S&P 500 (^SPX) Facebook, Inc. (FB)
The week will kick off further discounting the barnburner July Nonfarm Payroll Report, which reeled in a healthy 255,000 new jobs.
The economy has now added jobs for 70 consecutive months, the longest such streak in history.
I always use my two-day rule when it comes to this game changing data release. That?s how long it takes markets to fully discount it's impact.
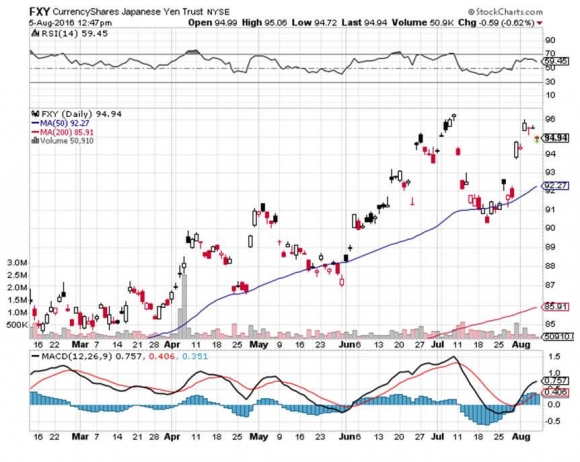
I managed to nail the number position wise, betting on a pop in the US dollar with a short in the Japanese yen, which duly took place.
A healthy US economy will drive the Federal Reserve to raise interest rates sooner, making it more attractive as a store of value.
This is especially true against the negative interest rate currencies of the Euro (FXE), the Yen (FXY), and soon to be, the British Pound (FXB).
At least that?s how it will be perceived by traders for the first few days.
I also made a timely exit from my short position in the S&P 500 (SPY) earlier in the week, clocking a 9.43% profit in only two trading days. Stocks rocketed to new all time highs on the news.
It?s been a very good week.
It is hard to argue with the strength of the payroll report. The headline unemployment rate stayed at a full employment 4.9%, rendering last week?s grim GDP report utterly meaningless.
The May payroll report was revised up by 13,000, while June added 5,000 new jobs.
The big gains were seen in professional and business services (+70,000), health care (+43,000), and leisure and hospitality (+45,000).
A new feature of the jobs picture this year is that the government has finally started adding jobs, largely through the hiring of teachers to accommodate local population growth.
Once again, mining was the big loser (-6,000) because it includes the beleaguered oil industry.
After the fireworks of last week, the coming five days will be a yawn on the data front.
Don?t forget that we also have the Rio Olympics all week, which, combined with the summer vacation schedule, tends to suck volatility out of markets.
I can?t tell you how many ?Out of Office? messages I am getting these days.
By the way, the Volatility Index (VIX) is approaching new decade lows.
On August 9th at 6:00 AM EST we get the NFIB Small Business Optimism Index, which should show a modest improvement.
On Wednesday at 10:00 AM EST the Labor Department JOLTS report should show a decline in job openings, reflecting the red hot July nonfarm payroll report.
At 8:30 AM EST on Thursday, the Weekly Jobless Claims gives us a more immediate read on the employment situation.
The Baker Hughes rig count wraps up as usual on Friday at 1:00 EST. Will the uptrend continue?
It all provides a healthy backdrop for a ?BUY EVERYTHING? approach to investing for the rest of 2016. Expect stocks, bonds, gold, and the dollar all to continue to appreciate to new highs.
As long as the US offers the highest yielding stocks and bonds in the developed world, this will continue to be true.
Adjust your trading accordingly. We are setting up for a melt up for the ages.
https://www.madhedgefundtrader.com/wp-content/uploads/2016/08/John-on-Deck-Overlooking-Alps-e1470435995343.jpg328400DougDhttps://madhedgefundtrader.com/wp-content/uploads/2019/05/cropped-mad-hedge-logo-transparent-192x192_f9578834168ba24df3eb53916a12c882.pngDougD2016-08-08 01:08:232016-08-08 01:08:23What?s On Your Plate for This Week?
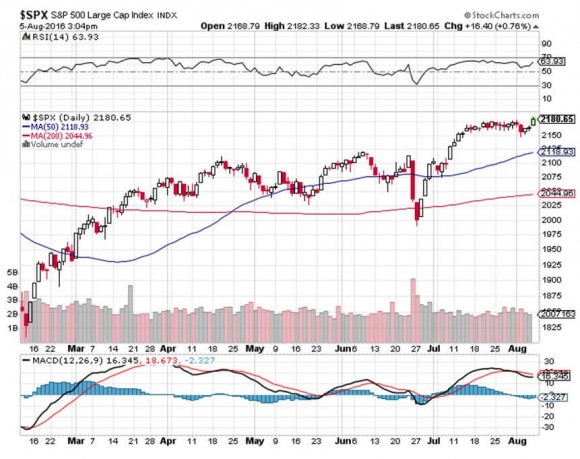
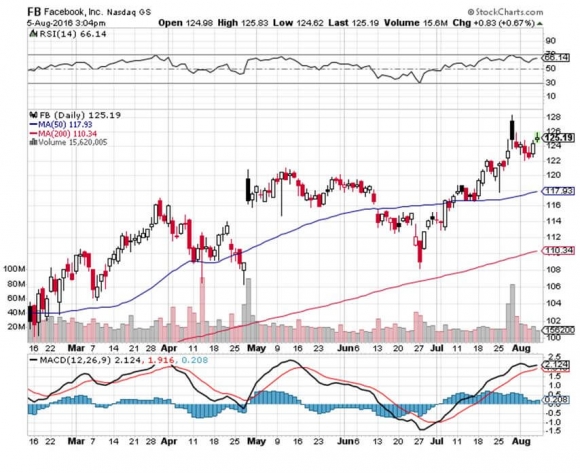
Mad Options Trader, Matt Buckley, absolutely knocked the cover off the ball last week, bringing in a monster 8%? return for his followers with four separate trades.
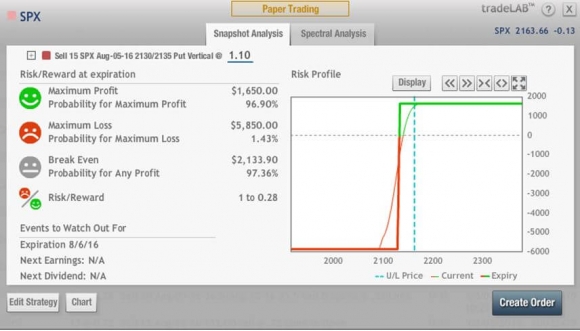
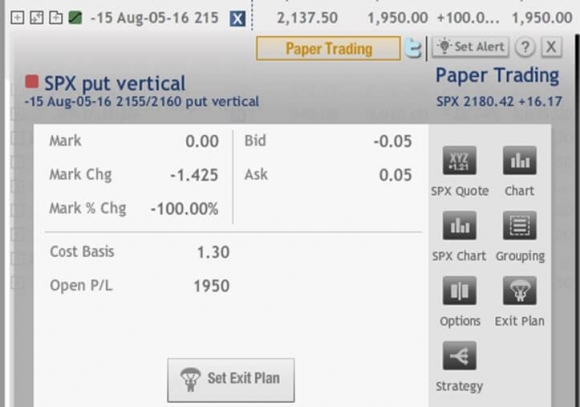
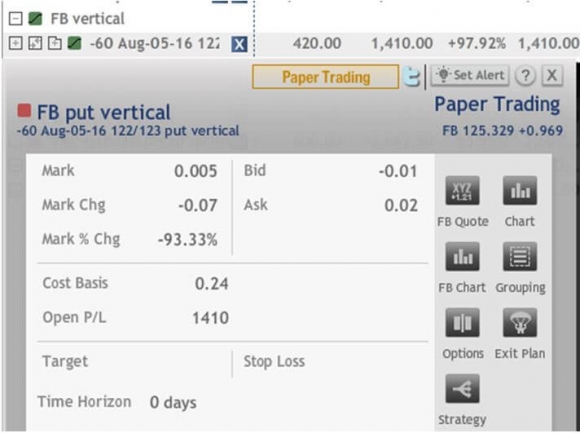
Perfectly timed long positions in the S&P 500 (SPX) and Facebook (FB) did the trick.
Those expired today, and Matt will have a new batch of trades for followers on Monday morning, but only if you sign in. Please find the screenshots for his closed trades below.
Matt?s unique service focuses primarily on the weekly US equity options expirations, with the goal of making profits at all times.
The trading will take place in the S&P 500 (SPY), major industry ETF?s like the Financials Select Sector (XLF), and large capitalized single names, such as Facebook (FB), JP Morgan Chase & Co. (JPM), and Apple (AAPL).
Matt is my old friend and fellow comrade in arms of Top Gun Options, one of the best performing trade mentoring outfits in the industry.
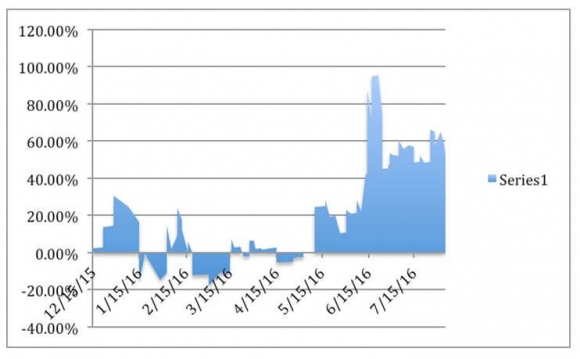
Matt knows what he is talking about. An independent audit shows that he has racked up an incredible 53.03% performance, net of commissions and fees, so far in 2016, one of the most difficult years in trading history.
That works out to an average 7.92% a month, or an incredible 95.09% a year.
Matt, a native of New Jersey, joined the Navy straight out of college, and rose to become an F-18/A fighter pilot. He attended the famed Top Gun school in Coronado, California. During the second Iraq War, Matt flew 44 combat missions.
Matt left the service in 2006, and immediately entered the hedge fund industry. A rapid series of promotions eventually took him to Peak6 Investments, L.P., a prominent Chicago hedge fund.
There, he soaked up the most successful elements of technical market timing, fundamental name selection, risk control, and options trade execution.
These are the multiple skills that have enabled Matt to post such a blockbuster performance.
Matt, known to his friends by his old pilot handle of ?Whiz?, is an incredibly valuable addition to the Mad Hedge Fund Trader team. I have appointed him Head of Options Trading.
I have known for some time that fortunes were being made in the weekly options expirations, where stories of tenfold returns are not unheard of. It is a strategy that is perfectly suited to these highly volatile, uncertain times, with most options positions expiring within four days.
Matt allows us to fill that gap in our product offerings.
The Mad Options Trader provides essential support for the active trader and will include:
1) Instant Trade Alerts sent out at key technical levels, an average of one a day. Alerts will be sent out on the opening and closing of every position.
2) Weekly Market Strategy Webinars held every Monday afternoon at 1:00 PM EST to give you a head?s up on the week ahead.
3) A weekly Live Trading Room held every Tuesday from 9:00 to 11:00 AM EST to give followers active real time trading experience.
4) Specialized Training Webinars on how to best execute Matt?s trades.
What I love about Matt is that he eats his own cooking. Many of the Trade Alerts he recommends are executed in his own personal retirement account with real dollars.
To see how he has performed so far in 2016, please check out the daily chart below.
You will have an ample opportunity to measure The Mad Options Trader?s abilities starting August 1st.
That?s when all current paid subscribers for any product of the Mad Hedge Fund Trader start receiving the service for free for 30 days.
From September 1, The Mad Options Trader will be available as a $1,500 per year upgrade to The Diary of the Mad Hedge Fund Trader or Global Trading Dispatch, the core research and trade mentoring service of the Mad Hedge Fund Trader.
The price for both services together will be $4,500 a year.
So, use this opportunity wisely, and watch how the Mad Options Trader performs over the coming month, FOR FREE.
Good Luck and Good Trading, John Thomas Publisher and CEO of the Mad Hedge Fund Trader
https://www.madhedgefundtrader.com/wp-content/uploads/2016/08/Matt-Buckley-e1469830914353.jpg400270DougDhttps://madhedgefundtrader.com/wp-content/uploads/2019/05/cropped-mad-hedge-logo-transparent-192x192_f9578834168ba24df3eb53916a12c882.pngDougD2016-08-08 01:07:392016-08-08 01:07:39Mad Options Trader Kills It His First Week
Thank you for the call I received from your staff the other day, but I?m afraid I?m not going to be able to renew my subscription to the Mad Hedge Fund Trader.
There?s nothing I?d like to do more than renew. I truly enjoy your insights on the markets and a description of your many travels. I have been following you for years and it is really a great deal.
However, I am active duty Air Force and recently got a command job. That means I have to go off to the Air War College. I know you didn?t get that far in your service, but consider yourself lucky. I have to read 100 pages a day, and it is a major commitment of time. So I can?t give you the time you deserve.
I hope to re up at a later date.
Charlie Lieutenant Colonel US Air Force Dell Rio, Texas
Note from John Thomas: Thank you for your service Charlie.
John Thomas Flying a 1943 Boeing B-17 Bomber Flying Fortress
https://www.madhedgefundtrader.com/wp-content/uploads/2014/09/John-Thomas-Bomber.jpg255402Mad Hedge Fund Traderhttps://madhedgefundtrader.com/wp-content/uploads/2019/05/cropped-mad-hedge-logo-transparent-192x192_f9578834168ba24df3eb53916a12c882.pngMad Hedge Fund Trader2016-08-08 01:06:192016-08-08 01:06:19Testimonial
While the Diary of a Mad Hedge Fund Trader focuses on investment over a one week to six-month time frame, Mad Day Trader, provided by Bill Davis, will exploit money-making opportunities over a brief ten minute to three day window. It is ideally suited for day traders, but can also be used by long-term investors to improve market timing for entry and exit points. Read more
https://madhedgefundtrader.com/wp-content/uploads/2019/05/cropped-mad-hedge-logo-transparent-192x192_f9578834168ba24df3eb53916a12c882.png00DougDhttps://madhedgefundtrader.com/wp-content/uploads/2019/05/cropped-mad-hedge-logo-transparent-192x192_f9578834168ba24df3eb53916a12c882.pngDougD2016-08-05 09:12:232016-08-05 09:12:23August 5, 2016 - MDT Pro Tips A.M.
The original purpose of this letter was to build a database of ideas to draw on in the management of my hedge fund.
When a certain trade comes into play, I merely type in the symbol, name, currency, or commodity into the search box, and the entire fundamental argument in favor of that position pops up.
You can do the same. Just type anything into the search box with the little magnifying glass found on the Member's Home Page in the upper right hand side, and a cornucopia of data, charts, and opinions will appear.
You can also search by date or topic using the boxes on the bottom of the right hand column.
The data base goes back to February, 2008, totaling 8 million words, or 13 times the length of Tolstoy?s War and Peace. Watching the traffic over time, I can tell you how the database is being used:
1) Small hedge funds want to see what the large hedge funds are doing.
2) Large hedge funds look to see what they have missed, which is usually nothing.
3) Midwestern advisors to find out what is happening in New York and Chicago.
4) American investors to find out if there are any opportunities overseas (there always are).
5) Foreign investors to find out what the hell is happening in the US (about 1,000 inquiries a day come in through Google?s translation software).
6) Specialist traders in stocks, bonds, currencies, commodities, and precious metals looking for cross market insights which will give them a trading advantage with their own book.
7) High net worth individuals managing their own portfolios so they don?t get screwed on management fees.
8) Low net worth individuals, students, and the military looking to expand their knowledge of financial markets (lots of free online time in the Navy).
9) People at the Treasury and the Fed trying to find out what the private sector is doing.
10) Staff at the SEC and the CFTC to see if there is anything new they should be regulating.
11) More staff at the Congress and the Senate looking for new hot button issues to distort and obfuscate.
12) Yet, even more staff in Obama?s office gauging his popularity and the reception of his policies.
13) As far as I know, no justices on the Supreme Court read my letter. They?re all closet indexers.
14) Prospective subscribers attempting to ascertain if I have the slightest idea of what I am talking about.
15) Me trying to remember trades which I recommended long ago.
16) Me looking for trades that worked so I can say ?I told you so.?
It?s there, it?s free, so please use it.
https://www.madhedgefundtrader.com/wp-content/uploads/2015/12/Woman-Slapping-Head.jpg384326Mad Hedge Fund Traderhttps://madhedgefundtrader.com/wp-content/uploads/2019/05/cropped-mad-hedge-logo-transparent-192x192_f9578834168ba24df3eb53916a12c882.pngMad Hedge Fund Trader2016-08-05 01:06:182016-08-05 01:06:18Please Use My Free Searchable Data Base
?They say when you get old, you become wise. The truth is that when you get old, all the people who know you are stupid are dead,? said the late comedian, Joan Rivers.
https://www.madhedgefundtrader.com/wp-content/uploads/2014/09/Joan-Rivers.jpg285229Mad Hedge Fund Traderhttps://madhedgefundtrader.com/wp-content/uploads/2019/05/cropped-mad-hedge-logo-transparent-192x192_f9578834168ba24df3eb53916a12c882.pngMad Hedge Fund Trader2016-08-05 01:05:192016-08-05 01:05:19August 5, 2016 - Quote of the Day
As a potentially profitable opportunity presents itself, John will send you an alert with specific trade information as to what should be bought, when to buy it, and at what price. This is your chance to ?look over? John Thomas? shoulder as he gives you unparalleled insight on major world financial trends BEFORE they happen.Read more
https://www.madhedgefundtrader.com/wp-content/uploads/2011/10/slider-05-trader-alert.jpg316600Mad Hedge Fund Traderhttps://madhedgefundtrader.com/wp-content/uploads/2019/05/cropped-mad-hedge-logo-transparent-192x192_f9578834168ba24df3eb53916a12c882.pngMad Hedge Fund Trader2016-08-04 12:14:042016-08-04 12:14:04Trade Alert - (FXY) August 4, 2016
While the Diary of a Mad Hedge Fund Trader focuses on investment over a one week to six-month time frame, Mad Day Trader, provided by Bill Davis, will exploit money-making opportunities over a brief ten minute to three day window. It is ideally suited for day traders, but can also be used by long-term investors to improve market timing for entry and exit points. Read more
https://madhedgefundtrader.com/wp-content/uploads/2019/05/cropped-mad-hedge-logo-transparent-192x192_f9578834168ba24df3eb53916a12c882.png00DougDhttps://madhedgefundtrader.com/wp-content/uploads/2019/05/cropped-mad-hedge-logo-transparent-192x192_f9578834168ba24df3eb53916a12c882.pngDougD2016-08-04 09:13:142016-08-04 09:13:14August 4, 2016 - MDT Pro Tips A.M.
Legal Disclaimer
There is a very high degree of risk involved in trading. Past results are not indicative of future returns. MadHedgeFundTrader.com and all individuals affiliated with this site assume no responsibilities for your trading and investment results. The indicators, strategies, columns, articles and all other features are for educational purposes only and should not be construed as investment advice. Information for futures trading observations are obtained from sources believed to be reliable, but we do not warrant its completeness or accuracy, or warrant any results from the use of the information. Your use of the trading observations is entirely at your own risk and it is your sole responsibility to evaluate the accuracy, completeness and usefulness of the information. You must assess the risk of any trade with your broker and make your own independent decisions regarding any securities mentioned herein. Affiliates of MadHedgeFundTrader.com may have a position or effect transactions in the securities described herein (or options thereon) and/or otherwise employ trading strategies that may be consistent or inconsistent with the provided strategies.